| Param | Original file | Final file |
|---|---|---|
| Filename | modeM0/AS1T02_011T01_9000001940_13151cztM0_level2.evt | modeM0/AS1T02_011T01_9000001940_13151cztM0_level2_quad_clean.evt |
| Size (bytes) | 1,657,529,280 | 279,610,560 |
| Size | 1.5 GB | 266.7 MB |
| Events in quadrant A | 11,105,533 | 1,760,637 |
| Events in quadrant B | 15,082,601 | 1,740,056 |
| Events in quadrant C | 9,975,203 | 1,780,943 |
| Events in quadrant D | 12,555,686 | 1,678,922 |
| Mode M9 | |||
|---|---|---|---|
| Quadrant | BADHDUFLAG | Total packets | Discarded packets |
| A | 0 | 5 | 0 |
| B | 0 | 5 | 0 |
| C | 0 | 5 | 0 |
| D | 0 | 5 | 0 |
| Mode M0 | |||
|---|---|---|---|
| Quadrant | BADHDUFLAG | Total packets | Discarded packets |
| A | 0 | 47121 | 5 |
| B | 0 | 59193 | 5 |
| C | 0 | 45131 | 5 |
| D | 0 | 52310 | 5 |
| Mode SS | |||
|---|---|---|---|
| Quadrant | BADHDUFLAG | Total packets | Discarded packets |
| A | 0 | 444 | 0 |
| B | 0 | 444 | 0 |
| C | 0 | 444 | 0 |
| D | 0 | 444 | 0 |
| Quadrant | Total seconds | Saturated seconds | Saturation percentage |
|---|---|---|---|
| A | 21887 | 622 | 2.841870% |
| B | 21887 | 2314 | 10.572486% |
| C | 21887 | 475 | 2.170238% |
| D | 21887 | 898 | 4.102892% |
Noise dominated data is calculated using 1-second bins in cleaned event files. If a bin has >2000 counts, and if more than 50% of those come from <1% of pixels, then it is considered to be noise-dominated and hence unusable.
| Quadrant | # 1 sec bins | Bins with >0 counts | Bins with >2000 counts | High rate bins dominated by noise | Noise dominated (total time) | Noise dominated (detector-on time) | Marked lightcurve |
|---|---|---|---|---|---|---|---|
| A | 22523 | 21893 | 9 | 9 | 0.04% | 0.04% | 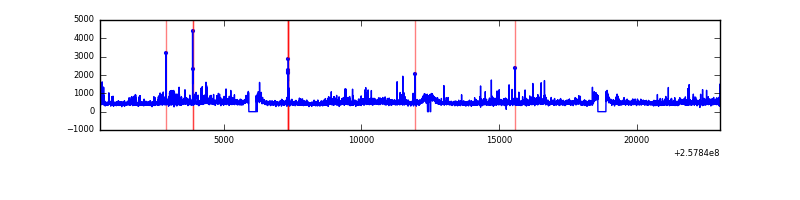 |
| B | 22523 | 21893 | 947 | 947 | 4.20% | 4.33% | 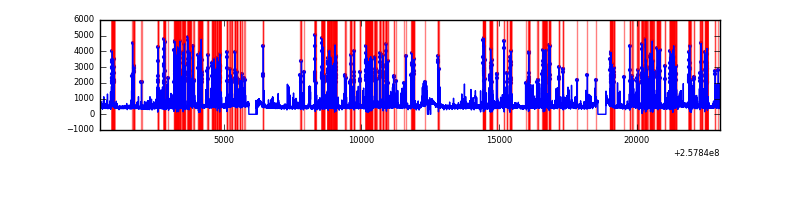 |
| C | 22523 | 21893 | 11 | 11 | 0.05% | 0.05% | 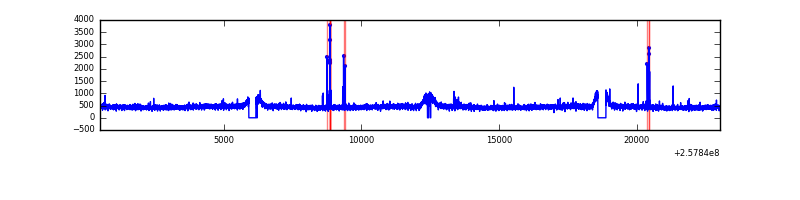 |
| D | 22523 | 21893 | 317 | 317 | 1.41% | 1.45% | 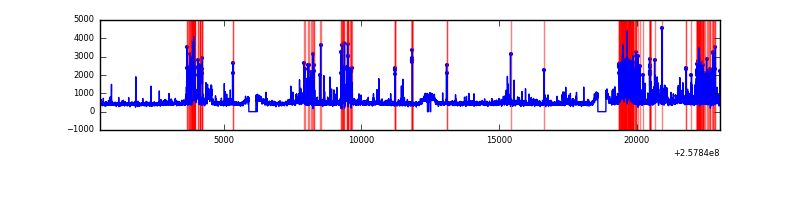 |
Top three noisy pixels from each quadrant. If the there are fewer than three noisy pixels in the level2.evt file, extra rows are filled as -1
| Pixel properties | Quadrant properties | ||||||
|---|---|---|---|---|---|---|---|
| Quadrant | DetID | PixID | Counts | Sigma | Mean | Median | Sigma |
| A | 12 | 189 | 607977 | 1170.97 | 2566 | 2510 | 517.1 |
| A | 0 | 23 | 152689 | 290.44 | 2566 | 2510 | 517.1 |
| A | 1 | 162 | 136168 | 258.49 | 2566 | 2510 | 517.1 |
| B | 4 | 239 | 4323428 | 9217.92 | 2464 | 2398 | 468.8 |
| B | 3 | 64 | 513519 | 1090.36 | 2464 | 2398 | 468.8 |
| B | 0 | 85 | 236240 | 498.85 | 2464 | 2398 | 468.8 |
| C | 0 | 207 | 86852 | 144.42 | 2528 | 2538 | 583.8 |
| C | 13 | 61 | 18220 | 26.86 | 2528 | 2538 | 583.8 |
| C | 15 | 208 | 16842 | 24.5 | 2528 | 2538 | 583.8 |
| D | 1 | 52 | 1789399 | 2996.61 | 2495 | 2422 | 596.3 |
| D | 5 | 222 | 633881 | 1058.9 | 2495 | 2422 | 596.3 |
| D | 8 | 195 | 269408 | 447.71 | 2495 | 2422 | 596.3 |
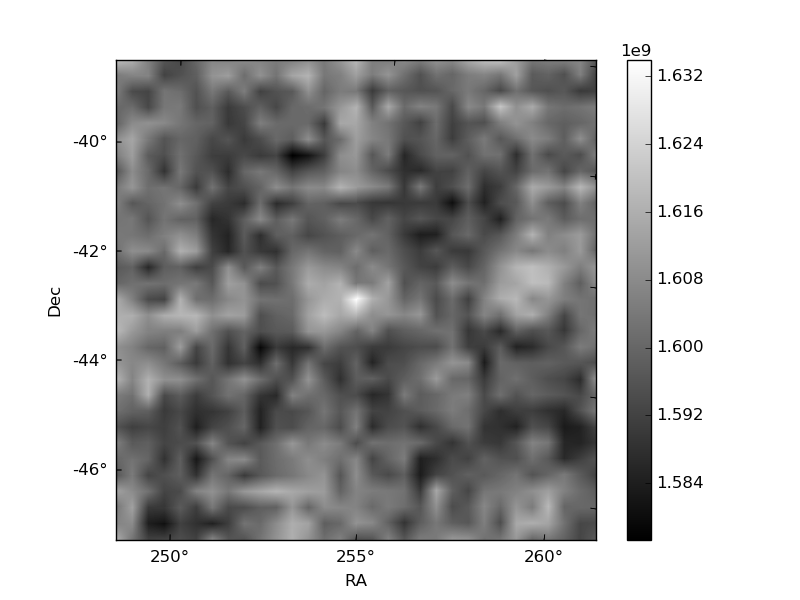
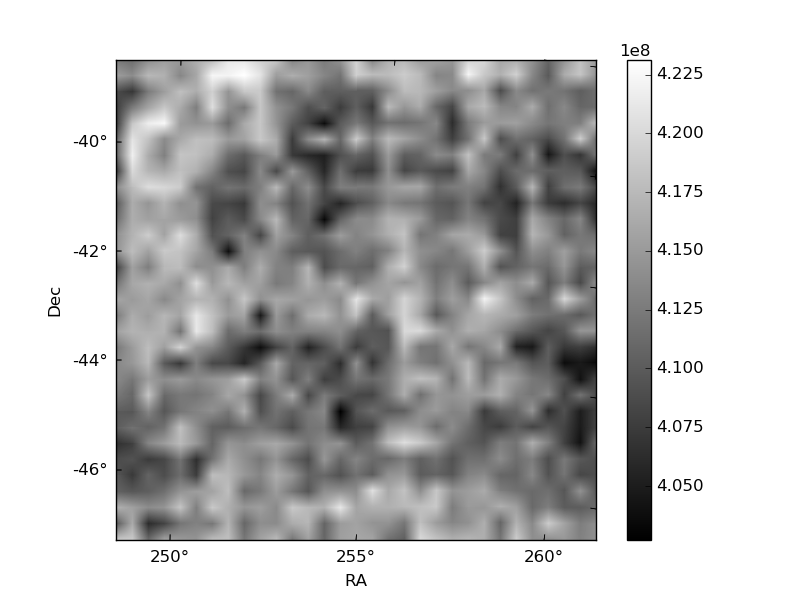
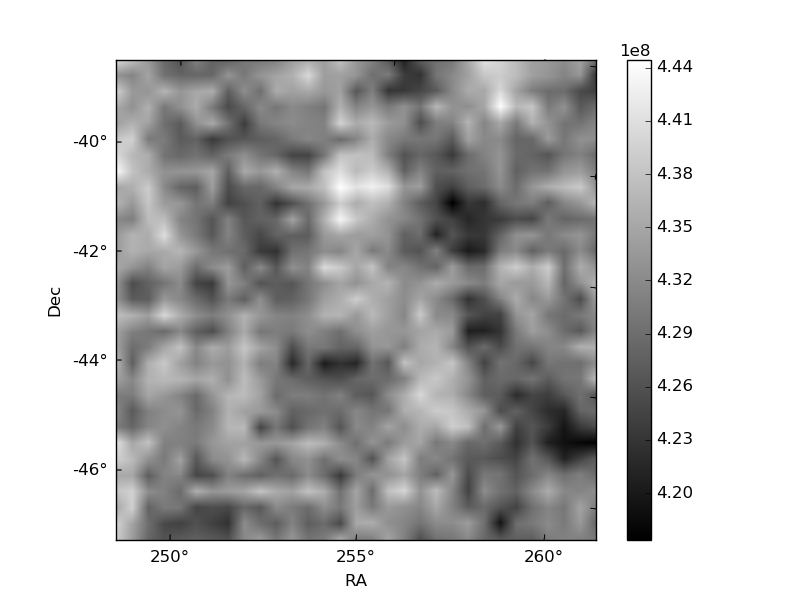
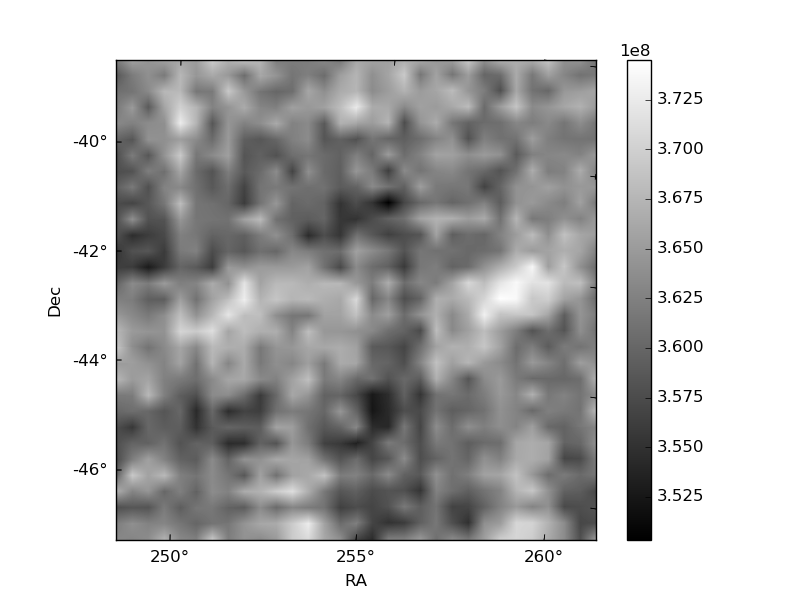
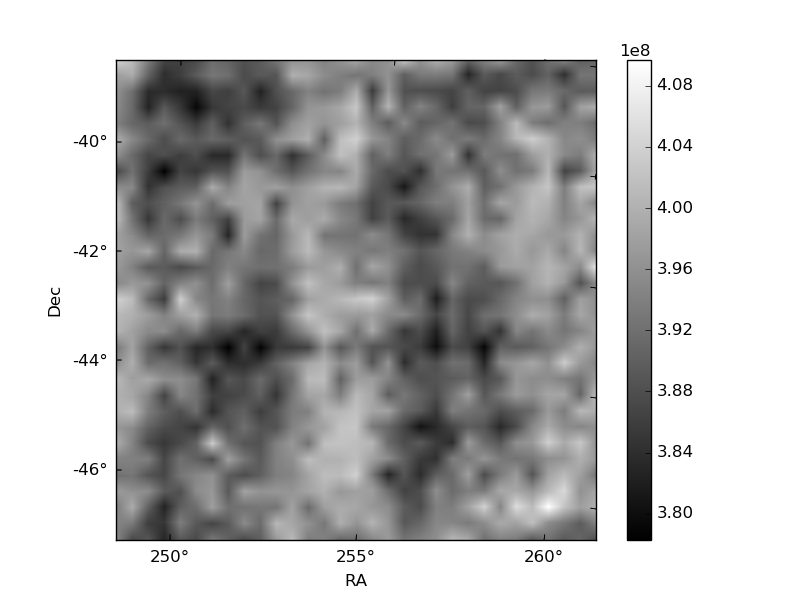
Histogram calculated using DETX and DETY for each event in the final _common_clean file
| Quadrant A | 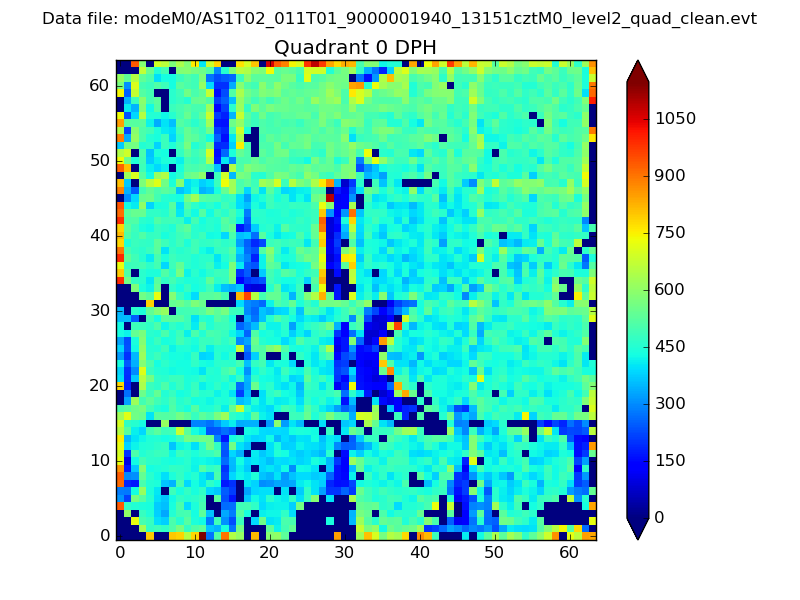 |
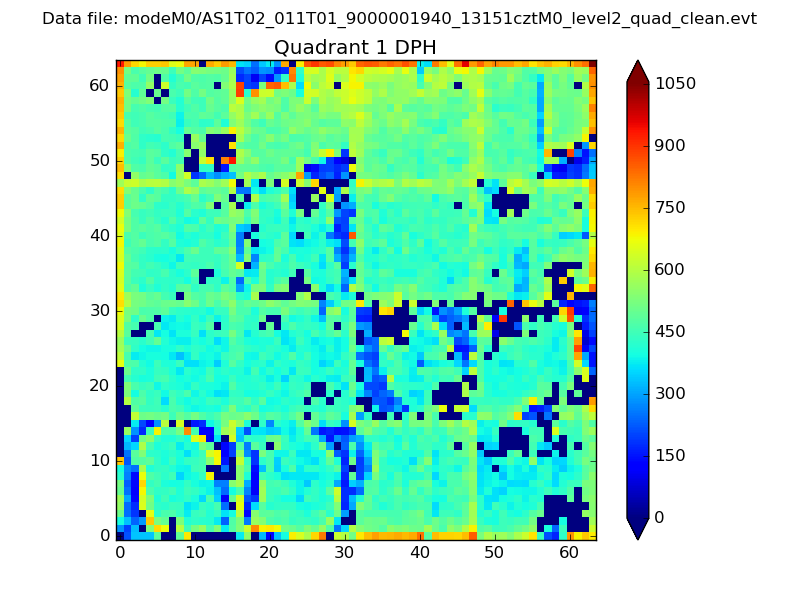 |
Quadrant B |
|---|---|---|---|
| Quadrant D |  |
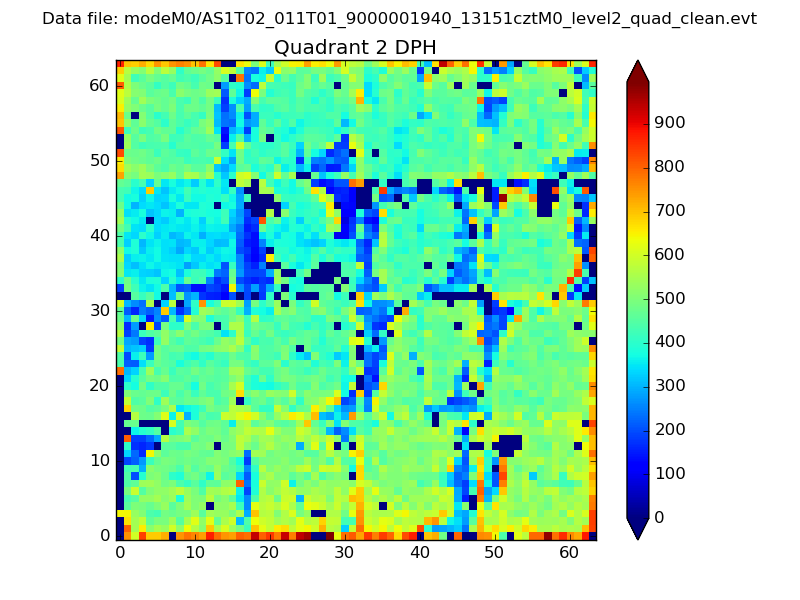 |
Quadrant C |
| Plot type | Count rate plots | Images |
|---|---|---|
| Comparison with Poisson distribution Blue bars denote a histogram of data divided into 1 sec bins. Red curve is a Poisson curve with rate = median count rate of data. |
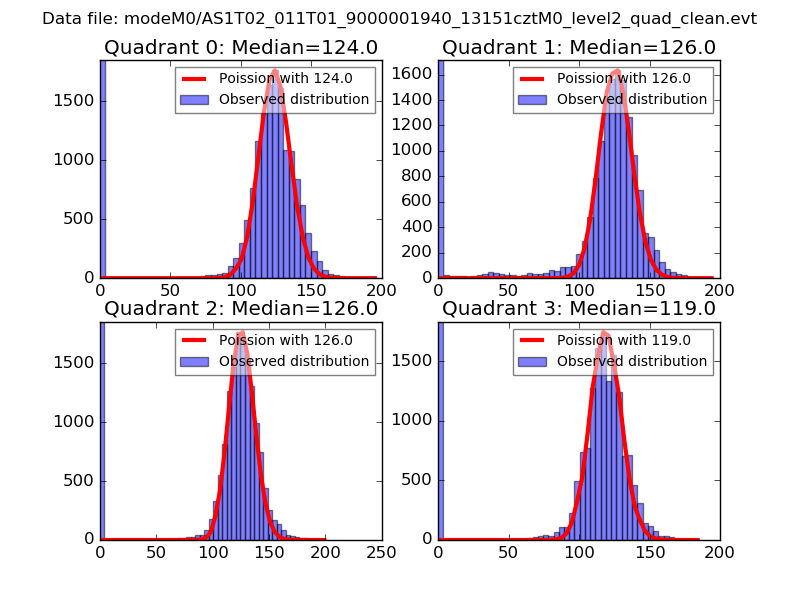 |
 |
| Quadrant-wise count rates Data is divided into 100 sec bins |
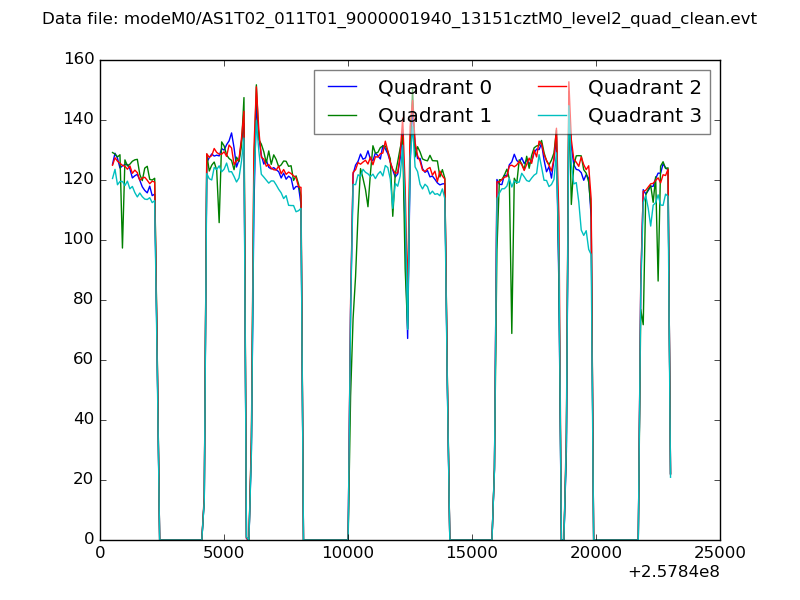 |
|
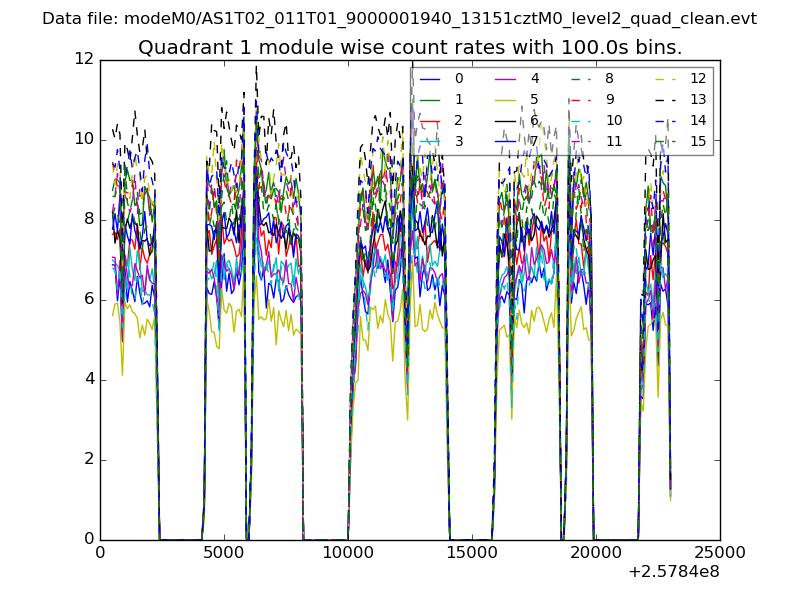
| Module-wise count rates for Quadrant A Data is divided into 100 sec bins |
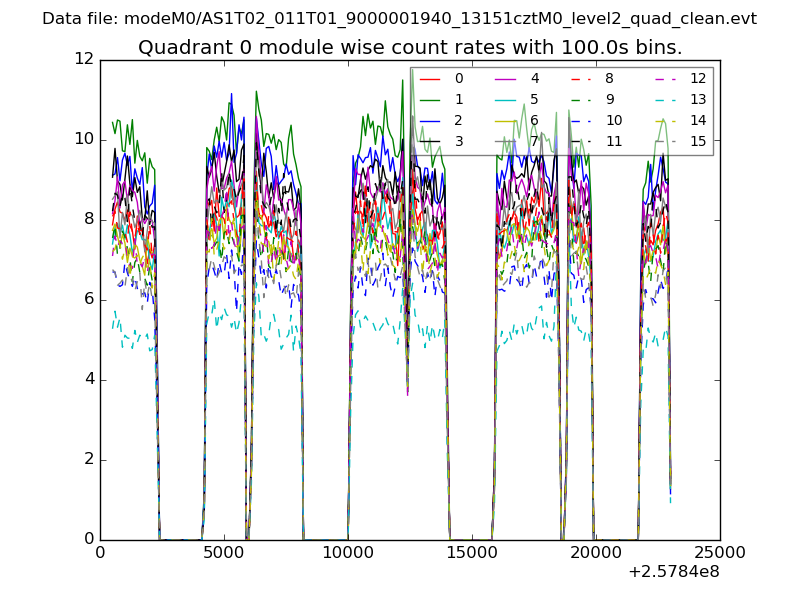 |
 |
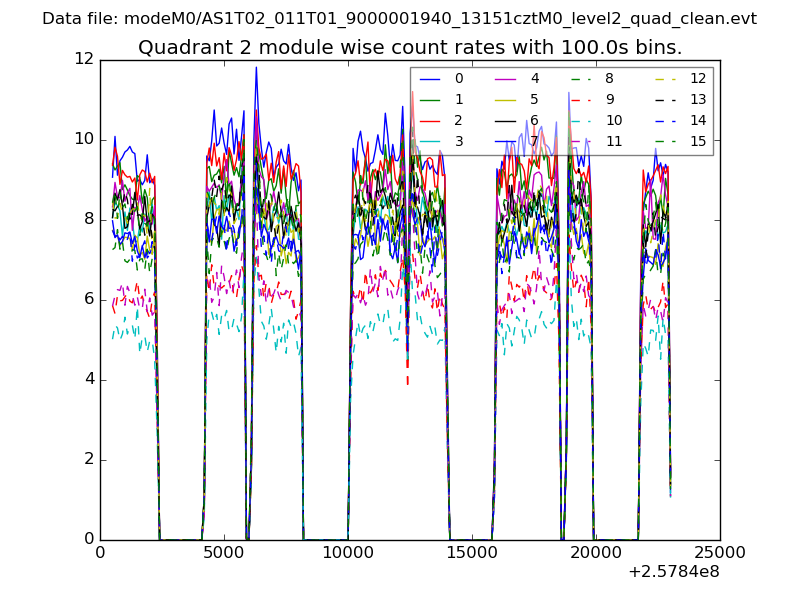
| Module-wise count rates for Quadrant B Data is divided into 100 sec bins |
 |
 |
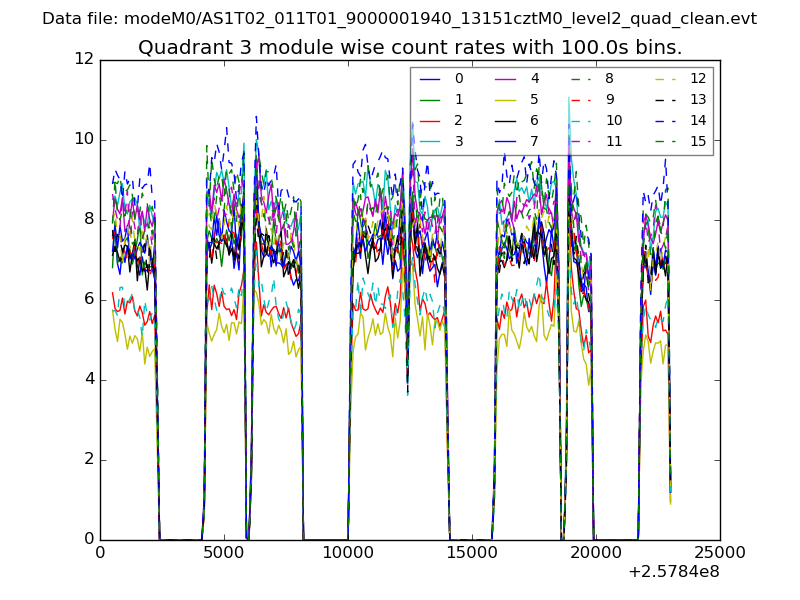
| Module-wise count rates for Quadrant C Data is divided into 100 sec bins |
 |
 |
| Module-wise count rates for Quadrant D Data is divided into 100 sec bins |
 |
 |
| Parameter | Plot |
|---|---|
| CZT HV Monitor | 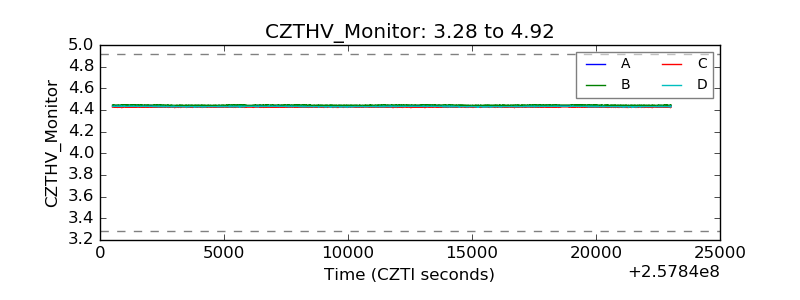 |
| D_VDD | 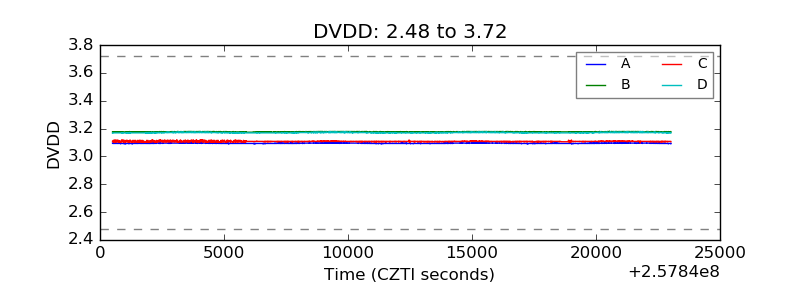 |
| Temperature 1 | 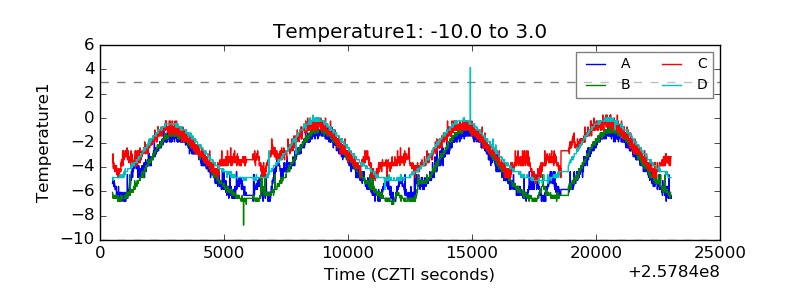 |
| Veto HV Monitor | 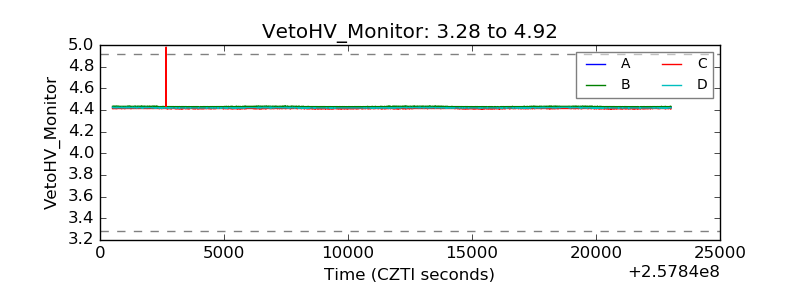 |
| Veto LLD | 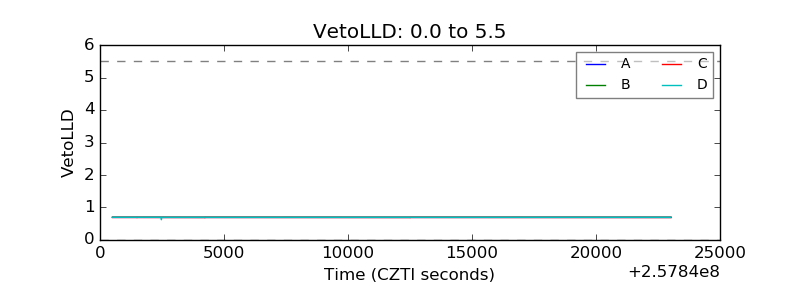 |
| Alpha Counter | 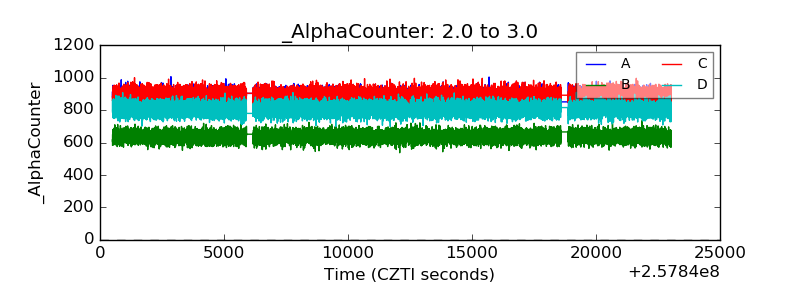 |
| _CPM_Rate | 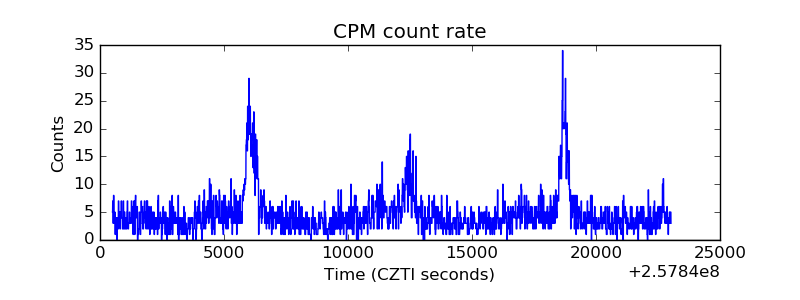 |
| CZT Counter | 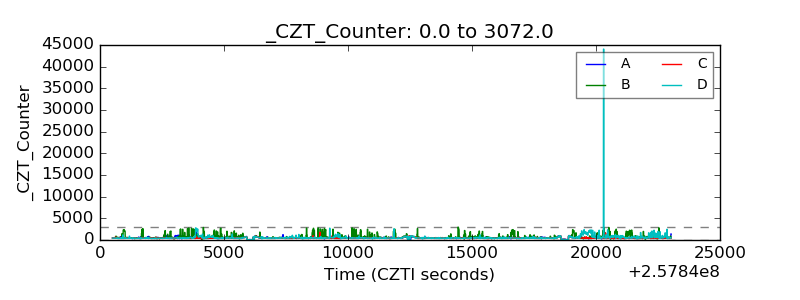 |
| +2.5 Volts monitor |  |
| +5 Volts monitor | 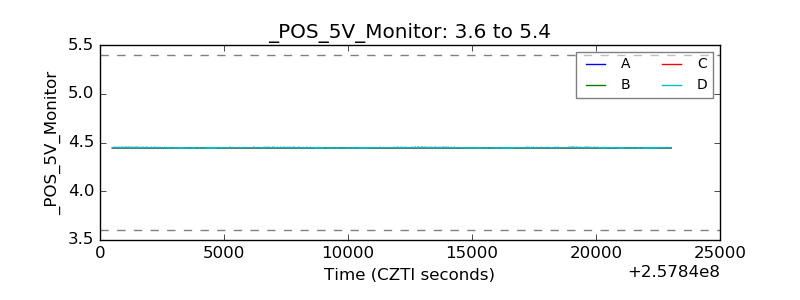 |
| _ROLL_ROT | 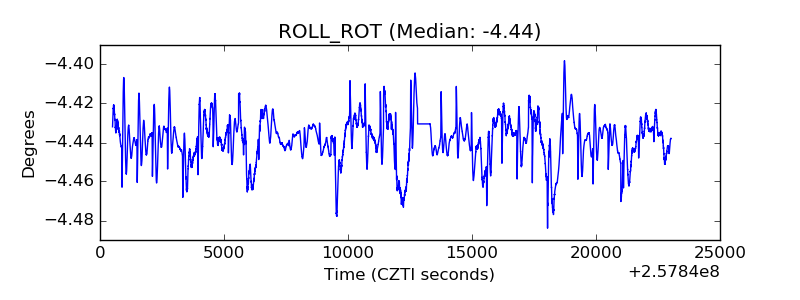 |
| _Roll_DEC | 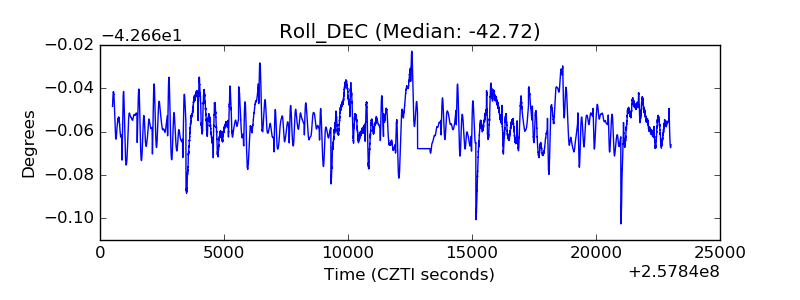 |
| _Roll_RA | 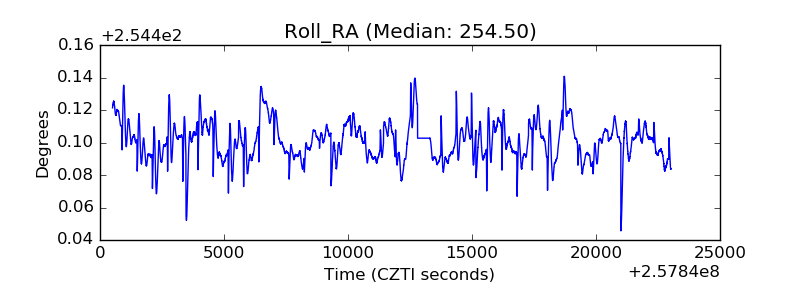 |
| Veto Counter | 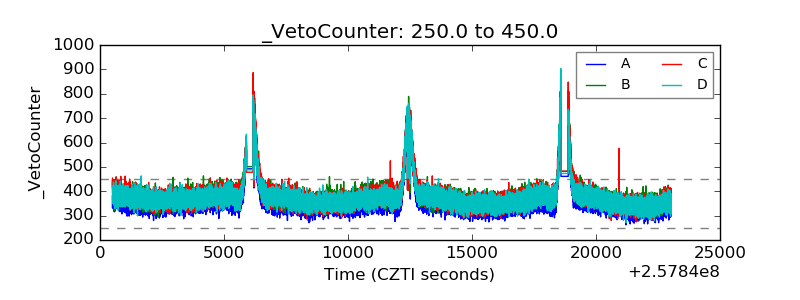 |