| Param | Original file | Final file |
|---|---|---|
| Filename | modeM0/AS1A04_094T01_9000001942cztM0_level2.fits | modeM0/AS1A04_094T01_9000001942cztM0_level2_quad_clean.evt |
| Size (bytes) | 917,101,440 | 953,769,600 |
| Size | 874.6 MB | 909.6 MB |
| Events in quadrant A | 5,541,934 | 5,733,581 |
| Events in quadrant B | 5,158,406 | 5,604,506 |
| Events in quadrant C | 5,557,944 | 5,641,056 |
| Events in quadrant D | 4,728,200 | 5,123,730 |
| Mode SS | |||
|---|---|---|---|
| Quadrant | BADHDUFLAG | Total packets | Discarded packets |
| A | 0 | 2016 | 0 |
| B | 0 | 2016 | 0 |
| C | 0 | 2016 | 0 |
| D | 0 | 2016 | 0 |
| Mode M9 | |||
|---|---|---|---|
| Quadrant | BADHDUFLAG | Total packets | Discarded packets |
| A | 0 | 164 | 0 |
| B | 0 | 164 | 0 |
| C | 0 | 164 | 0 |
| D | 0 | 164 | 0 |
| Mode M0 | |||
|---|---|---|---|
| Quadrant | BADHDUFLAG | Total packets | Discarded packets |
| A | 0 | 212243 | 0 |
| B | 0 | 256628 | 0 |
| C | 0 | 203338 | 0 |
| D | 0 | 241376 | 0 |
| Quadrant | Total seconds | Saturated seconds | Saturation percentage |
|---|---|---|---|
| A | 98970 | 1376 | 1.390320% |
| B | 98972 | 7674 | 7.753708% |
| C | 98978 | 993 | 1.003253% |
| D | 98969 | 3930 | 3.970940% |
Noise dominated data is calculated using 1-second bins in cleaned event files. If a bin has >2000 counts, and if more than 50% of those come from <1% of pixels, then it is considered to be noise-dominated and hence unusable.
| Quadrant | # 1 sec bins | Bins with >0 counts | Bins with >2000 counts | High rate bins dominated by noise | Noise dominated (total time) | Noise dominated (detector-on time) | Marked lightcurve |
|---|---|---|---|---|---|---|---|
| A | 115329 | 98979 | 0 | 0 | 0.00% | 0.00% | 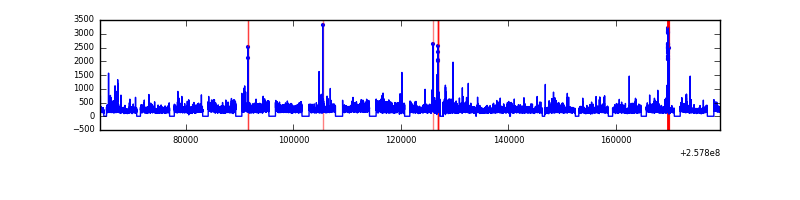 |
| B | 115329 | 98150 | 0 | 0 | 0.00% | 0.00% |  |
| C | 115329 | 98978 | 0 | 0 | 0.00% | 0.00% |  |
| D | 115329 | 98858 | 0 | 0 | 0.00% | 0.00% |  |
Top three noisy pixels from each quadrant. If the there are fewer than three noisy pixels in the level2.evt file, extra rows are filled as -1
| Pixel properties | Quadrant properties | ||||||
|---|---|---|---|---|---|---|---|
| Quadrant | DetID | PixID | Counts | Sigma | Mean | Median | Sigma |
| A | 0 | 29 | 5337 | 11.11 | 1442 | 1348 | 358.9 |
| A | 7 | 110 | 4562 | 8.95 | 1442 | 1348 | 358.9 |
| A | 0 | 30 | 4130 | 7.75 | 1442 | 1348 | 358.9 |
| B | 2 | 9 | 4436 | 11.74 | 1362 | 1297 | 267.3 |
| B | 5 | 128 | 3441 | 8.02 | 1362 | 1297 | 267.3 |
| B | 3 | 17 | 3435 | 8.0 | 1362 | 1297 | 267.3 |
| C | 12 | 241 | 3957 | 6.8 | 1469 | 1368 | 380.5 |
| C | 2 | 191 | 3753 | 6.27 | 1469 | 1368 | 380.5 |
| C | 3 | 126 | 3690 | 6.1 | 1469 | 1368 | 380.5 |
| D | 3 | 14 | 3395 | 6.03 | 1349 | 1229 | 359.2 |
| D | 6 | 231 | 3387 | 6.01 | 1349 | 1229 | 359.2 |
| D | 3 | 31 | 3263 | 5.66 | 1349 | 1229 | 359.2 |
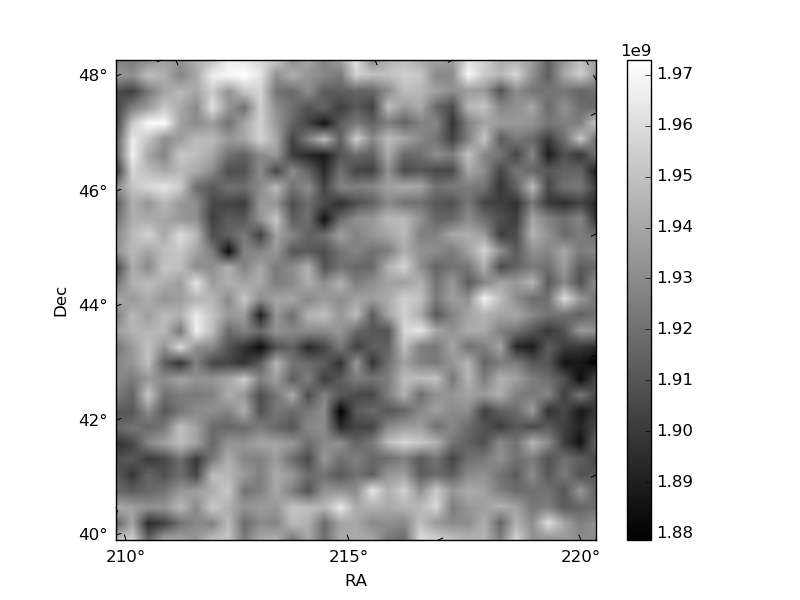
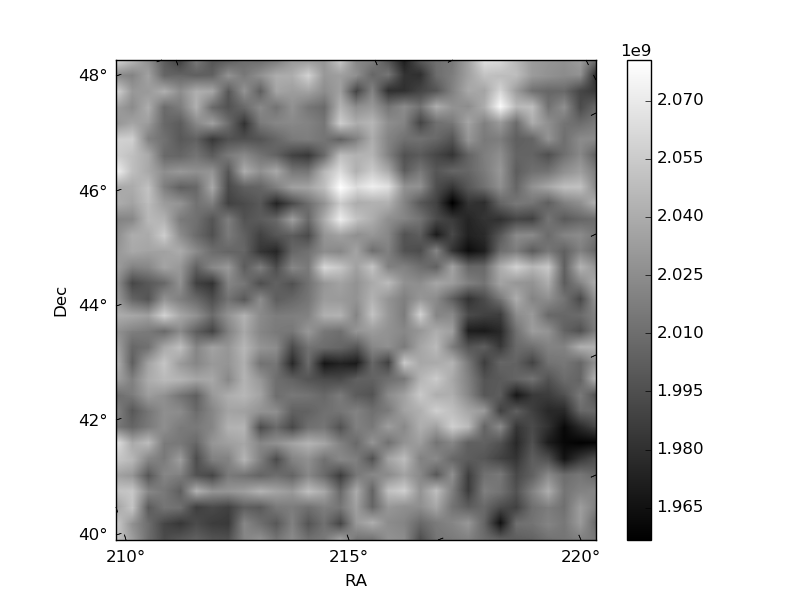
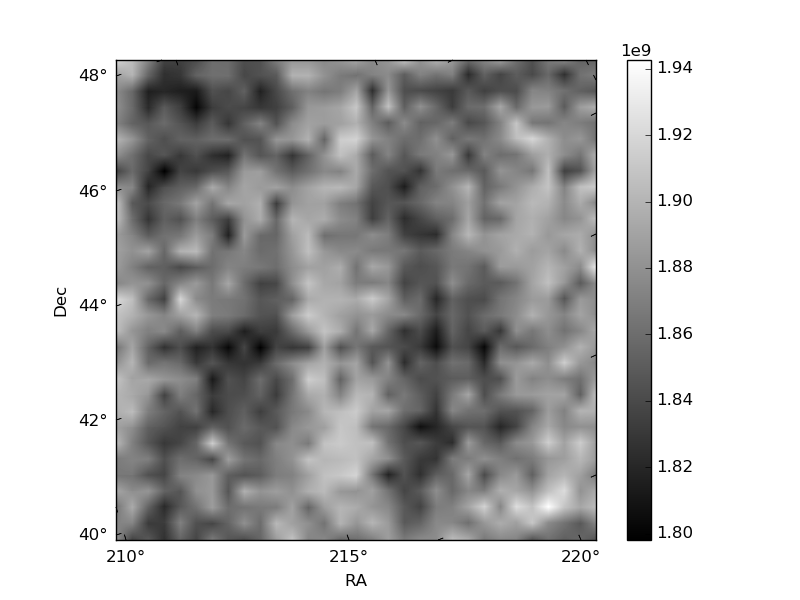
Histogram calculated using DETX and DETY for each event in the final _common_clean file
| Quadrant A | 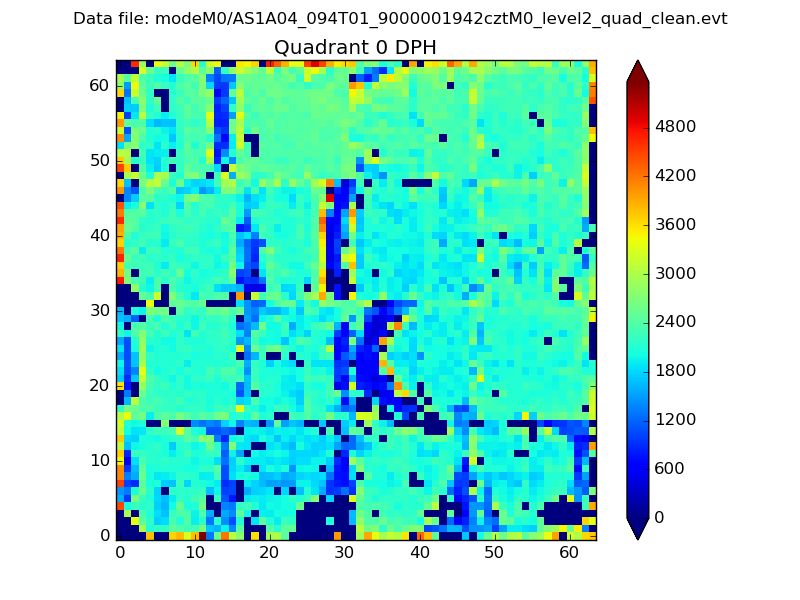 |
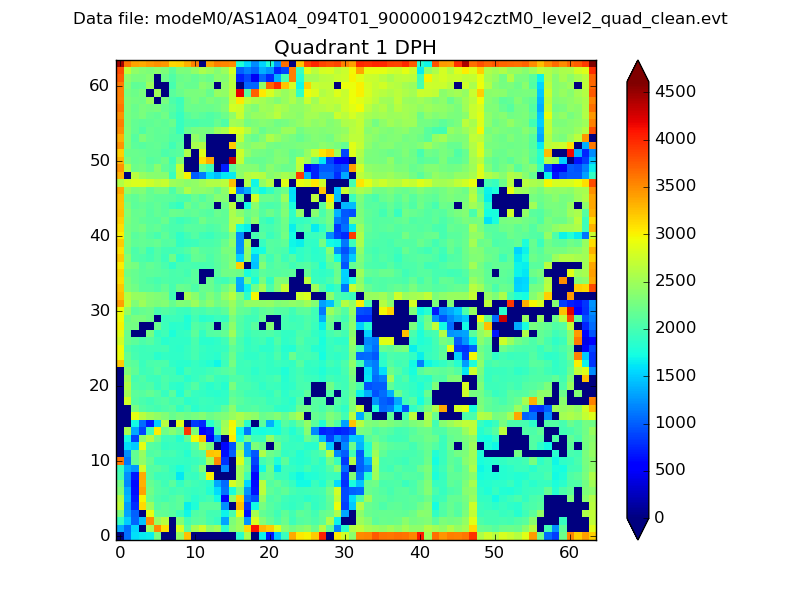 |
Quadrant B |
|---|---|---|---|
| Quadrant D | 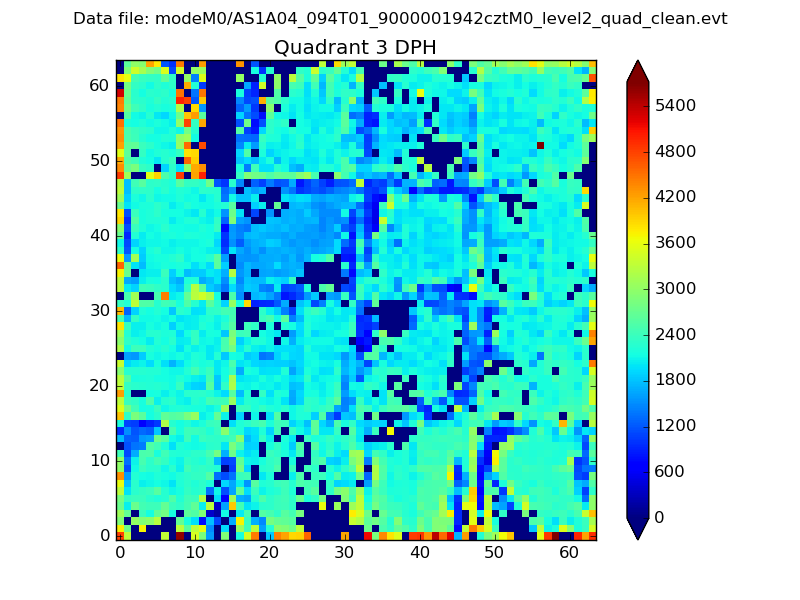 |
 |
Quadrant C |
| Plot type | Count rate plots | Images |
|---|---|---|
| Comparison with Poisson distribution Blue bars denote a histogram of data divided into 1 sec bins. Red curve is a Poisson curve with rate = median count rate of data. |
 |
 |
| Quadrant-wise count rates Data is divided into 100 sec bins |
 |
|
| Module-wise count rates for Quadrant A Data is divided into 100 sec bins |
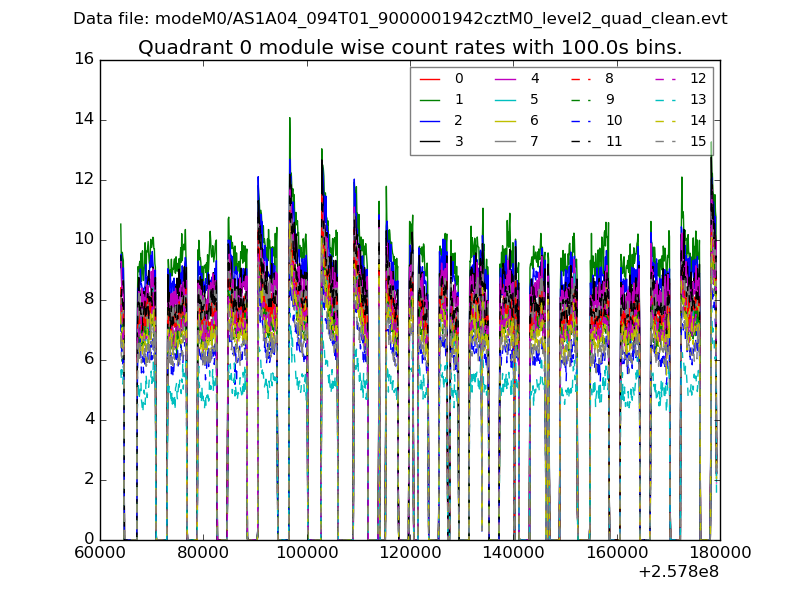 |
 |
| Module-wise count rates for Quadrant B Data is divided into 100 sec bins |
 |
 |
| Module-wise count rates for Quadrant C Data is divided into 100 sec bins |
 |
 |
| Module-wise count rates for Quadrant D Data is divided into 100 sec bins |
 |
 |
| Parameter | Plot |
|---|---|
| CZT HV Monitor |  |
| D_VDD | 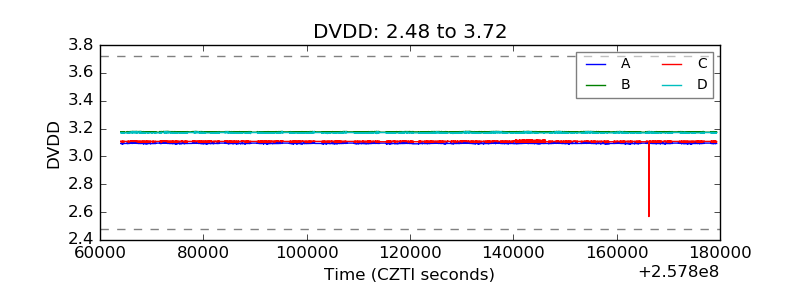 |
| Temperature 1 | 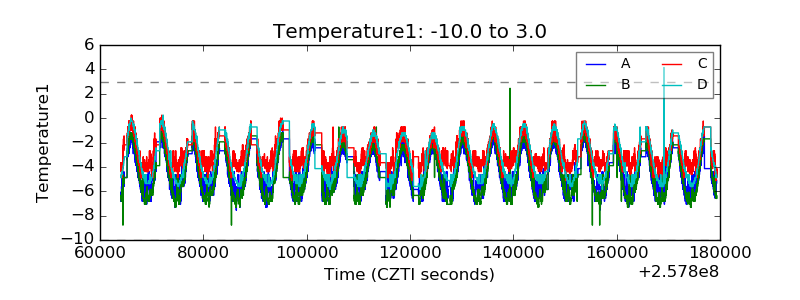 |
| Veto HV Monitor |  |
| Veto LLD |  |
| Alpha Counter |  |
| _CPM_Rate |  |
| CZT Counter | 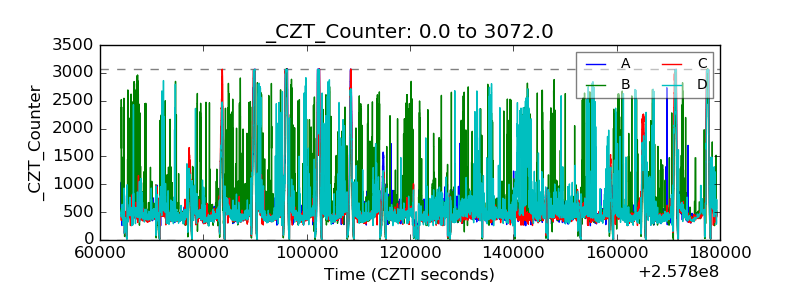 |
| +2.5 Volts monitor |  |
| +5 Volts monitor |  |
| _ROLL_ROT |  |
| _Roll_DEC | 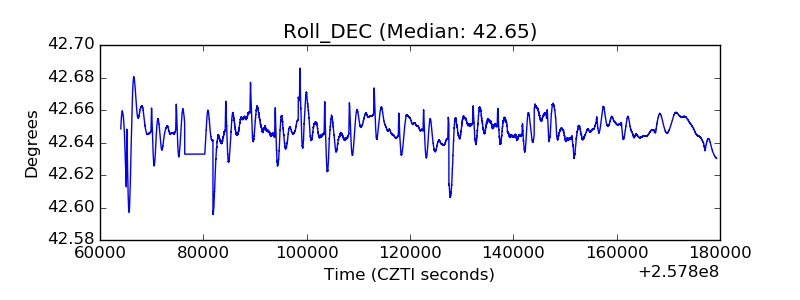 |
| _Roll_RA |  |
| Veto Counter |  |