| Param | Original file | Final file |
|---|---|---|
| Filename | modeM0/AS1A04_094T01_9000001942_13151cztM0_level2.evt | modeM0/AS1A04_094T01_9000001942_13151cztM0_level2_quad_clean.evt |
| Size (bytes) | 984,991,680 | 158,846,400 |
| Size | 939.4 MB | 151.5 MB |
| Events in quadrant A | 6,448,885 | 984,023 |
| Events in quadrant B | 9,559,756 | 961,880 |
| Events in quadrant C | 5,986,545 | 998,580 |
| Events in quadrant D | 6,946,565 | 958,689 |
| Mode SS | |||
|---|---|---|---|
| Quadrant | BADHDUFLAG | Total packets | Discarded packets |
| A | 0 | 268 | 0 |
| B | 0 | 268 | 0 |
| C | 0 | 268 | 0 |
| D | 0 | 268 | 0 |
| Mode M9 | |||
|---|---|---|---|
| Quadrant | BADHDUFLAG | Total packets | Discarded packets |
| A | 0 | 21 | 0 |
| B | 0 | 21 | 0 |
| C | 0 | 21 | 0 |
| D | 0 | 21 | 0 |
| Mode M0 | |||
|---|---|---|---|
| Quadrant | BADHDUFLAG | Total packets | Discarded packets |
| A | 0 | 27729 | 4 |
| B | 0 | 37038 | 3 |
| C | 0 | 26908 | 3 |
| D | 0 | 29359 | 3 |
| Quadrant | Total seconds | Saturated seconds | Saturation percentage |
|---|---|---|---|
| A | 13134 | 184 | 1.400944% |
| B | 13134 | 1550 | 11.801431% |
| C | 13134 | 149 | 1.134460% |
| D | 13134 | 313 | 2.383128% |
Noise dominated data is calculated using 1-second bins in cleaned event files. If a bin has >2000 counts, and if more than 50% of those come from <1% of pixels, then it is considered to be noise-dominated and hence unusable.
| Quadrant | # 1 sec bins | Bins with >0 counts | Bins with >2000 counts | High rate bins dominated by noise | Noise dominated (total time) | Noise dominated (detector-on time) | Marked lightcurve |
|---|---|---|---|---|---|---|---|
| A | 15230 | 13138 | 1 | 1 | 0.01% | 0.01% | 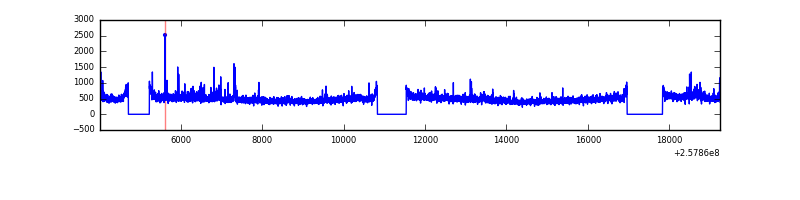 |
| B | 15230 | 13138 | 913 | 913 | 5.99% | 6.95% | 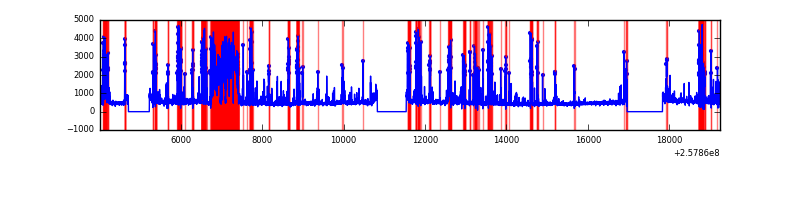 |
| C | 15230 | 13138 | 3 | 3 | 0.02% | 0.02% | 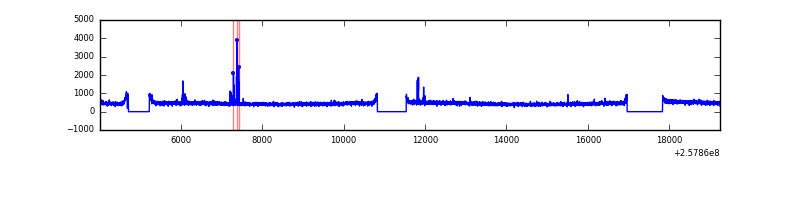 |
| D | 15230 | 13138 | 104 | 104 | 0.68% | 0.79% | 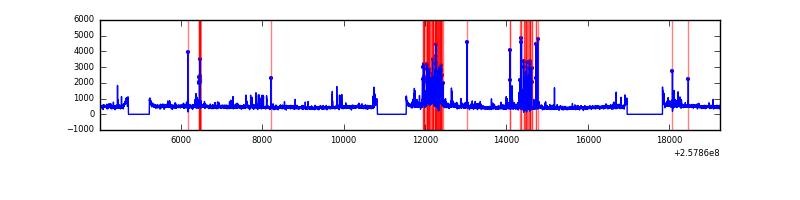 |
Top three noisy pixels from each quadrant. If the there are fewer than three noisy pixels in the level2.evt file, extra rows are filled as -1
| Pixel properties | Quadrant properties | ||||||
|---|---|---|---|---|---|---|---|
| Quadrant | DetID | PixID | Counts | Sigma | Mean | Median | Sigma |
| A | 12 | 189 | 310372 | 977.06 | 1561 | 1526 | 316.1 |
| A | 9 | 143 | 33525 | 101.23 | 1561 | 1526 | 316.1 |
| A | 1 | 162 | 27596 | 82.47 | 1561 | 1526 | 316.1 |
| B | 4 | 239 | 2101841 | 7490.94 | 1473 | 1434 | 280.4 |
| B | 3 | 64 | 1492667 | 5318.37 | 1473 | 1434 | 280.4 |
| B | 3 | 209 | 40509 | 139.36 | 1473 | 1434 | 280.4 |
| C | 14 | 234 | 31092 | 84.03 | 1520 | 1524 | 351.9 |
| C | 0 | 207 | 26665 | 71.44 | 1520 | 1524 | 351.9 |
| C | 13 | 61 | 11269 | 27.69 | 1520 | 1524 | 351.9 |
| D | 1 | 52 | 897594 | 2463.77 | 1507 | 1458 | 363.7 |
| D | 5 | 222 | 141261 | 384.36 | 1507 | 1458 | 363.7 |
| D | 8 | 195 | 90359 | 244.42 | 1507 | 1458 | 363.7 |
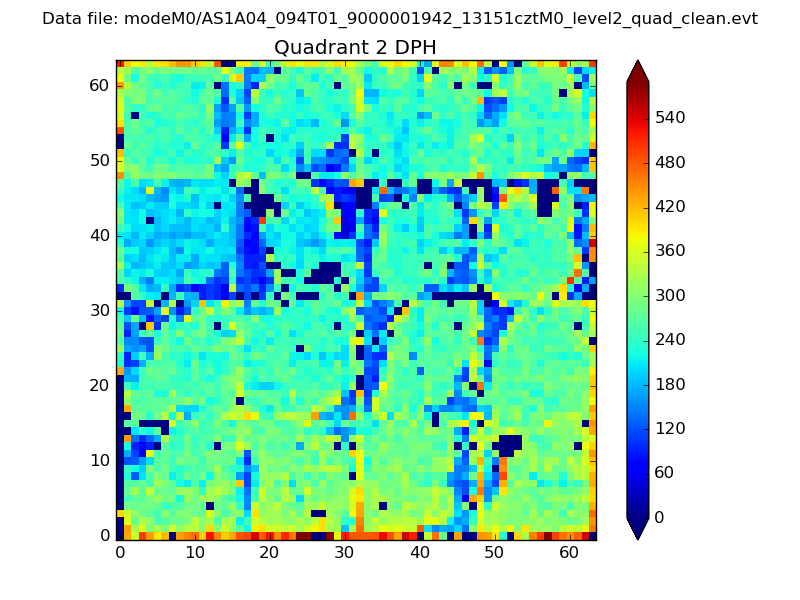
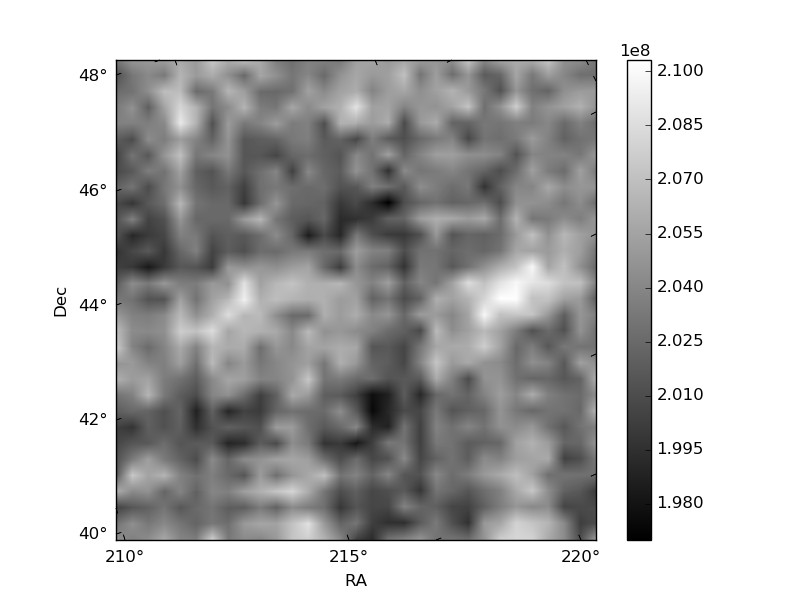
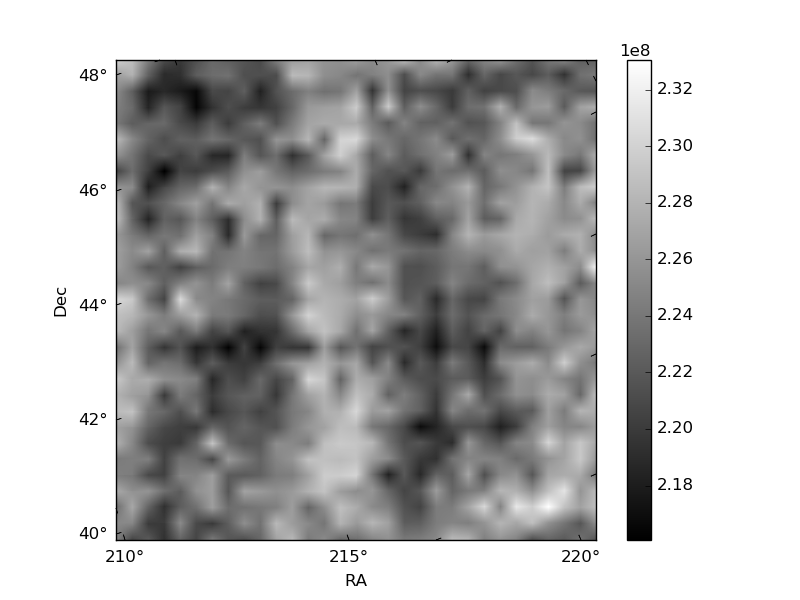
Histogram calculated using DETX and DETY for each event in the final _common_clean file
| Quadrant A | 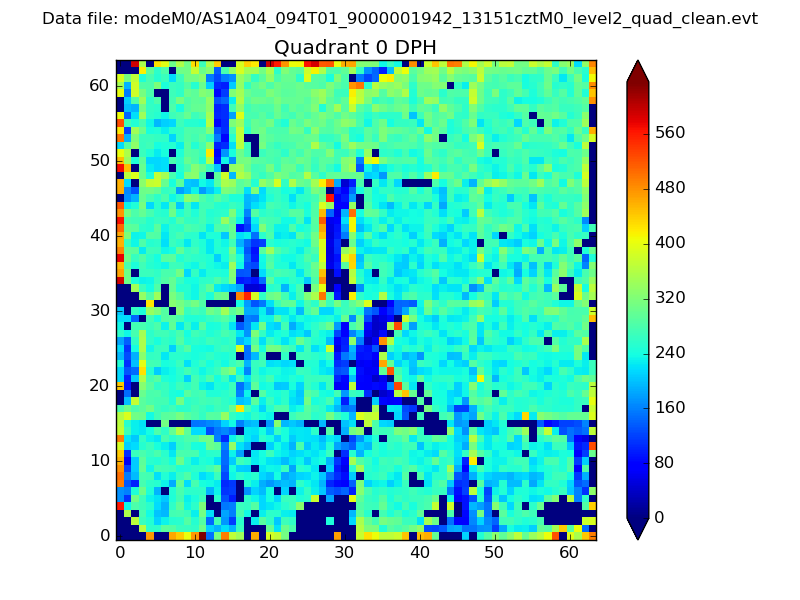 |
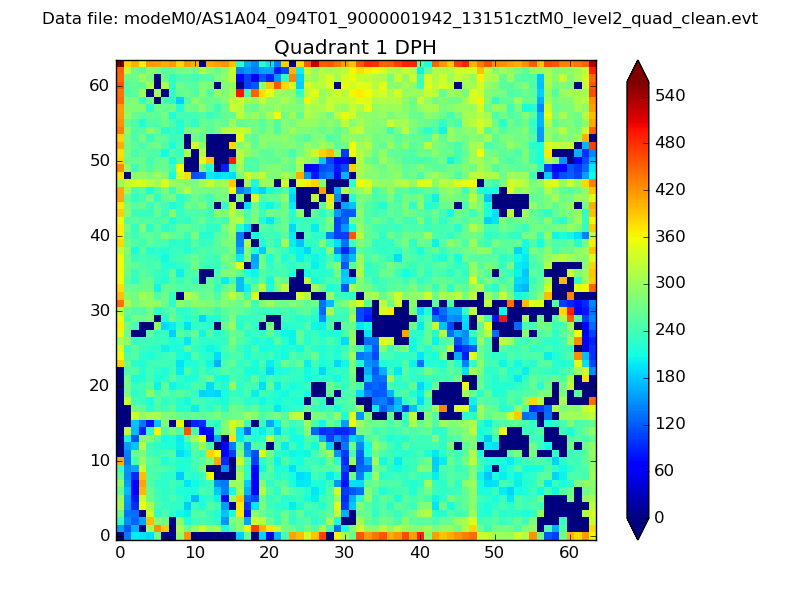 |
Quadrant B |
|---|---|---|---|
| Quadrant D | 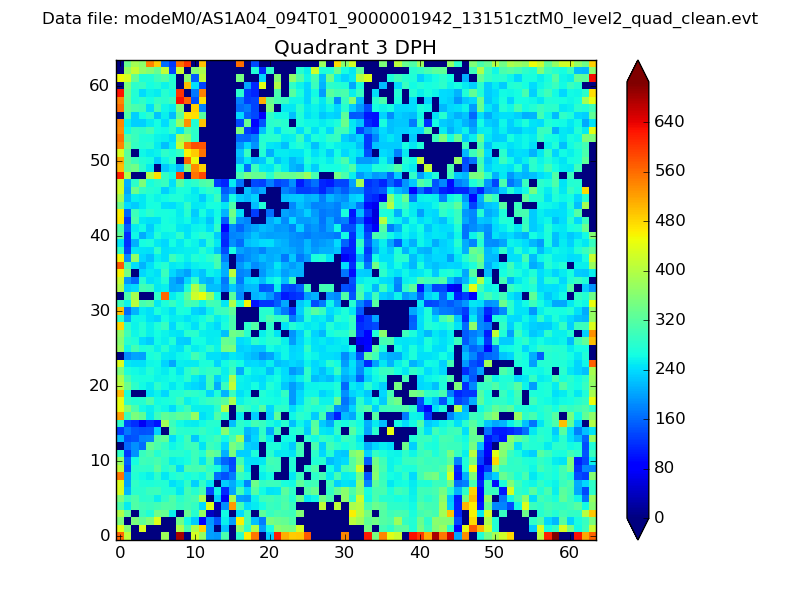 |
 |
Quadrant C |
| Plot type | Count rate plots | Images |
|---|---|---|
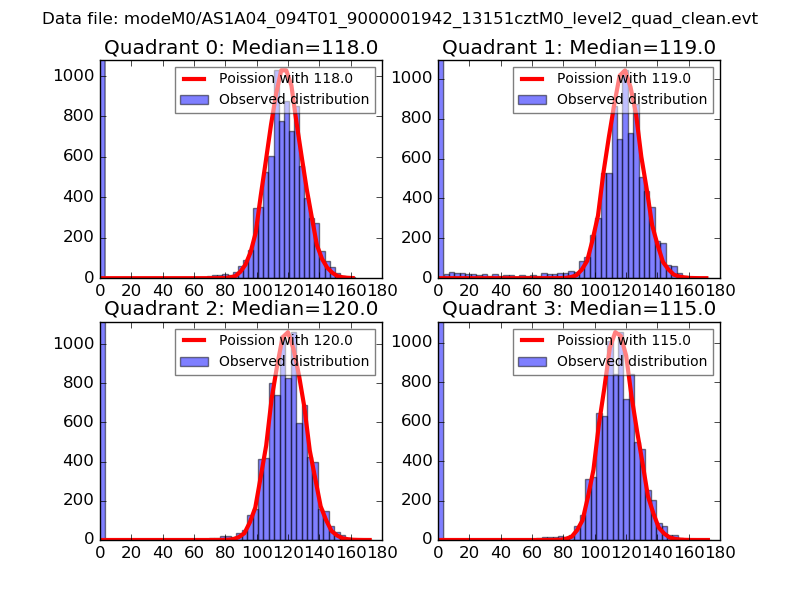
| Comparison with Poisson distribution Blue bars denote a histogram of data divided into 1 sec bins. Red curve is a Poisson curve with rate = median count rate of data. |
 |
 |
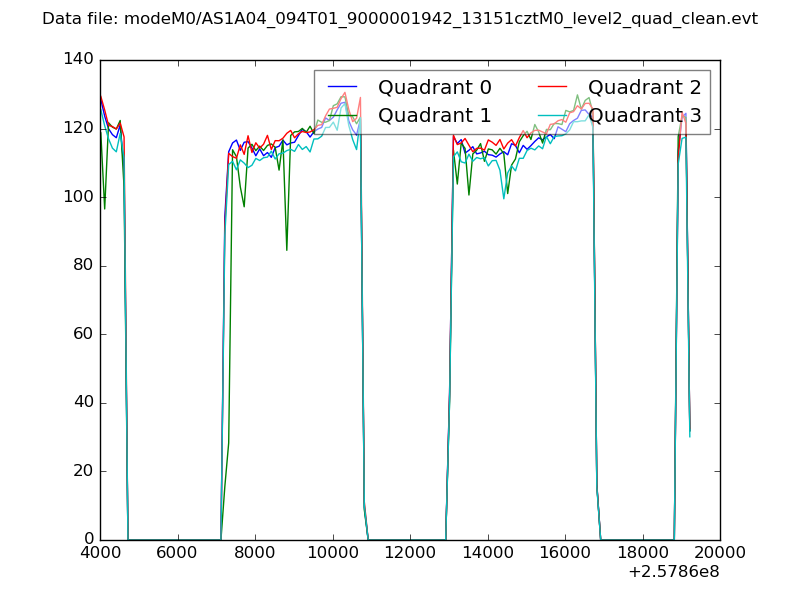
| Quadrant-wise count rates Data is divided into 100 sec bins |
 |
|
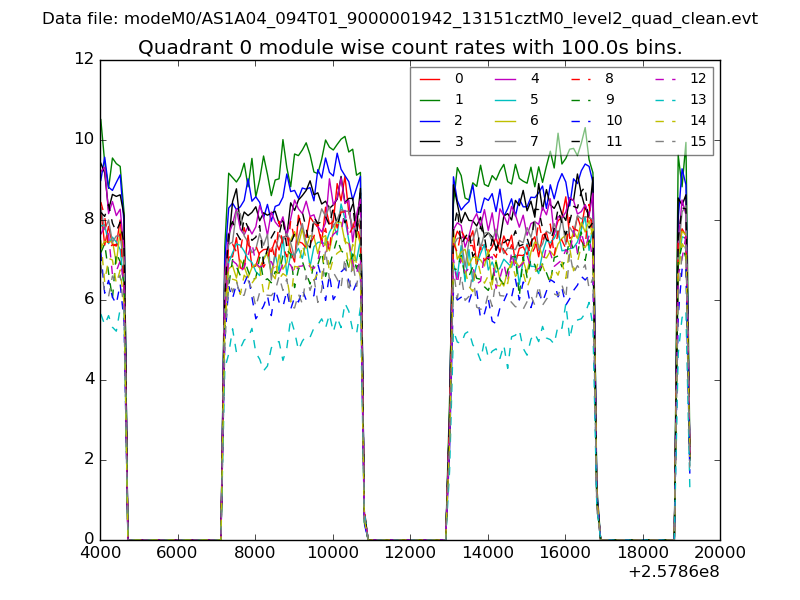
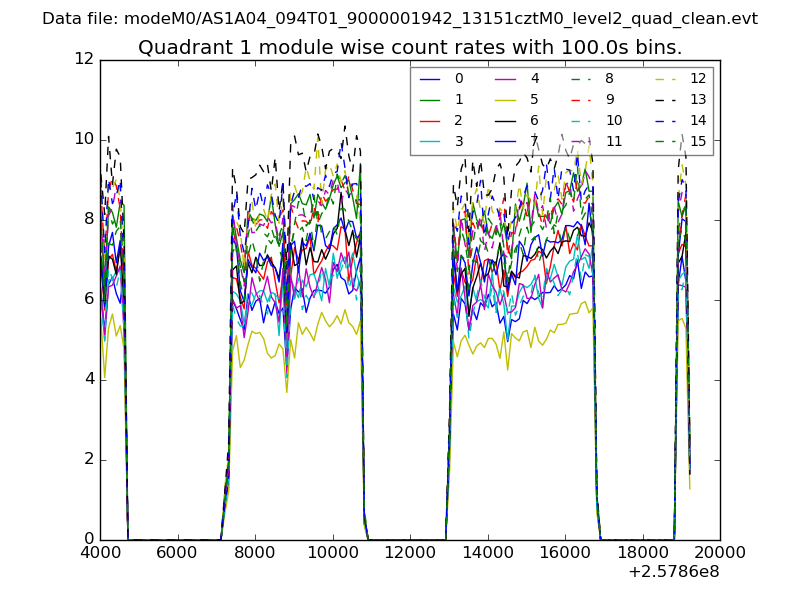
| Module-wise count rates for Quadrant A Data is divided into 100 sec bins |
 |
 |
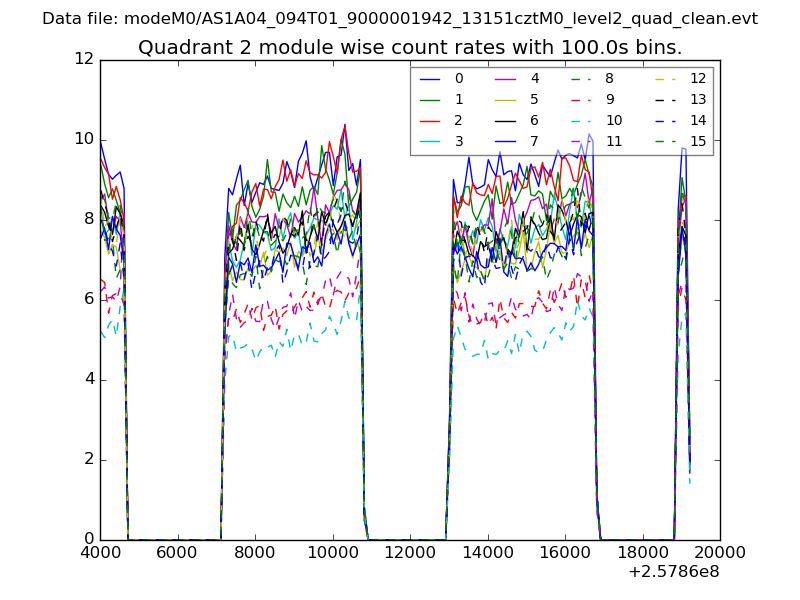
| Module-wise count rates for Quadrant B Data is divided into 100 sec bins |
 |
 |
| Module-wise count rates for Quadrant C Data is divided into 100 sec bins |
 |
 |
| Module-wise count rates for Quadrant D Data is divided into 100 sec bins |
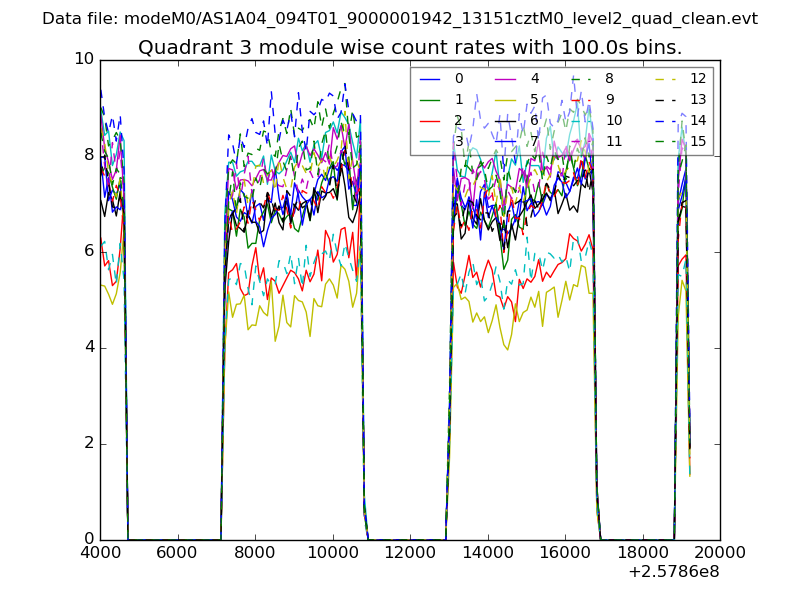 |
 |
| Parameter | Plot |
|---|---|
| CZT HV Monitor | 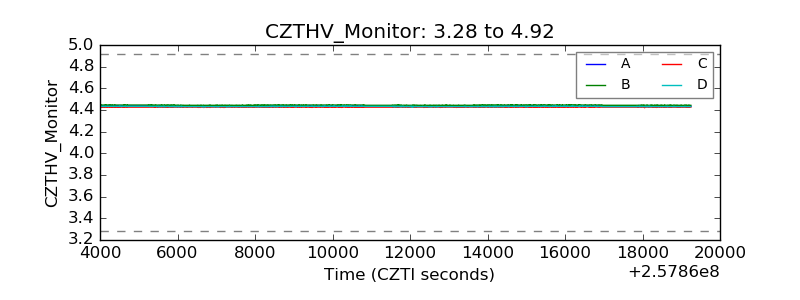 |
| D_VDD | 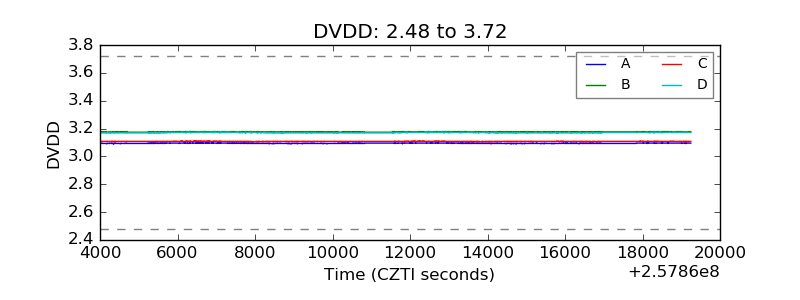 |
| Temperature 1 | 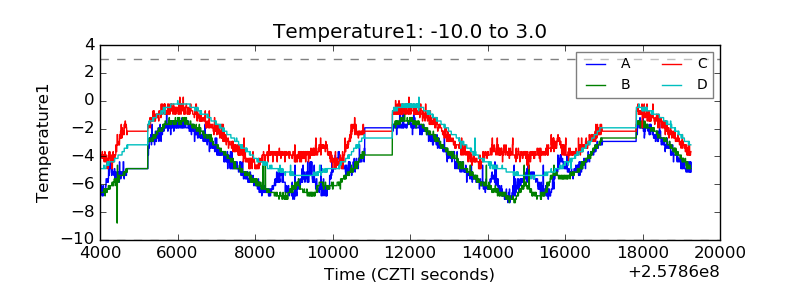 |
| Veto HV Monitor | 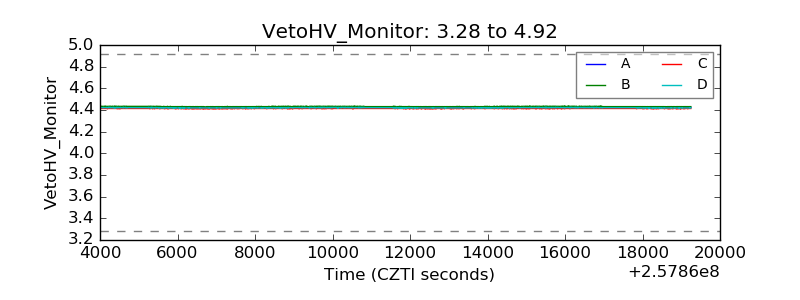 |
| Veto LLD | 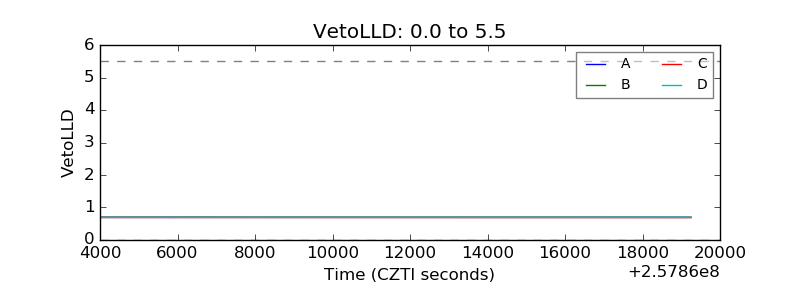 |
| Alpha Counter | 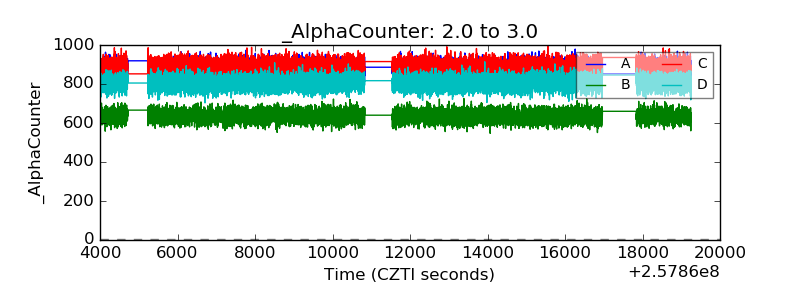 |
| _CPM_Rate | 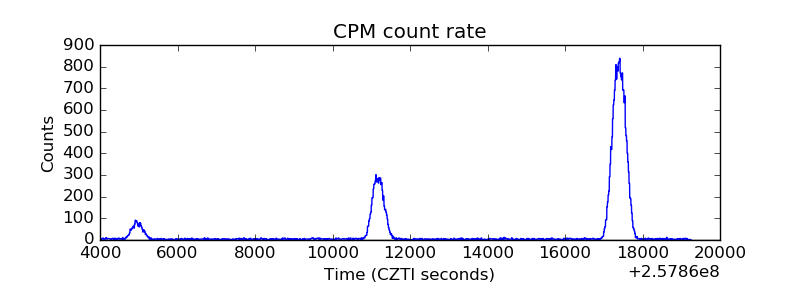 |
| CZT Counter | 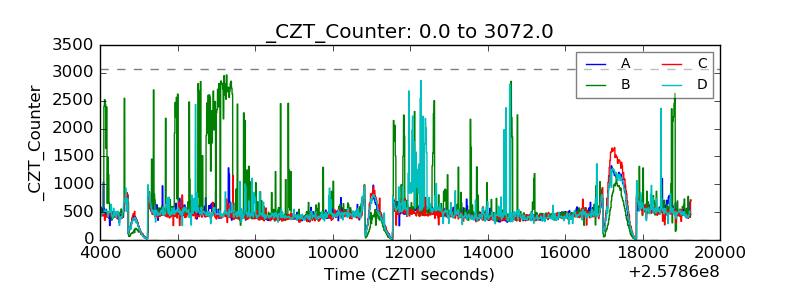 |
| +2.5 Volts monitor |  |
| +5 Volts monitor |  |
| _ROLL_ROT | 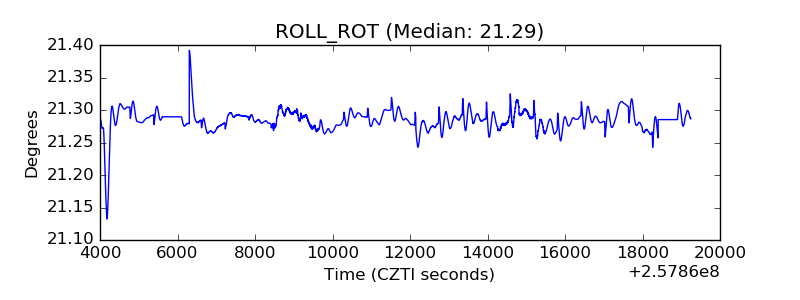 |
| _Roll_DEC | 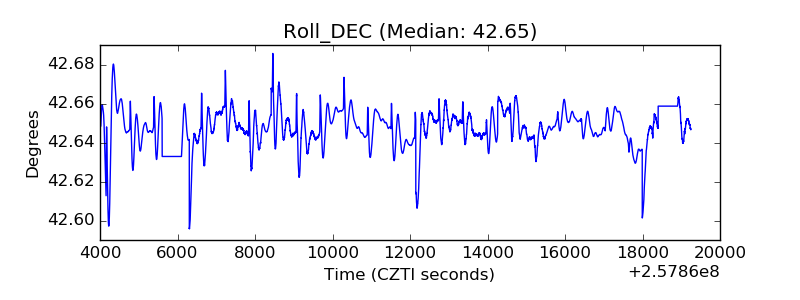 |
| _Roll_RA | 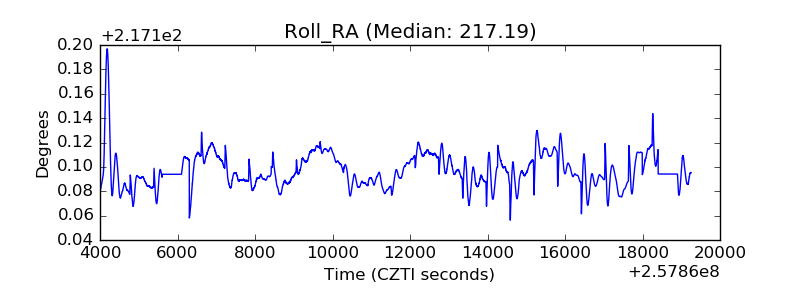 |
| Veto Counter | 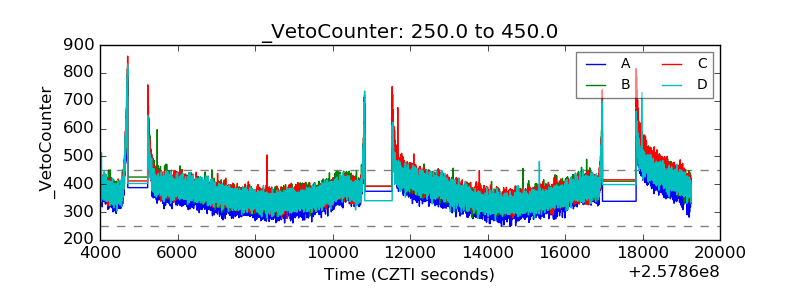 |