| Param | Original file | Final file |
|---|---|---|
| Filename | modeM0/AS1A04_094T01_9000001942_13155cztM0_level2.evt | modeM0/AS1A04_094T01_9000001942_13155cztM0_level2_quad_clean.evt |
| Size (bytes) | 543,804,480 | 102,565,440 |
| Size | 518.6 MB | 97.8 MB |
| Events in quadrant A | 3,606,885 | 673,737 |
| Events in quadrant B | 4,878,645 | 659,413 |
| Events in quadrant C | 3,196,618 | 700,057 |
| Events in quadrant D | 4,342,918 | 616,425 |
| Mode SS | |||
|---|---|---|---|
| Quadrant | BADHDUFLAG | Total packets | Discarded packets |
| A | 0 | 134 | 0 |
| B | 0 | 134 | 0 |
| C | 0 | 134 | 0 |
| D | 0 | 134 | 0 |
| Mode M9 | |||
|---|---|---|---|
| Quadrant | BADHDUFLAG | Total packets | Discarded packets |
| A | 0 | 24 | 0 |
| B | 0 | 24 | 0 |
| C | 0 | 24 | 0 |
| D | 0 | 24 | 0 |
| Mode M0 | |||
|---|---|---|---|
| Quadrant | BADHDUFLAG | Total packets | Discarded packets |
| A | 0 | 15168 | 3 |
| B | 0 | 18907 | 2 |
| C | 0 | 13943 | 2 |
| D | 0 | 17512 | 2 |
| Quadrant | Total seconds | Saturated seconds | Saturation percentage |
|---|---|---|---|
| A | 6546 | 74 | 1.130461% |
| B | 6546 | 709 | 10.831042% |
| C | 6546 | 91 | 1.390162% |
| D | 6546 | 590 | 9.013138% |
Noise dominated data is calculated using 1-second bins in cleaned event files. If a bin has >2000 counts, and if more than 50% of those come from <1% of pixels, then it is considered to be noise-dominated and hence unusable.
| Quadrant | # 1 sec bins | Bins with >0 counts | Bins with >2000 counts | High rate bins dominated by noise | Noise dominated (total time) | Noise dominated (detector-on time) | Marked lightcurve |
|---|---|---|---|---|---|---|---|
| A | 8912 | 6549 | 2 | 2 | 0.02% | 0.03% |  |
| B | 8912 | 6549 | 417 | 417 | 4.68% | 6.37% |  |
| C | 8912 | 6549 | 8 | 8 | 0.09% | 0.12% |  |
| D | 8912 | 6549 | 419 | 419 | 4.70% | 6.40% |  |
Top three noisy pixels from each quadrant. If the there are fewer than three noisy pixels in the level2.evt file, extra rows are filled as -1
| Pixel properties | Quadrant properties | ||||||
|---|---|---|---|---|---|---|---|
| Quadrant | DetID | PixID | Counts | Sigma | Mean | Median | Sigma |
| A | 0 | 23 | 205118 | 1257.25 | 808 | 793 | 162.5 |
| A | 12 | 189 | 175659 | 1075.98 | 808 | 793 | 162.5 |
| A | 15 | 239 | 73445 | 447.04 | 808 | 793 | 162.5 |
| B | 4 | 239 | 1722442 | 11819.03 | 777 | 758 | 145.7 |
| B | 4 | 80 | 34672 | 232.81 | 777 | 758 | 145.7 |
| B | 3 | 64 | 22820 | 151.45 | 777 | 758 | 145.7 |
| C | 15 | 208 | 47720 | 253.39 | 805 | 811 | 185.1 |
| C | 0 | 207 | 12064 | 60.79 | 805 | 811 | 185.1 |
| C | 13 | 61 | 5942 | 27.72 | 805 | 811 | 185.1 |
| D | 1 | 52 | 1380495 | 7738.21 | 743 | 725 | 178.3 |
| D | 14 | 34 | 54514 | 301.67 | 743 | 725 | 178.3 |
| D | 8 | 195 | 47856 | 264.33 | 743 | 725 | 178.3 |
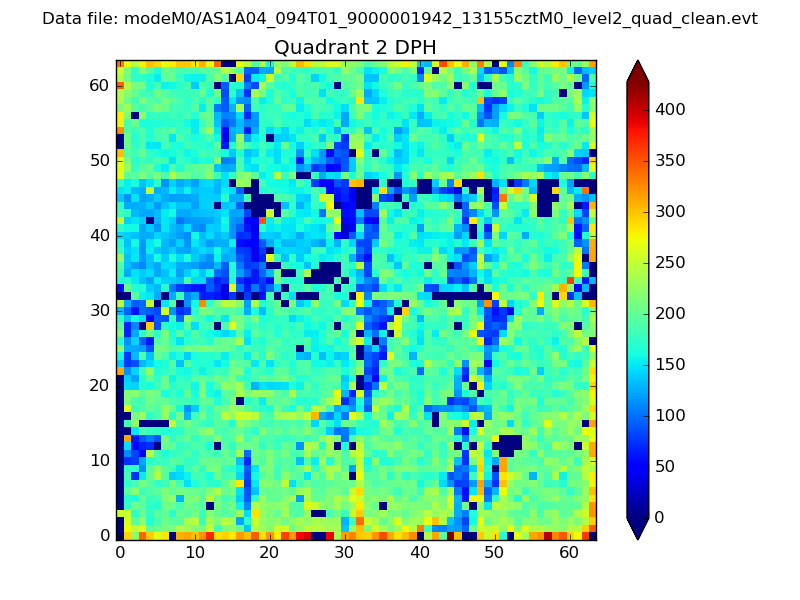
Histogram calculated using DETX and DETY for each event in the final _common_clean file
| Quadrant A | 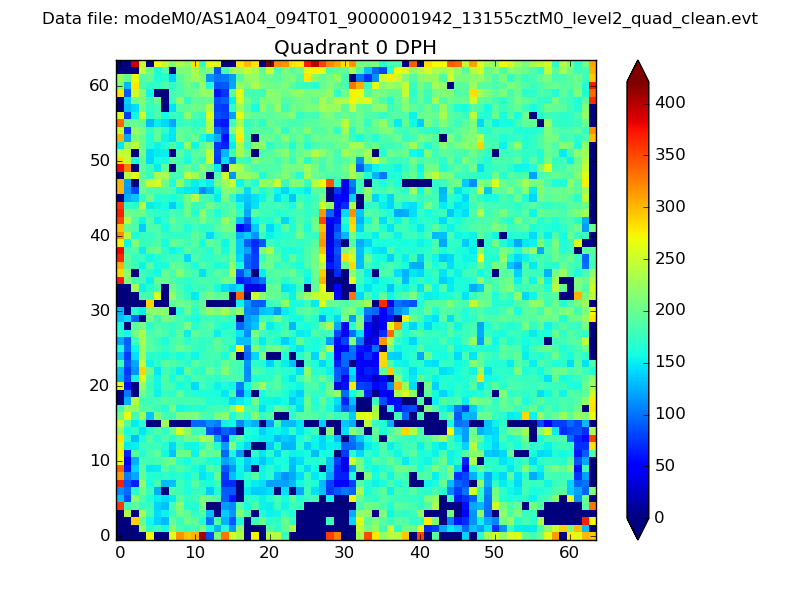 |
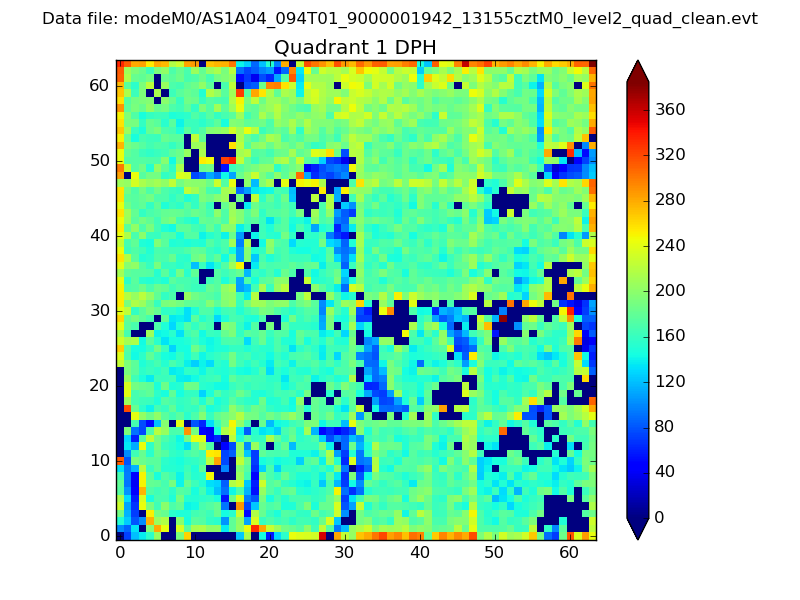 |
Quadrant B |
|---|---|---|---|
| Quadrant D | 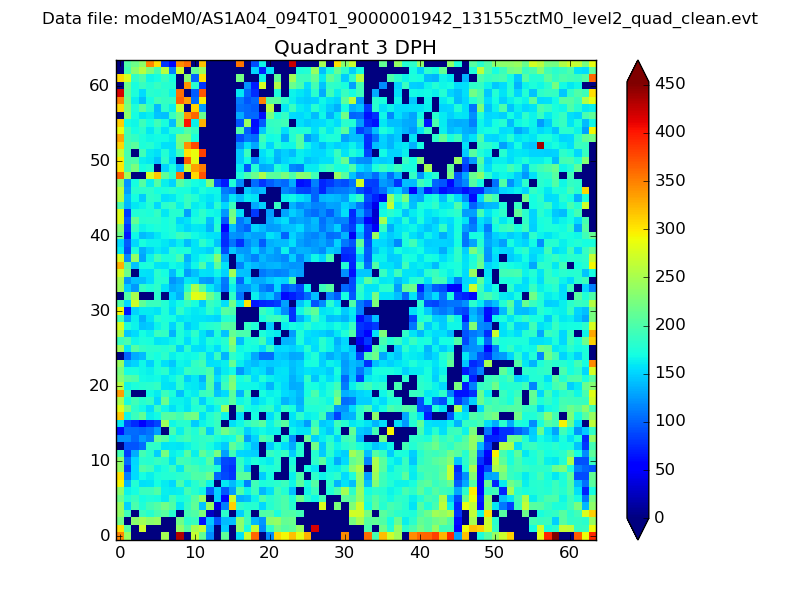 |
 |
Quadrant C |
| Plot type | Count rate plots | Images |
|---|---|---|
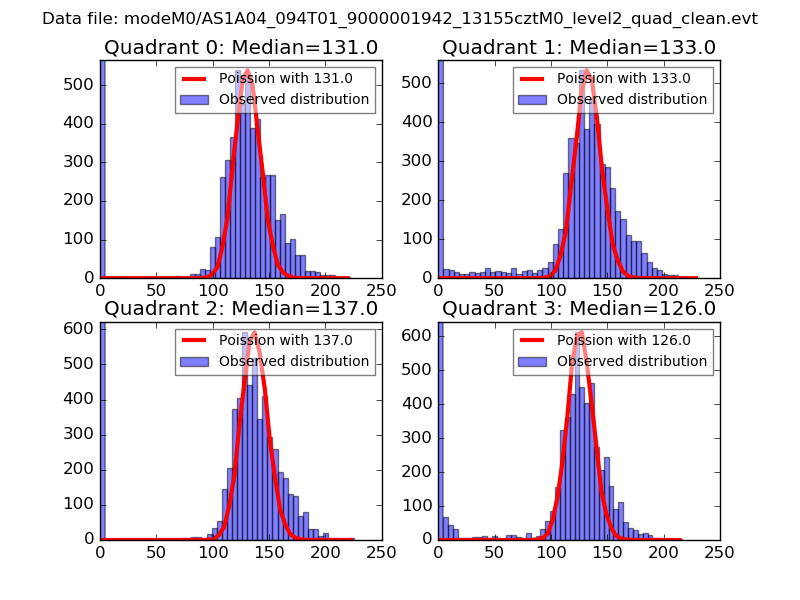
| Comparison with Poisson distribution Blue bars denote a histogram of data divided into 1 sec bins. Red curve is a Poisson curve with rate = median count rate of data. |
 |
 |
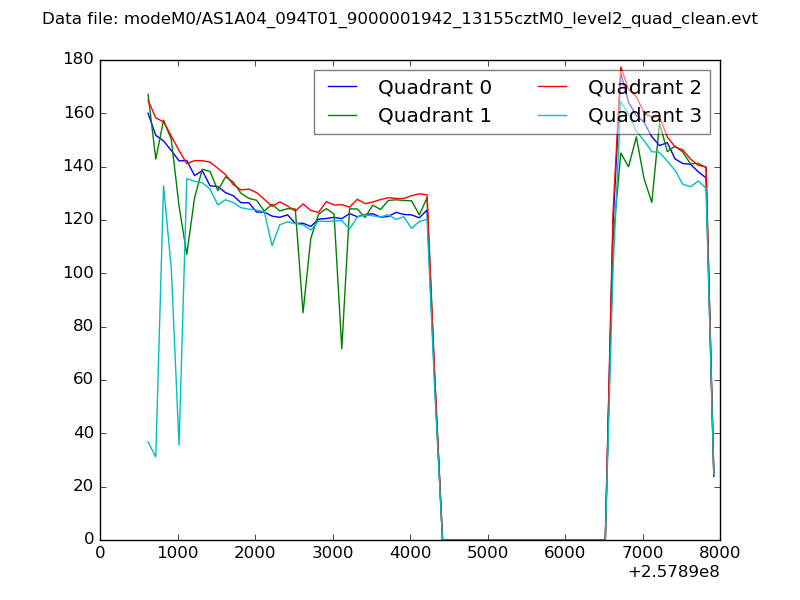
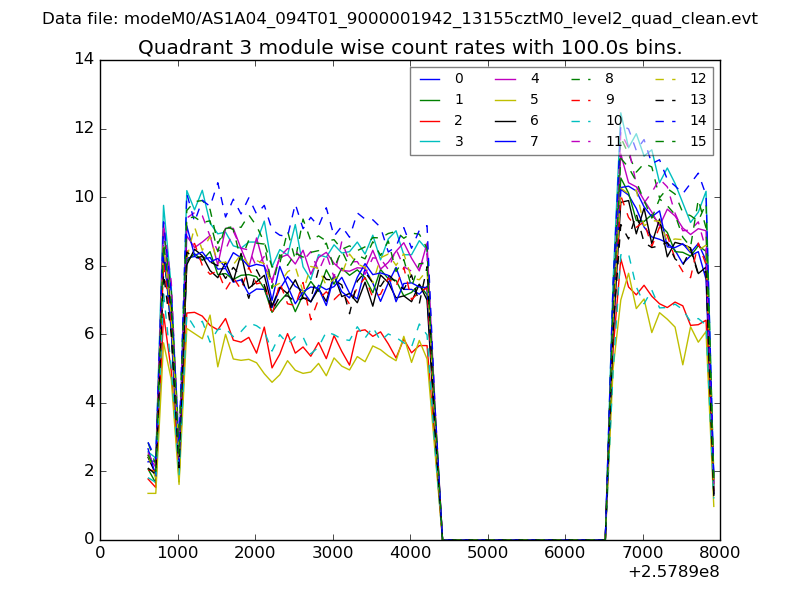
| Quadrant-wise count rates Data is divided into 100 sec bins |
 |
|
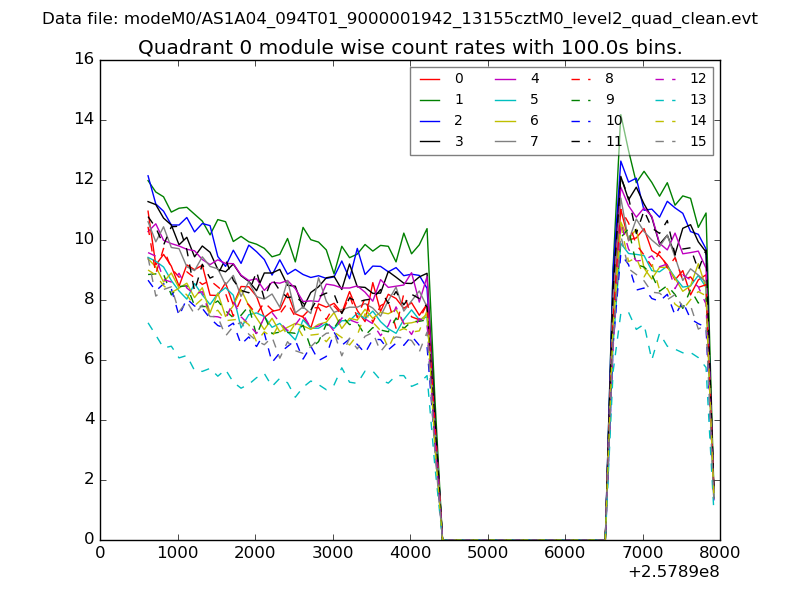
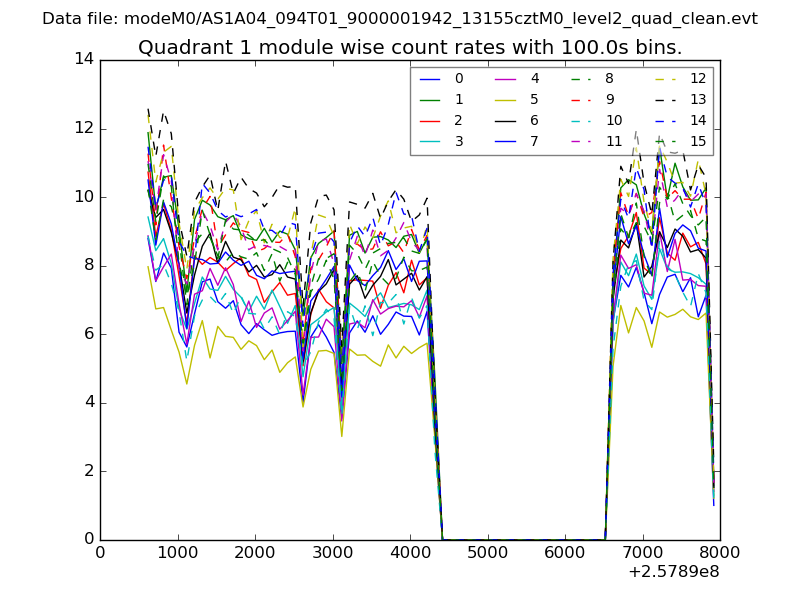
| Module-wise count rates for Quadrant A Data is divided into 100 sec bins |
 |
 |
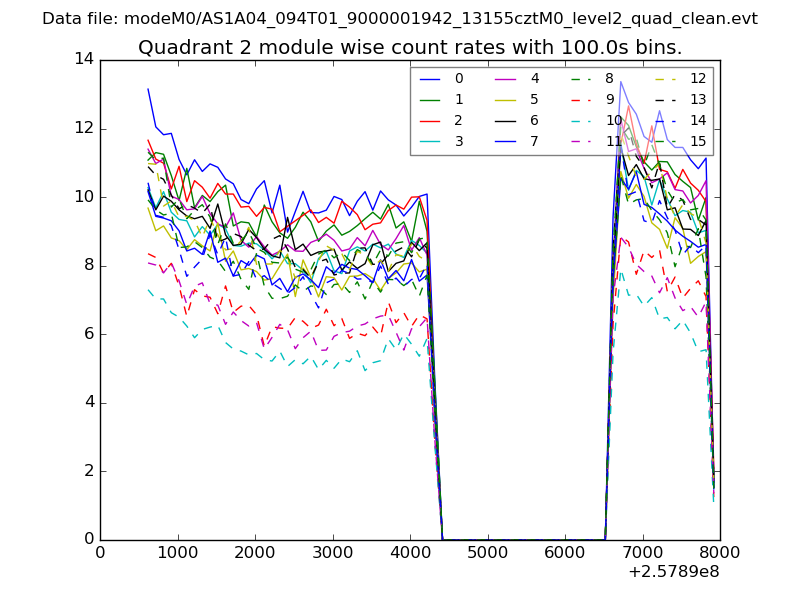
| Module-wise count rates for Quadrant B Data is divided into 100 sec bins |
 |
 |
| Module-wise count rates for Quadrant C Data is divided into 100 sec bins |
 |
 |
| Module-wise count rates for Quadrant D Data is divided into 100 sec bins |
 |
 |
| Parameter | Plot |
|---|---|
| CZT HV Monitor | 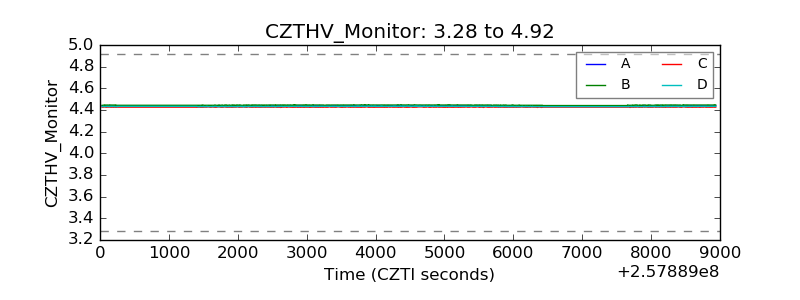 |
| D_VDD | 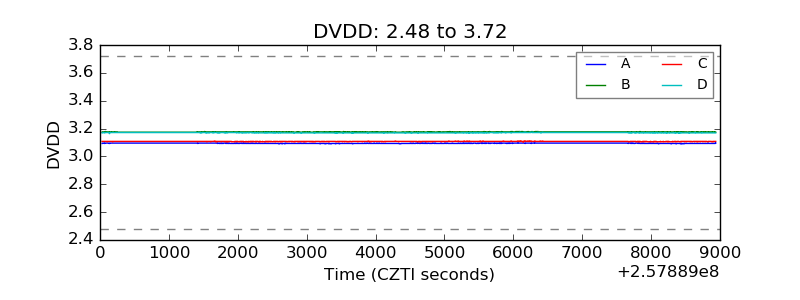 |
| Temperature 1 | 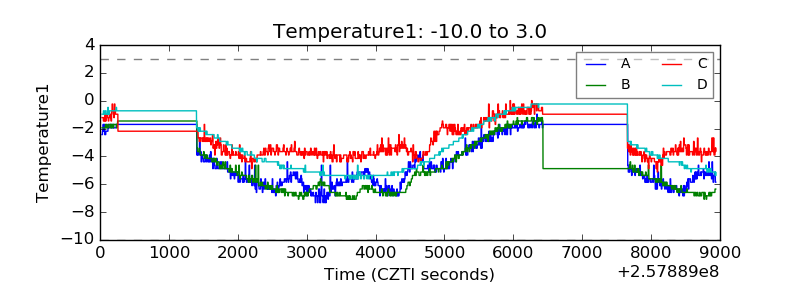 |
| Veto HV Monitor | 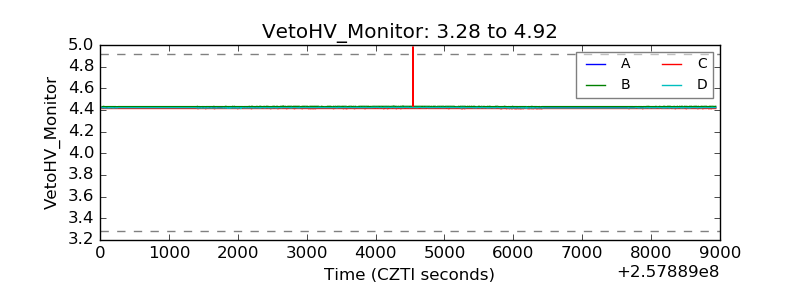 |
| Veto LLD | 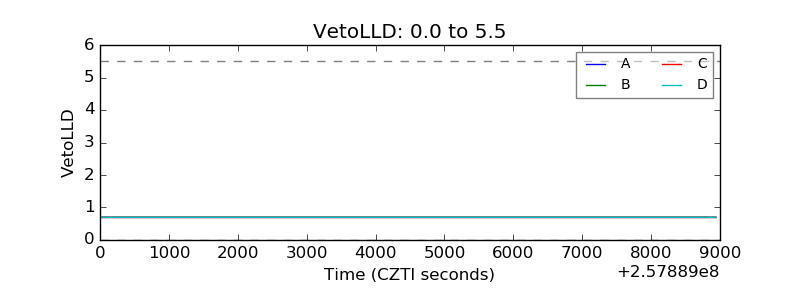 |
| Alpha Counter | 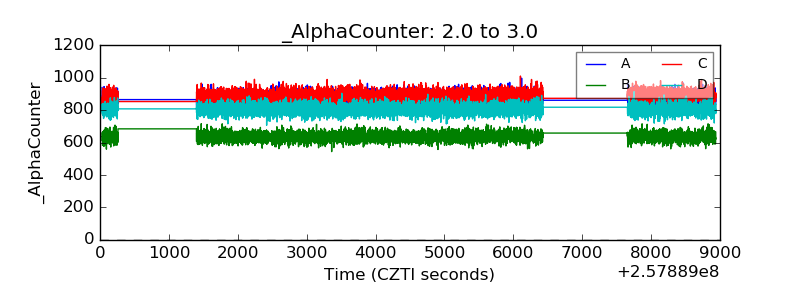 |
| _CPM_Rate | 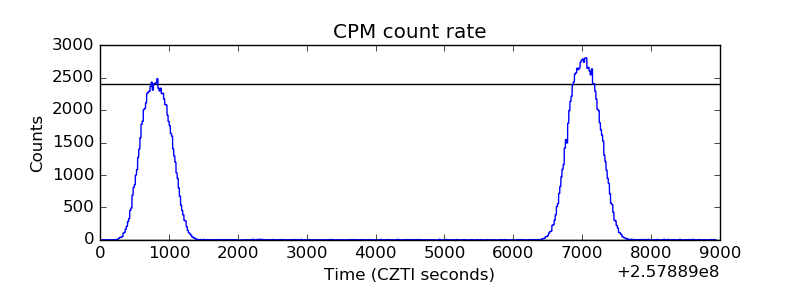 |
| CZT Counter | 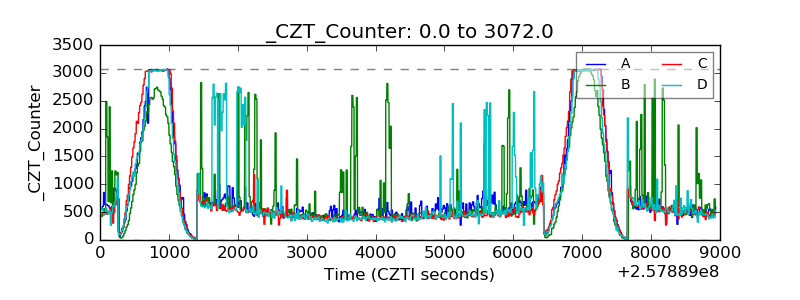 |
| +2.5 Volts monitor |  |
| +5 Volts monitor |  |
| _ROLL_ROT | 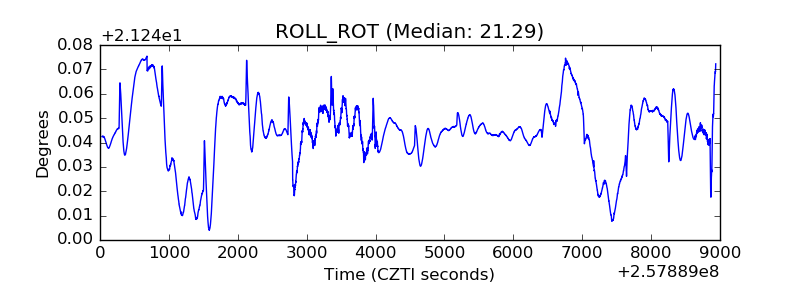 |
| _Roll_DEC | 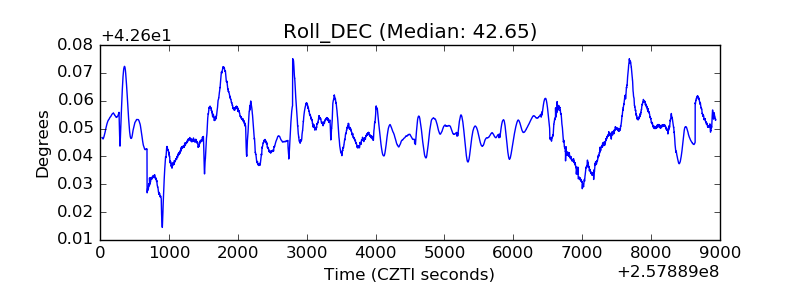 |
| _Roll_RA | 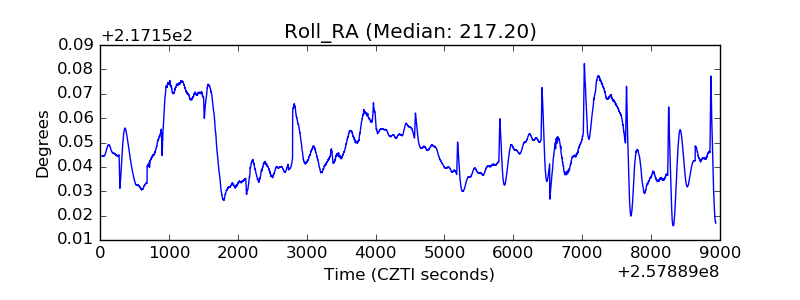 |
| Veto Counter | 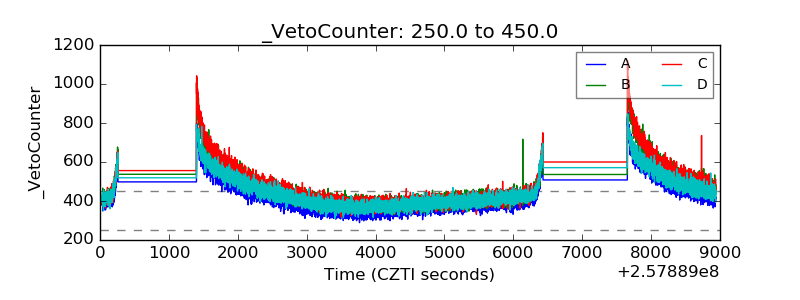 |