| Param | Original file | Final file |
|---|---|---|
| Filename | modeM0/AS1A04_094T01_9000001942_13160cztM0_level2.evt | modeM0/AS1A04_094T01_9000001942_13160cztM0_level2_quad_clean.evt |
| Size (bytes) | 501,333,120 | 96,528,960 |
| Size | 478.1 MB | 92.1 MB |
| Events in quadrant A | 3,725,968 | 602,730 |
| Events in quadrant B | 4,232,926 | 605,938 |
| Events in quadrant C | 3,151,097 | 622,254 |
| Events in quadrant D | 3,583,520 | 590,872 |
| Mode SS | |||
|---|---|---|---|
| Quadrant | BADHDUFLAG | Total packets | Discarded packets |
| A | 0 | 148 | 0 |
| B | 0 | 148 | 0 |
| C | 0 | 148 | 0 |
| D | 0 | 148 | 0 |
| Mode M9 | |||
|---|---|---|---|
| Quadrant | BADHDUFLAG | Total packets | Discarded packets |
| A | 0 | 5 | 0 |
| B | 0 | 5 | 0 |
| C | 0 | 5 | 0 |
| D | 0 | 5 | 0 |
| Mode M0 | |||
|---|---|---|---|
| Quadrant | BADHDUFLAG | Total packets | Discarded packets |
| A | 0 | 15841 | 3 |
| B | 0 | 17407 | 2 |
| C | 0 | 14593 | 2 |
| D | 0 | 15995 | 2 |
| Quadrant | Total seconds | Saturated seconds | Saturation percentage |
|---|---|---|---|
| A | 7194 | 114 | 1.584654% |
| B | 7194 | 368 | 5.115374% |
| C | 7194 | 47 | 0.653322% |
| D | 7194 | 107 | 1.487351% |
Noise dominated data is calculated using 1-second bins in cleaned event files. If a bin has >2000 counts, and if more than 50% of those come from <1% of pixels, then it is considered to be noise-dominated and hence unusable.
| Quadrant | # 1 sec bins | Bins with >0 counts | Bins with >2000 counts | High rate bins dominated by noise | Noise dominated (total time) | Noise dominated (detector-on time) | Marked lightcurve |
|---|---|---|---|---|---|---|---|
| A | 7740 | 7198 | 11 | 11 | 0.14% | 0.15% | 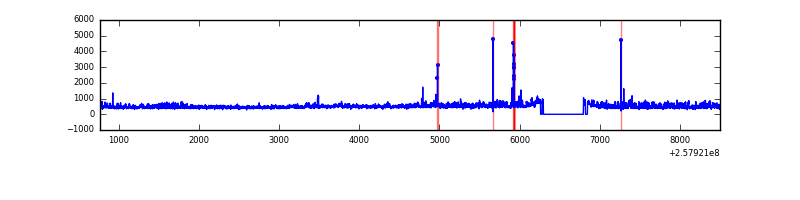 |
| B | 7740 | 7198 | 188 | 188 | 2.43% | 2.61% | 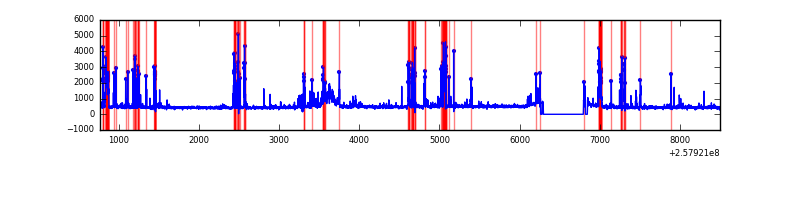 |
| C | 7740 | 7198 | 0 | 0 | 0.00% | 0.00% | 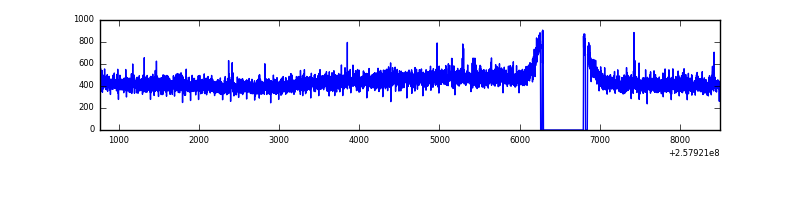 |
| D | 7740 | 7198 | 44 | 44 | 0.57% | 0.61% | 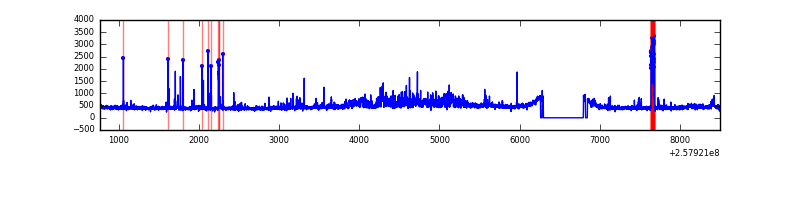 |
Top three noisy pixels from each quadrant. If the there are fewer than three noisy pixels in the level2.evt file, extra rows are filled as -1
| Pixel properties | Quadrant properties | ||||||
|---|---|---|---|---|---|---|---|
| Quadrant | DetID | PixID | Counts | Sigma | Mean | Median | Sigma |
| A | 0 | 23 | 253970 | 1508.02 | 828 | 810 | 167.9 |
| A | 12 | 189 | 126252 | 747.23 | 828 | 810 | 167.9 |
| A | 4 | 2 | 77631 | 457.61 | 828 | 810 | 167.9 |
| B | 4 | 239 | 720904 | 4558.7 | 817 | 797 | 158.0 |
| B | 0 | 230 | 158151 | 996.14 | 817 | 797 | 158.0 |
| B | 4 | 80 | 98675 | 619.63 | 817 | 797 | 158.0 |
| C | 15 | 208 | 6275 | 29.34 | 806 | 808 | 186.4 |
| C | 13 | 61 | 5873 | 27.18 | 806 | 808 | 186.4 |
| C | 14 | 234 | 2129 | 7.09 | 806 | 808 | 186.4 |
| D | 1 | 52 | 492327 | 2569.3 | 800 | 778 | 191.3 |
| D | 8 | 195 | 31179 | 158.9 | 800 | 778 | 191.3 |
| D | 2 | 234 | 27838 | 141.44 | 800 | 778 | 191.3 |
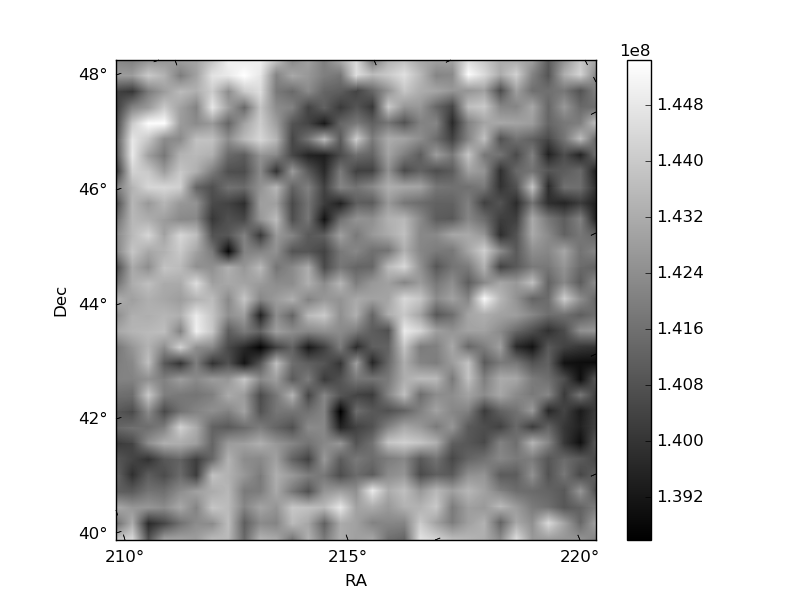
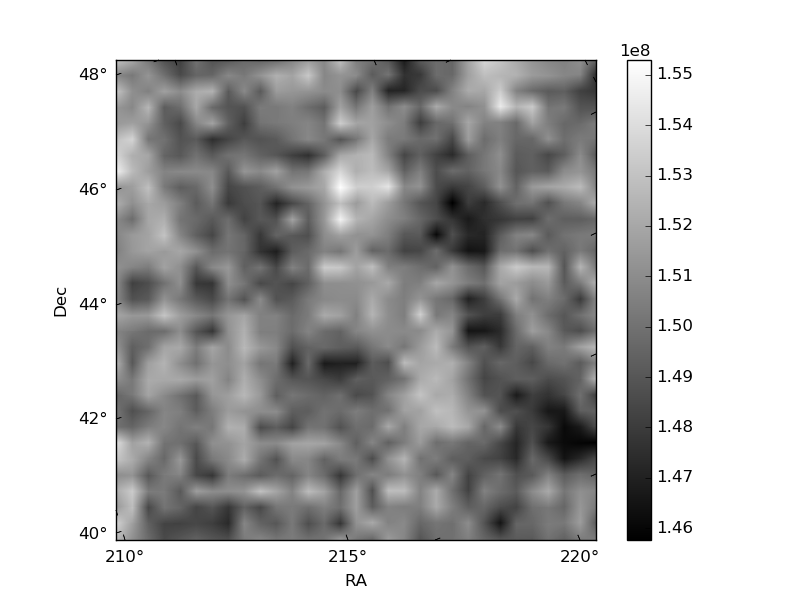
Histogram calculated using DETX and DETY for each event in the final _common_clean file
| Quadrant A |  |
 |
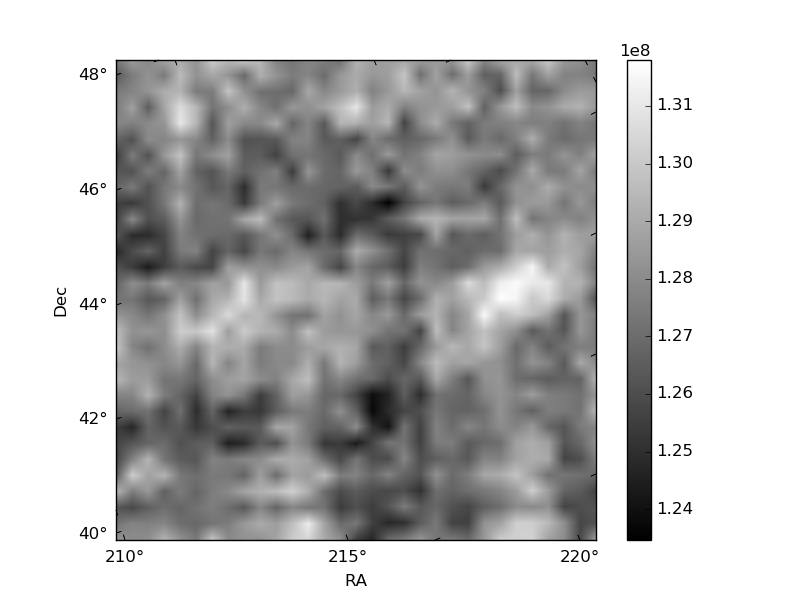
Quadrant B |
|---|---|---|---|
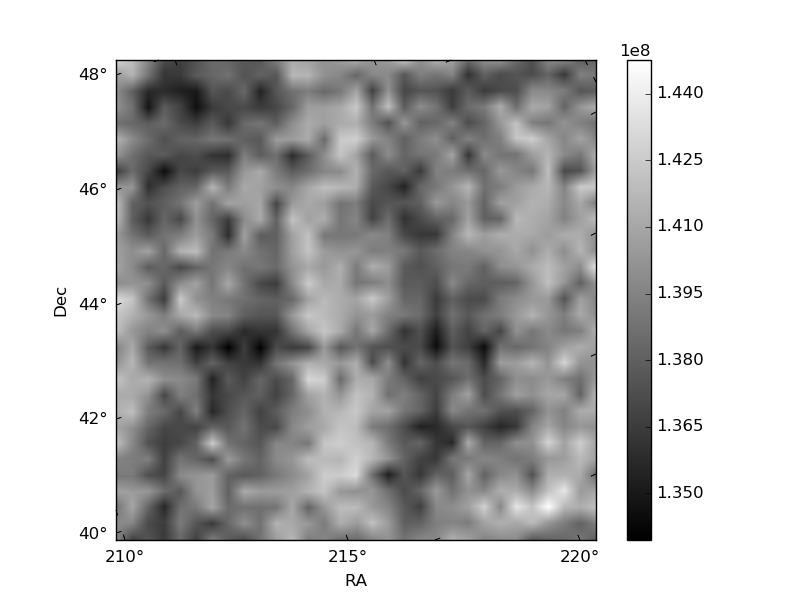
| Quadrant D | 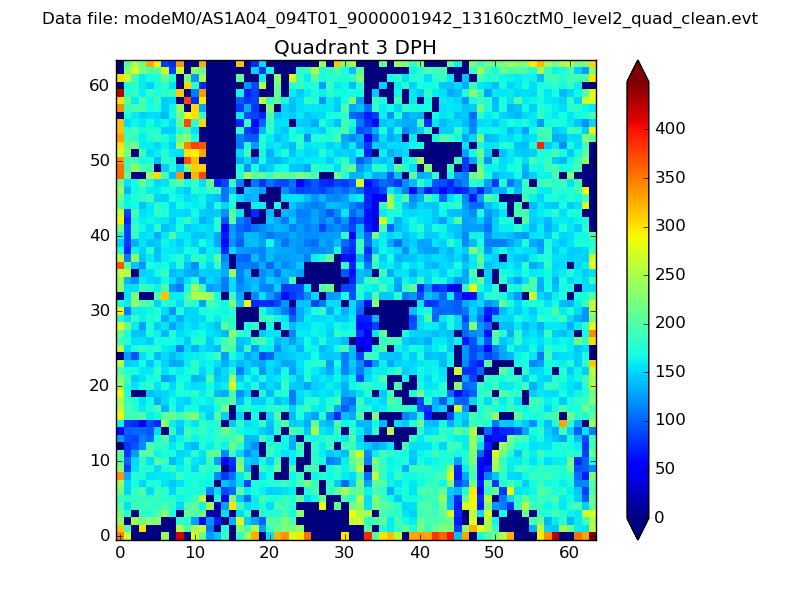 |
 |
Quadrant C |
| Plot type | Count rate plots | Images |
|---|---|---|
| Comparison with Poisson distribution Blue bars denote a histogram of data divided into 1 sec bins. Red curve is a Poisson curve with rate = median count rate of data. |
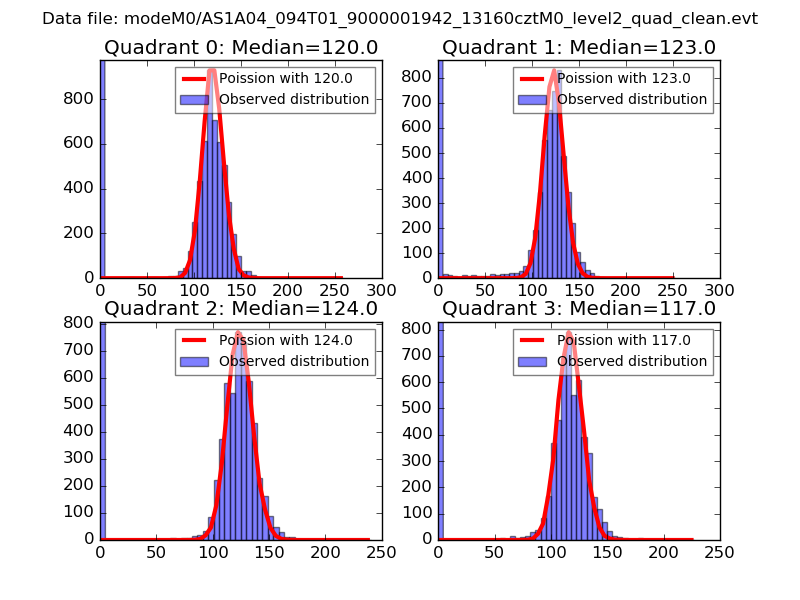 |
 |
| Quadrant-wise count rates Data is divided into 100 sec bins |
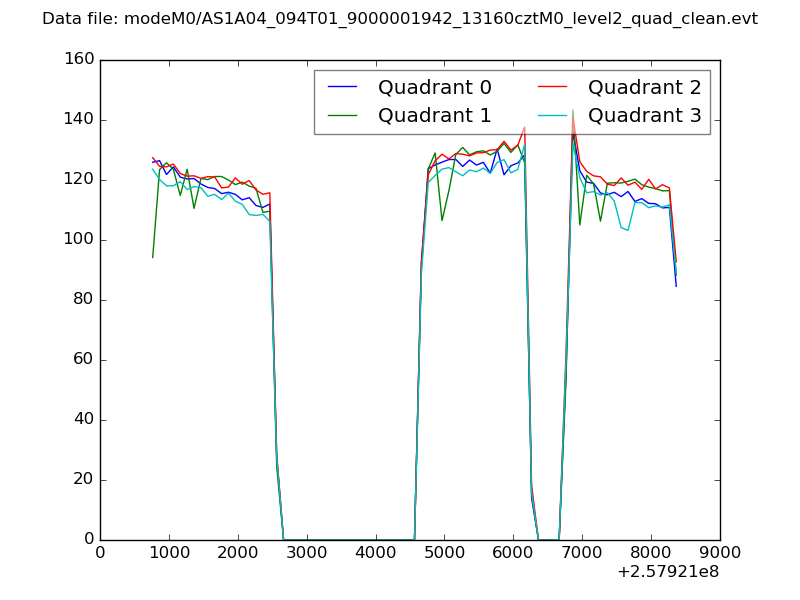 |
|
| Module-wise count rates for Quadrant A Data is divided into 100 sec bins |
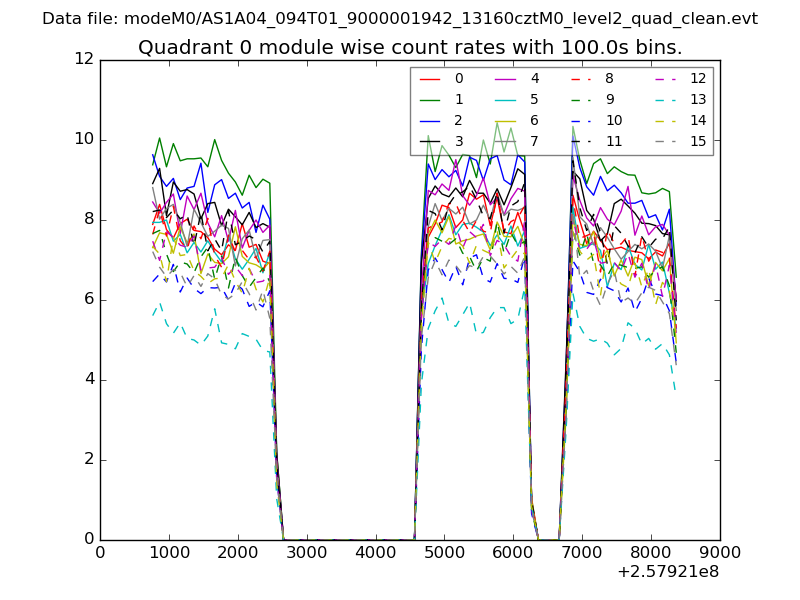 |
 |
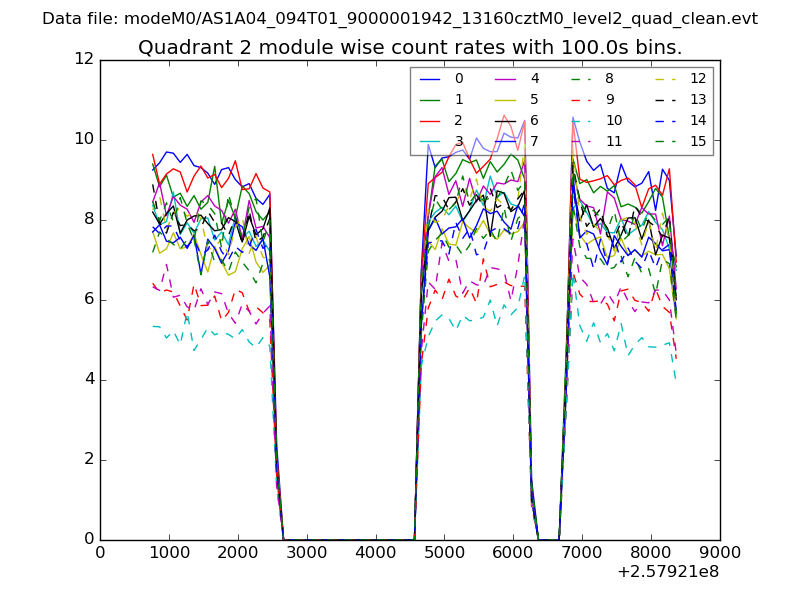
| Module-wise count rates for Quadrant B Data is divided into 100 sec bins |
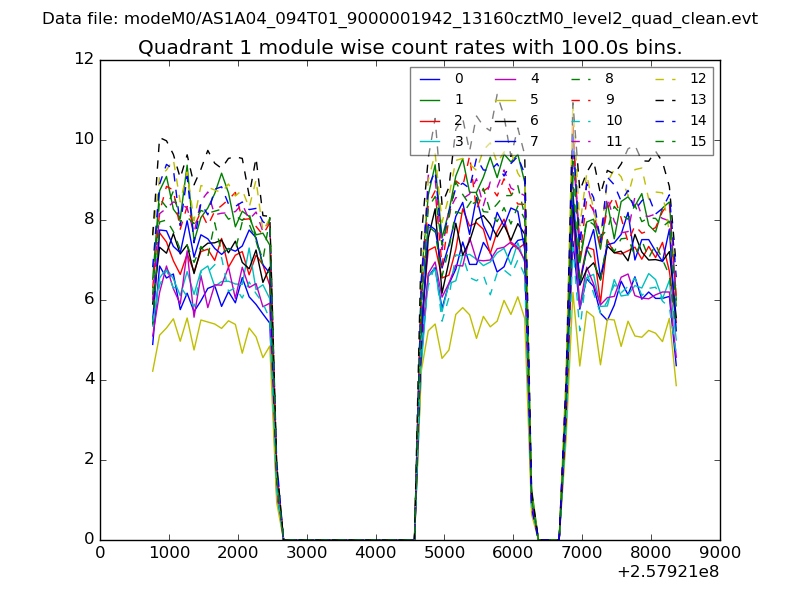 |
 |
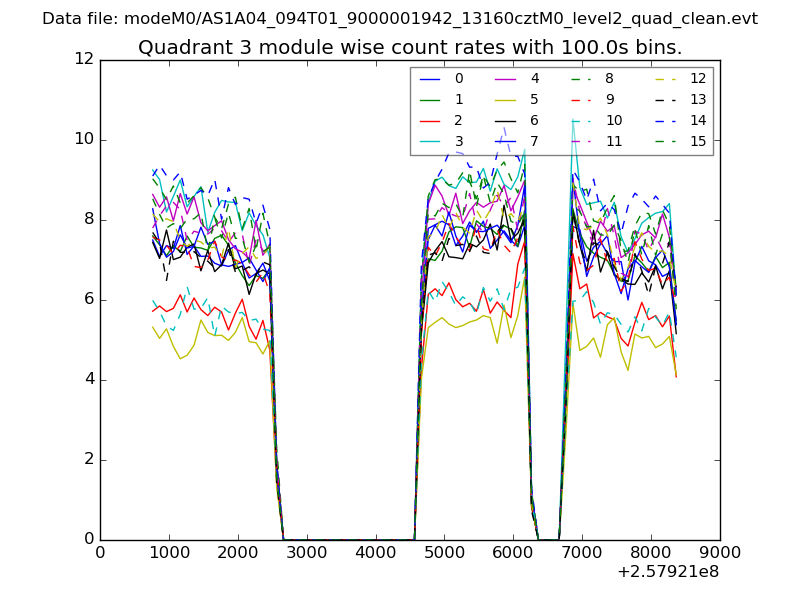
| Module-wise count rates for Quadrant C Data is divided into 100 sec bins |
 |
 |
| Module-wise count rates for Quadrant D Data is divided into 100 sec bins |
 |
 |
| Parameter | Plot |
|---|---|
| CZT HV Monitor |  |
| D_VDD | 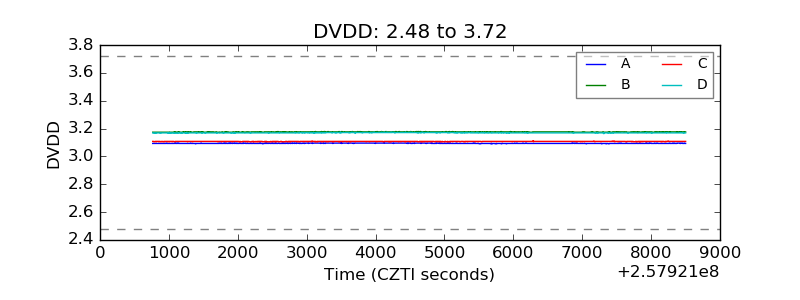 |
| Temperature 1 | 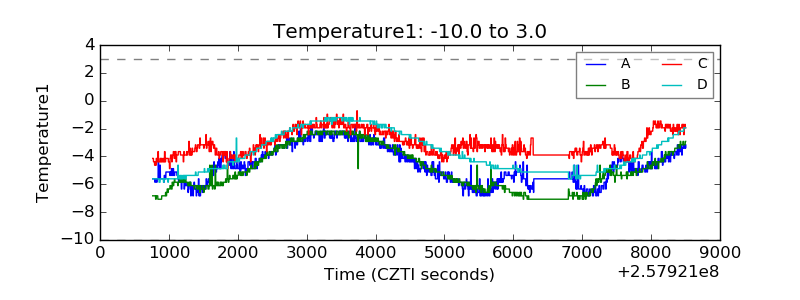 |
| Veto HV Monitor | 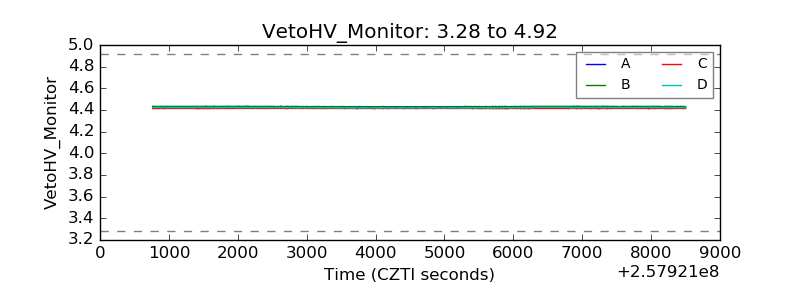 |
| Veto LLD | 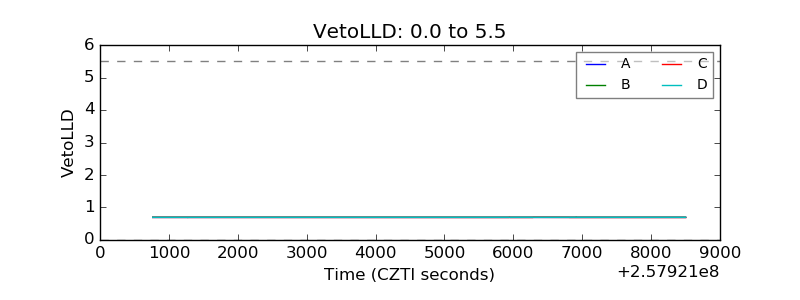 |
| Alpha Counter | 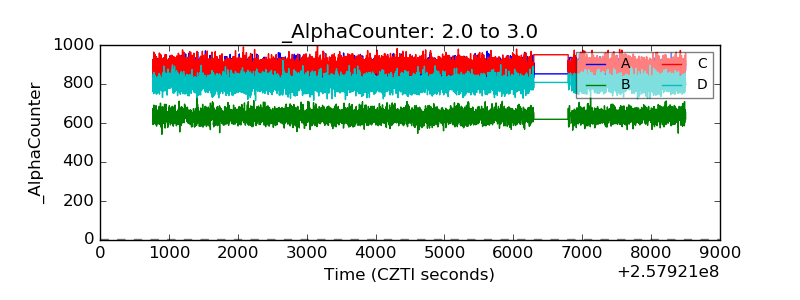 |
| _CPM_Rate | 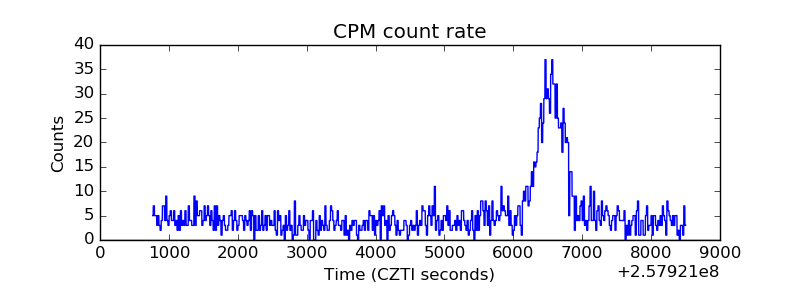 |
| CZT Counter | 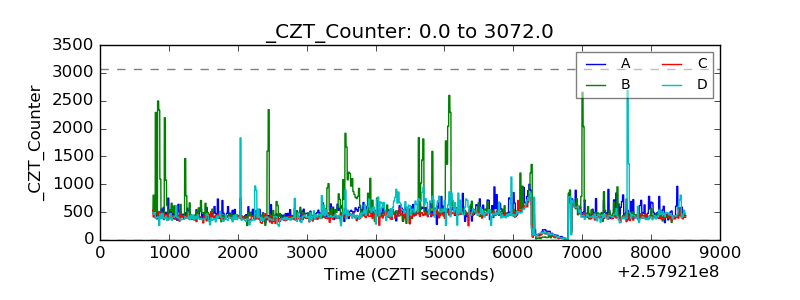 |
| +2.5 Volts monitor |  |
| +5 Volts monitor |  |
| _ROLL_ROT | 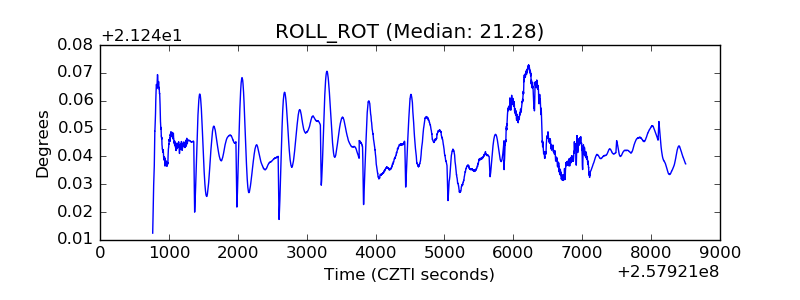 |
| _Roll_DEC | 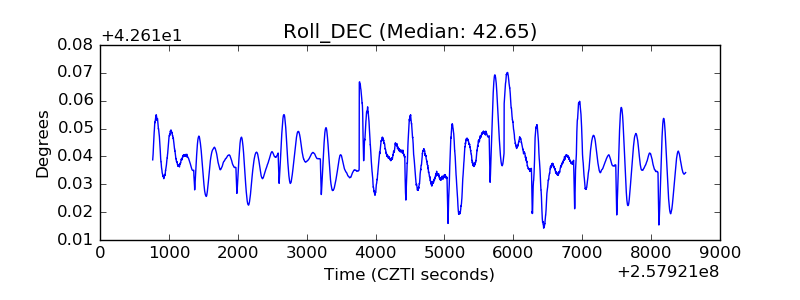 |
| _Roll_RA | 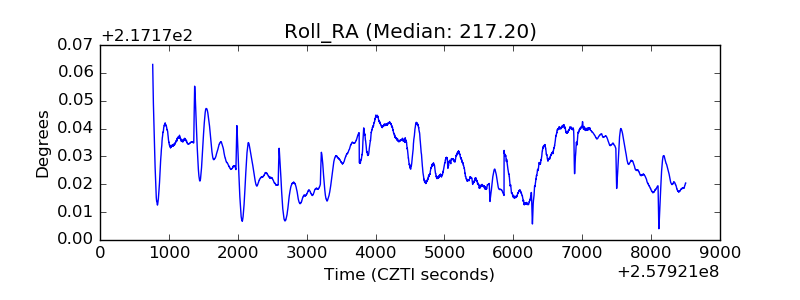 |
| Veto Counter | 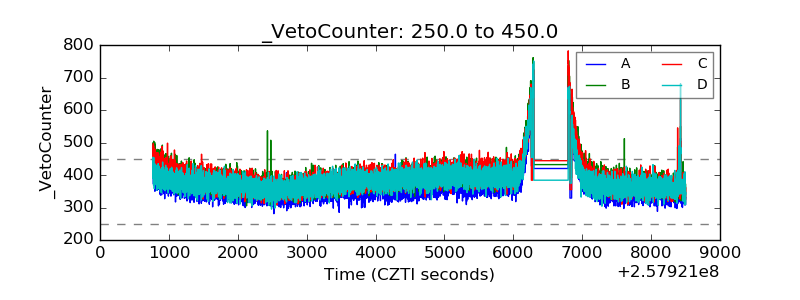 |