| Param | Original file | Final file |
|---|---|---|
| Filename | modeM0/AS1A04_094T01_9000001942_13162cztM0_level2.evt | modeM0/AS1A04_094T01_9000001942_13162cztM0_level2_quad_clean.evt |
| Size (bytes) | 570,283,200 | 85,907,520 |
| Size | 543.9 MB | 81.9 MB |
| Events in quadrant A | 3,679,568 | 520,971 |
| Events in quadrant B | 4,447,379 | 525,668 |
| Events in quadrant C | 3,334,030 | 533,980 |
| Events in quadrant D | 5,305,740 | 503,227 |
| Mode SS | |||
|---|---|---|---|
| Quadrant | BADHDUFLAG | Total packets | Discarded packets |
| A | 0 | 152 | 0 |
| B | 0 | 152 | 0 |
| C | 0 | 152 | 0 |
| D | 0 | 152 | 0 |
| Mode M9 | |||
|---|---|---|---|
| Quadrant | BADHDUFLAG | Total packets | Discarded packets |
| A | 0 | 1 | 0 |
| B | 0 | 1 | 0 |
| C | 0 | 1 | 0 |
| D | 0 | 1 | 0 |
| Mode M0 | |||
|---|---|---|---|
| Quadrant | BADHDUFLAG | Total packets | Discarded packets |
| A | 0 | 15733 | 2 |
| B | 0 | 18059 | 1 |
| C | 0 | 15249 | 1 |
| D | 0 | 20863 | 1 |
| Quadrant | Total seconds | Saturated seconds | Saturation percentage |
|---|---|---|---|
| A | 7425 | 246 | 3.313131% |
| B | 7425 | 552 | 7.434343% |
| C | 7425 | 180 | 2.424242% |
| D | 7425 | 557 | 7.501684% |
Noise dominated data is calculated using 1-second bins in cleaned event files. If a bin has >2000 counts, and if more than 50% of those come from <1% of pixels, then it is considered to be noise-dominated and hence unusable.
| Quadrant | # 1 sec bins | Bins with >0 counts | Bins with >2000 counts | High rate bins dominated by noise | Noise dominated (total time) | Noise dominated (detector-on time) | Marked lightcurve |
|---|---|---|---|---|---|---|---|
| A | 7581 | 7427 | 0 | 0 | 0.00% | 0.00% |  |
| B | 7581 | 7427 | 229 | 229 | 3.02% | 3.08% |  |
| C | 7581 | 7427 | 1 | 1 | 0.01% | 0.01% |  |
| D | 7581 | 7427 | 394 | 394 | 5.20% | 5.30% |  |
Top three noisy pixels from each quadrant. If the there are fewer than three noisy pixels in the level2.evt file, extra rows are filled as -1
| Pixel properties | Quadrant properties | ||||||
|---|---|---|---|---|---|---|---|
| Quadrant | DetID | PixID | Counts | Sigma | Mean | Median | Sigma |
| A | 12 | 189 | 115319 | 638.57 | 871 | 850 | 179.3 |
| A | 8 | 192 | 94435 | 522.06 | 871 | 850 | 179.3 |
| A | 0 | 23 | 69953 | 385.49 | 871 | 850 | 179.3 |
| B | 4 | 239 | 913541 | 5526.79 | 853 | 831 | 165.1 |
| B | 4 | 80 | 55224 | 329.37 | 853 | 831 | 165.1 |
| B | 0 | 189 | 45897 | 272.89 | 853 | 831 | 165.1 |
| C | 15 | 208 | 22210 | 107.79 | 847 | 849 | 198.2 |
| C | 13 | 61 | 6110 | 26.55 | 847 | 849 | 198.2 |
| C | 8 | 128 | 4668 | 19.27 | 847 | 849 | 198.2 |
| D | 1 | 52 | 1930185 | 9554.82 | 836 | 810 | 201.9 |
| D | 8 | 195 | 107133 | 526.54 | 836 | 810 | 201.9 |
| D | 5 | 222 | 51939 | 253.21 | 836 | 810 | 201.9 |
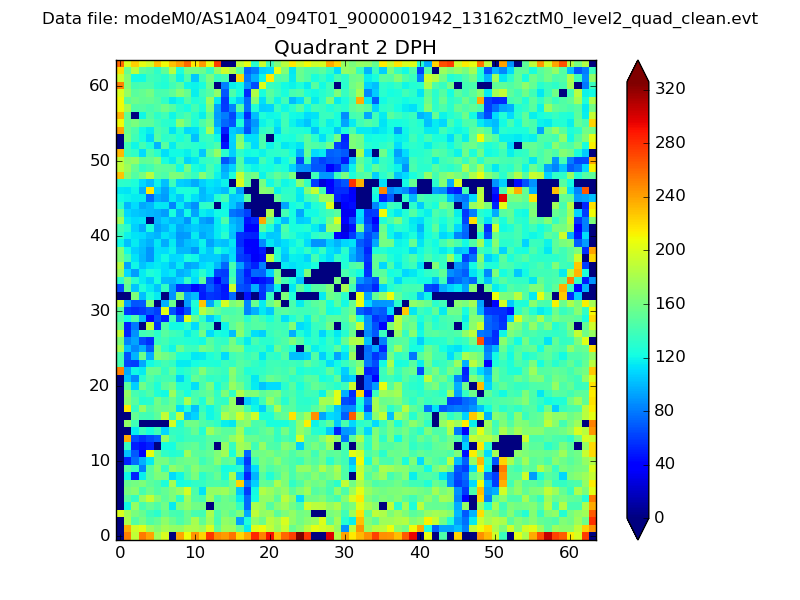
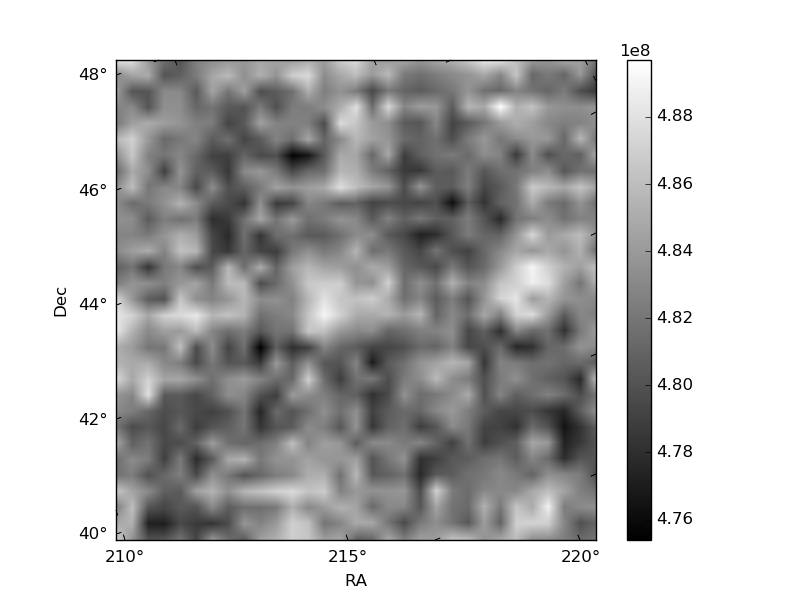
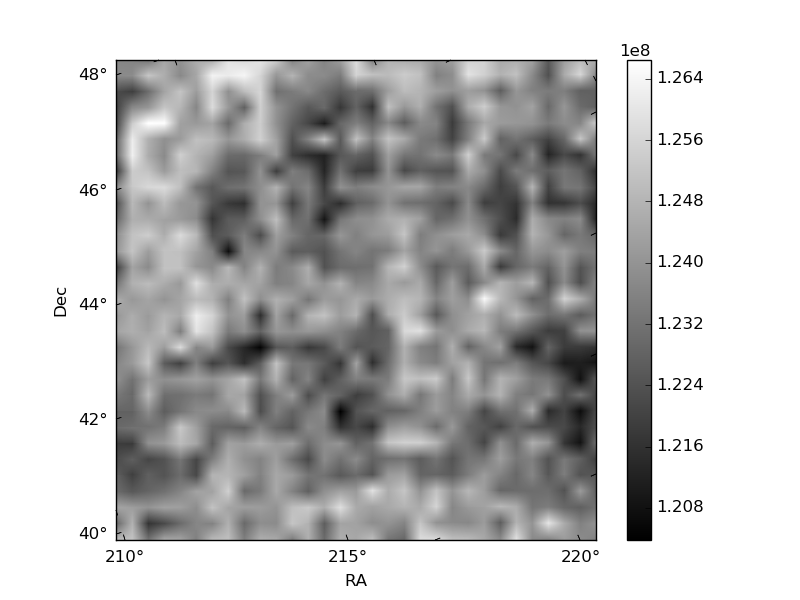
Histogram calculated using DETX and DETY for each event in the final _common_clean file
| Quadrant A | 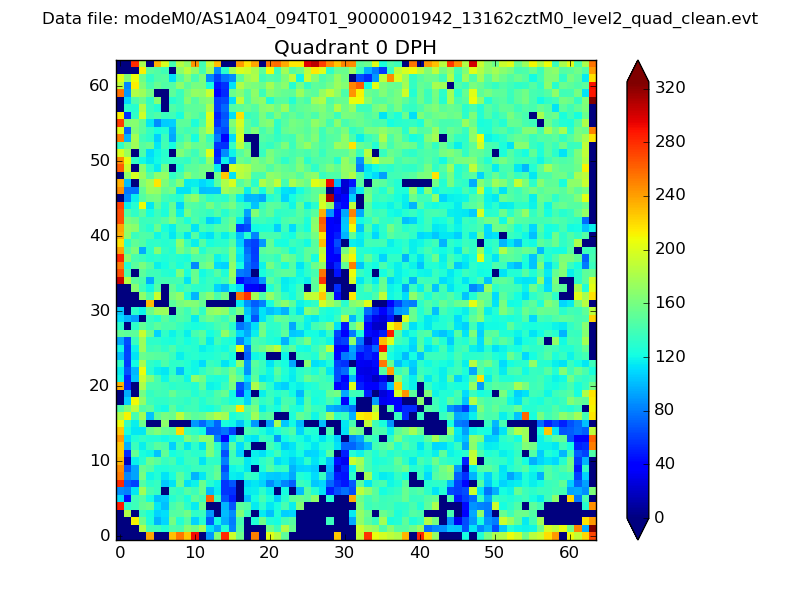 |
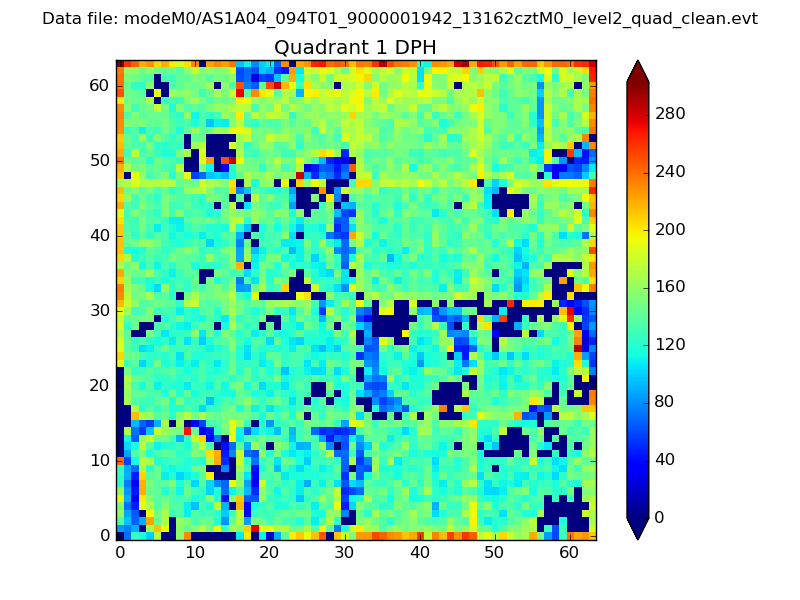 |
Quadrant B |
|---|---|---|---|
| Quadrant D | 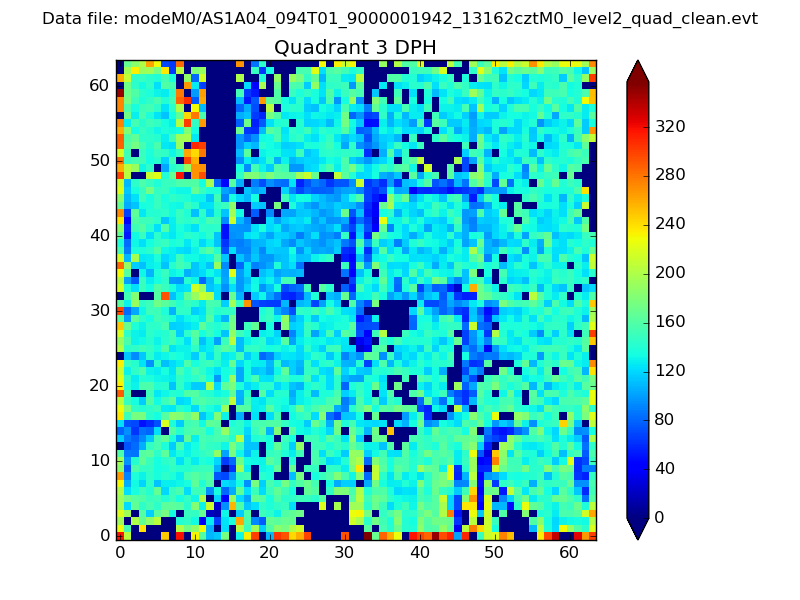 |
 |
Quadrant C |
| Plot type | Count rate plots | Images |
|---|---|---|
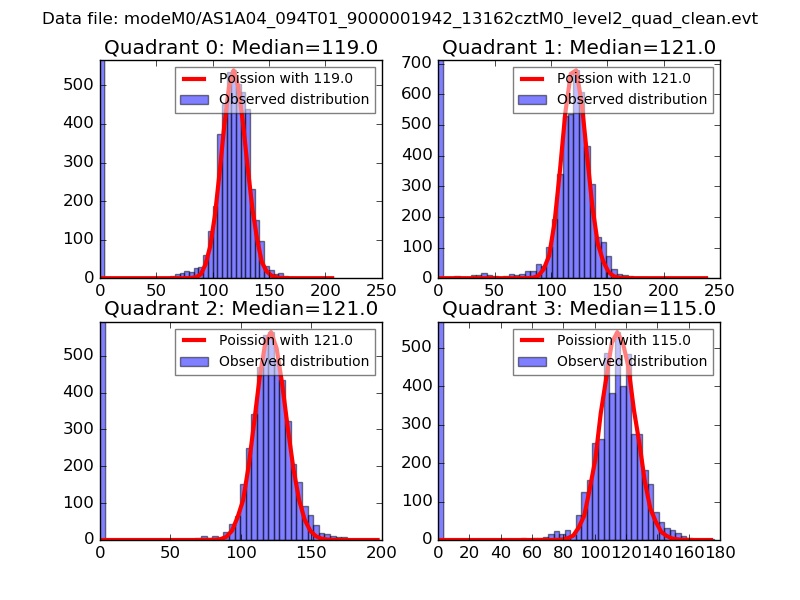
| Comparison with Poisson distribution Blue bars denote a histogram of data divided into 1 sec bins. Red curve is a Poisson curve with rate = median count rate of data. |
 |
 |
| Quadrant-wise count rates Data is divided into 100 sec bins |
 |
|
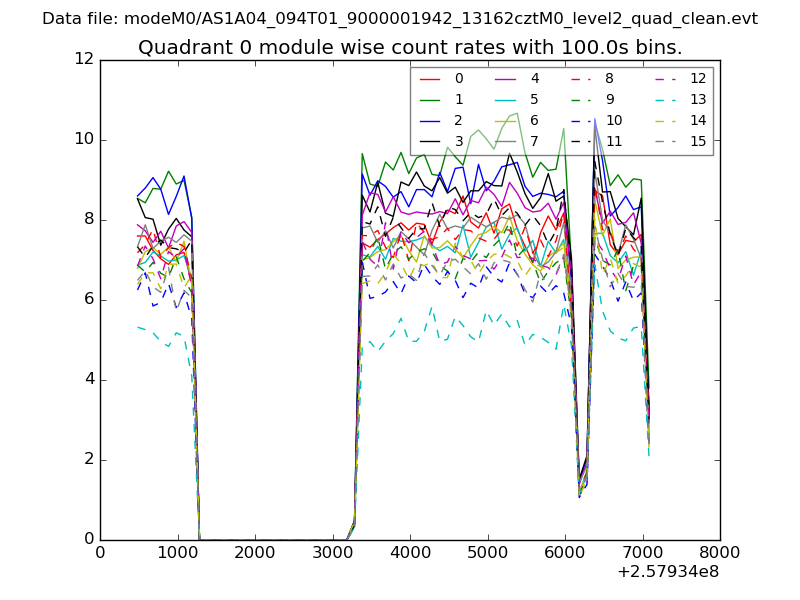
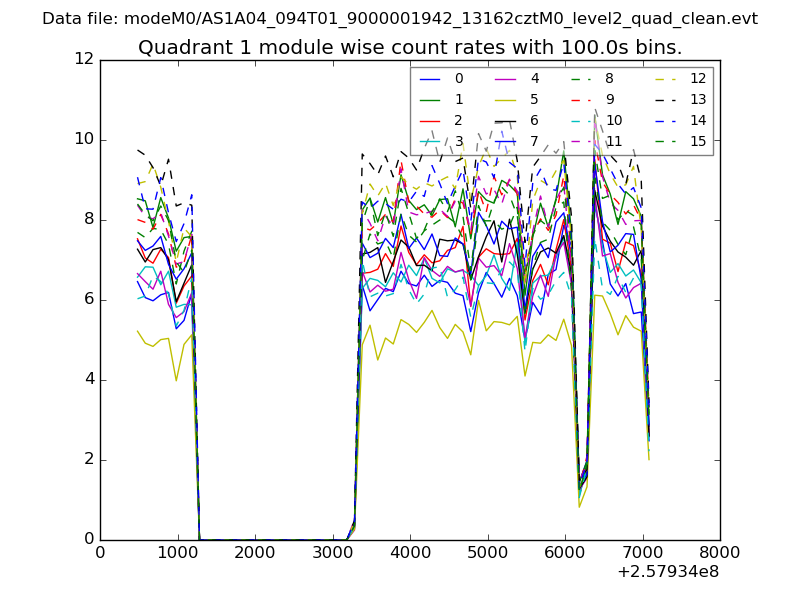
| Module-wise count rates for Quadrant A Data is divided into 100 sec bins |
 |
 |
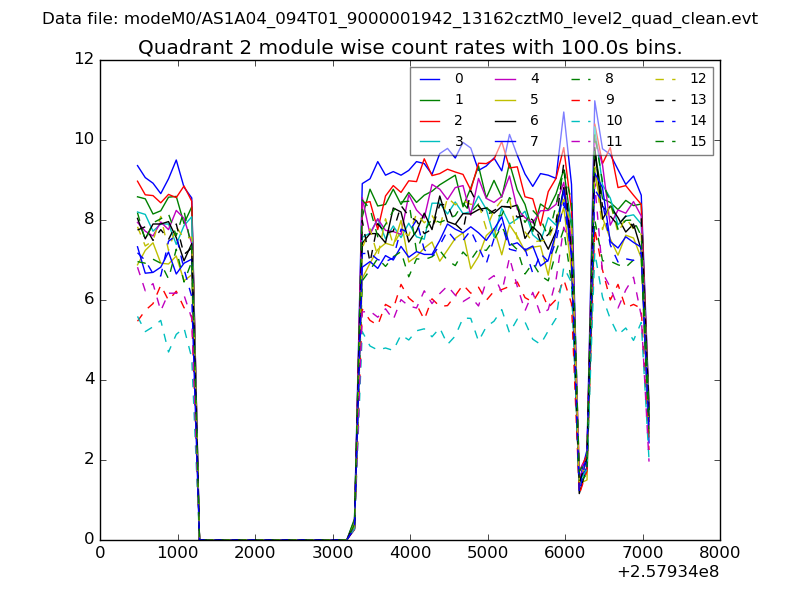
| Module-wise count rates for Quadrant B Data is divided into 100 sec bins |
 |
 |
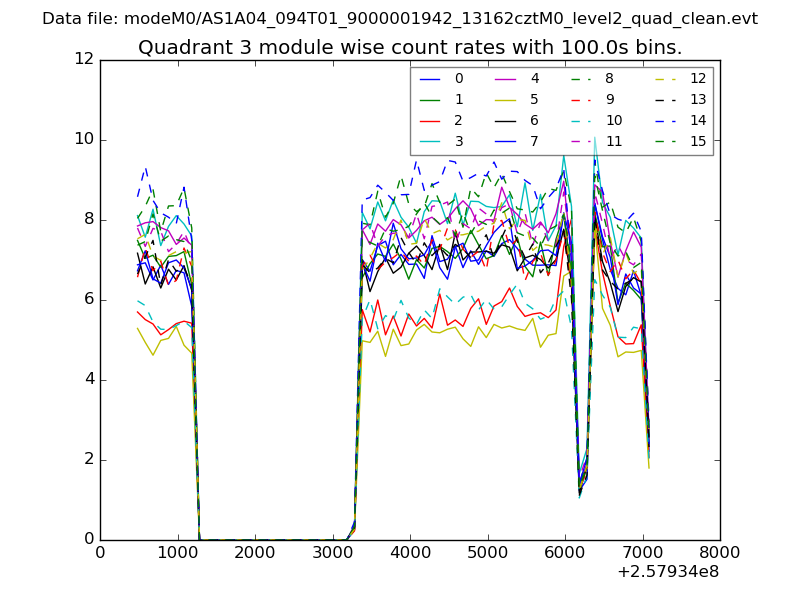
| Module-wise count rates for Quadrant C Data is divided into 100 sec bins |
 |
 |
| Module-wise count rates for Quadrant D Data is divided into 100 sec bins |
 |
 |
| Parameter | Plot |
|---|---|
| CZT HV Monitor | 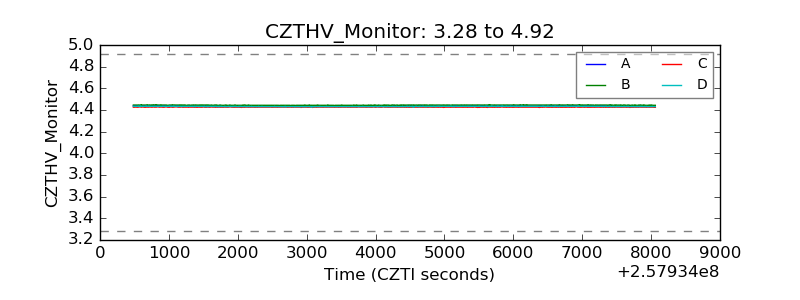 |
| D_VDD | 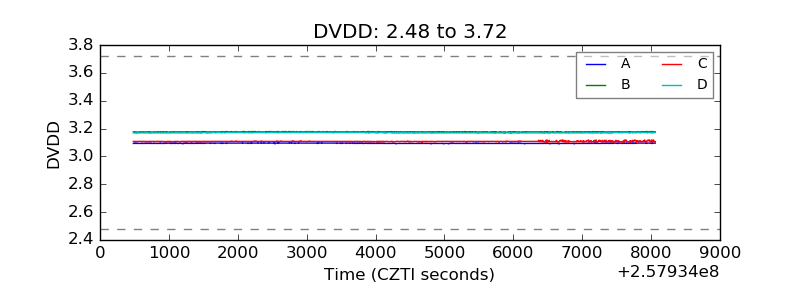 |
| Temperature 1 | 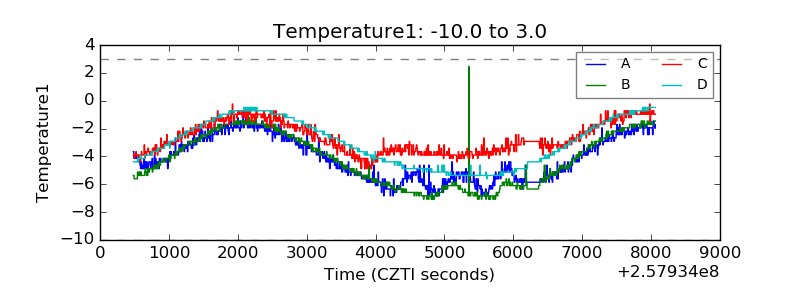 |
| Veto HV Monitor | 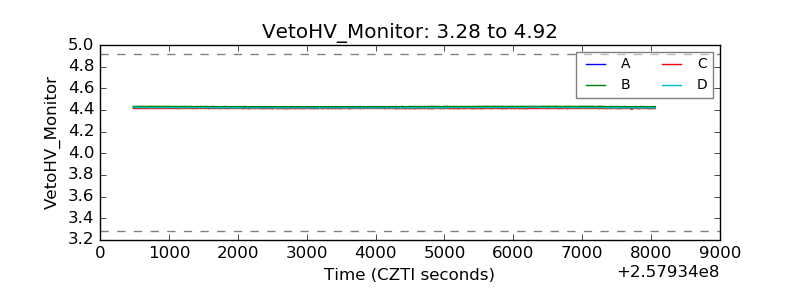 |
| Veto LLD | 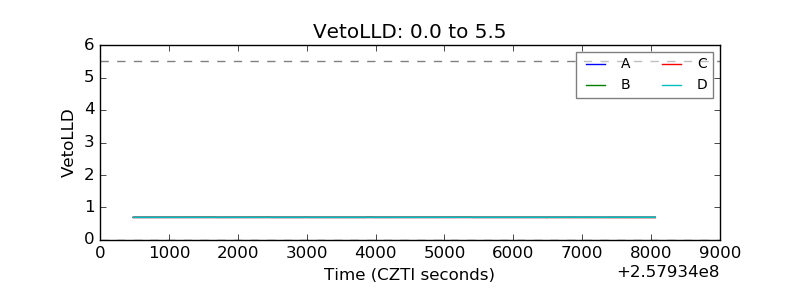 |
| Alpha Counter | 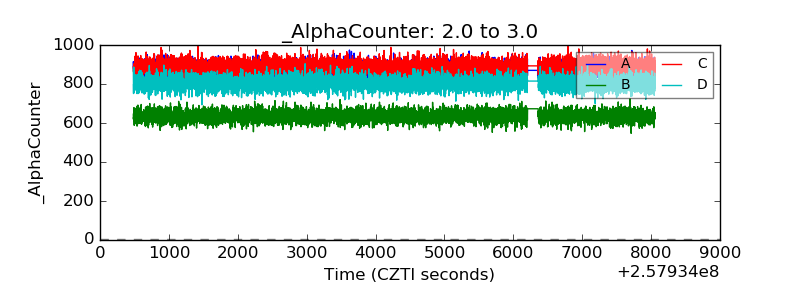 |
| _CPM_Rate | 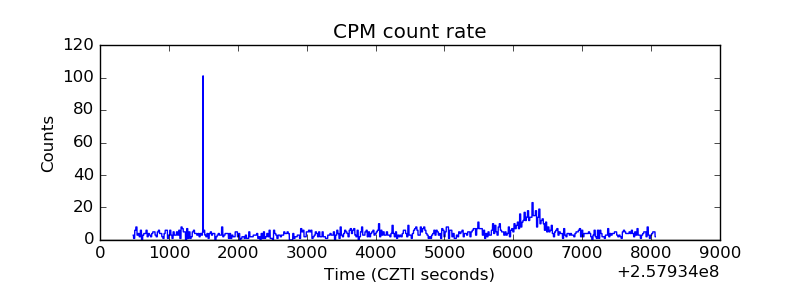 |
| CZT Counter |  |
| +2.5 Volts monitor |  |
| +5 Volts monitor |  |
| _ROLL_ROT | 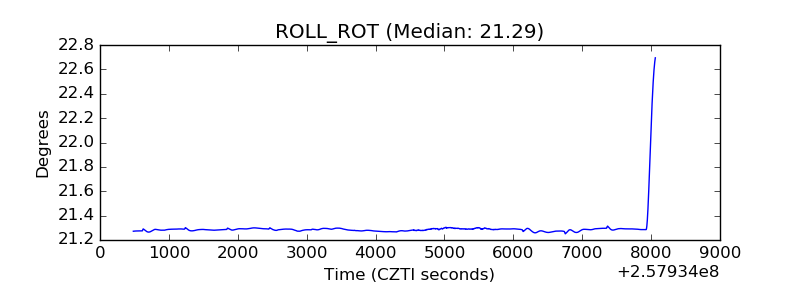 |
| _Roll_DEC | 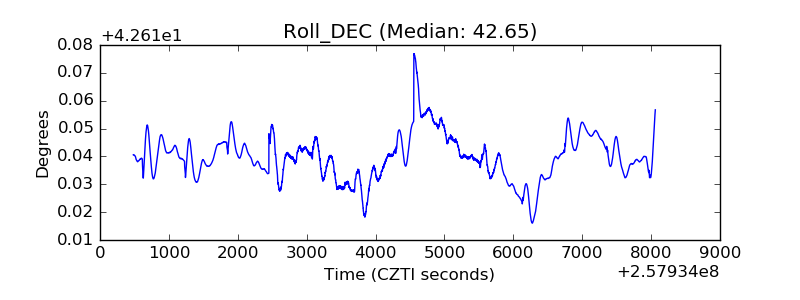 |
| _Roll_RA | 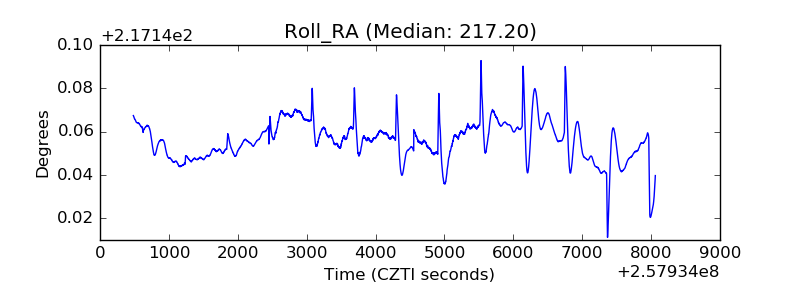 |
| Veto Counter | 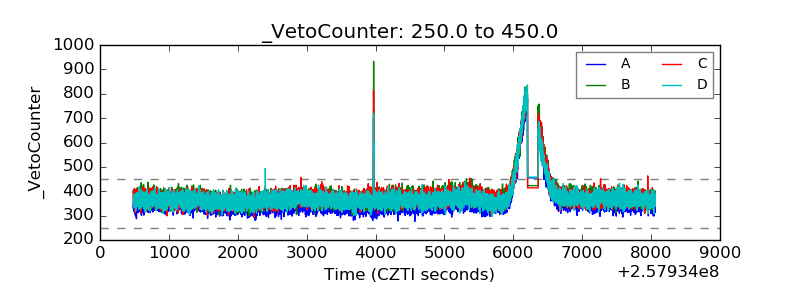 |