| Param | Original file | Final file |
|---|---|---|
| Filename | modeM0/AS1A04_094T01_9000001942_13165cztM0_level2.evt | modeM0/AS1A04_094T01_9000001942_13165cztM0_level2_quad_clean.evt |
| Size (bytes) | 1,418,852,160 | 209,263,680 |
| Size | 1.3 GB | 199.6 MB |
| Events in quadrant A | 8,773,133 | 1,275,508 |
| Events in quadrant B | 10,906,051 | 1,290,104 |
| Events in quadrant C | 8,116,637 | 1,292,793 |
| Events in quadrant D | 13,941,333 | 1,221,403 |
| Mode SS | |||
|---|---|---|---|
| Quadrant | BADHDUFLAG | Total packets | Discarded packets |
| A | 0 | 372 | 0 |
| B | 0 | 372 | 0 |
| C | 0 | 372 | 0 |
| D | 0 | 372 | 0 |
| Mode M9 | |||
|---|---|---|---|
| Quadrant | BADHDUFLAG | Total packets | Discarded packets |
| A | 0 | 19 | 0 |
| B | 0 | 19 | 0 |
| C | 0 | 19 | 0 |
| D | 0 | 19 | 0 |
| Mode M0 | |||
|---|---|---|---|
| Quadrant | BADHDUFLAG | Total packets | Discarded packets |
| A | 0 | 37781 | 4 |
| B | 0 | 44429 | 3 |
| C | 0 | 36990 | 3 |
| D | 0 | 53815 | 3 |
| Quadrant | Total seconds | Saturated seconds | Saturation percentage |
|---|---|---|---|
| A | 18244 | 215 | 1.178470% |
| B | 18244 | 1188 | 6.511730% |
| C | 18244 | 177 | 0.970182% |
| D | 18244 | 1481 | 8.117737% |
Noise dominated data is calculated using 1-second bins in cleaned event files. If a bin has >2000 counts, and if more than 50% of those come from <1% of pixels, then it is considered to be noise-dominated and hence unusable.
| Quadrant | # 1 sec bins | Bins with >0 counts | Bins with >2000 counts | High rate bins dominated by noise | Noise dominated (total time) | Noise dominated (detector-on time) | Marked lightcurve |
|---|---|---|---|---|---|---|---|
| A | 20140 | 18248 | 4 | 4 | 0.02% | 0.02% | 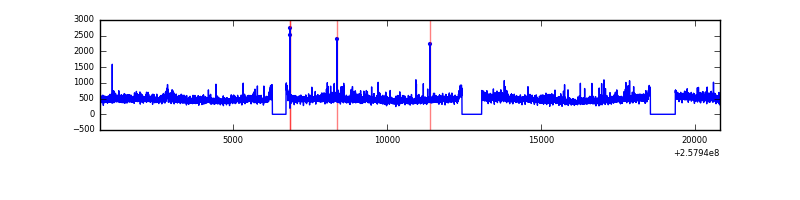 |
| B | 20140 | 18248 | 534 | 534 | 2.65% | 2.93% | 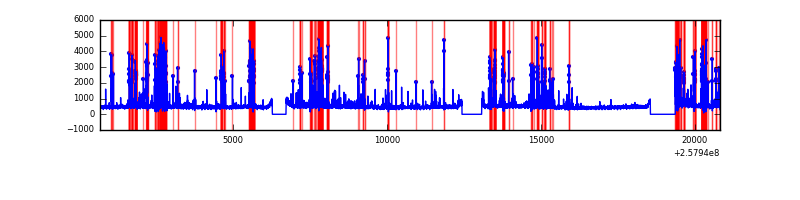 |
| C | 20140 | 18248 | 1 | 1 | 0.00% | 0.01% | 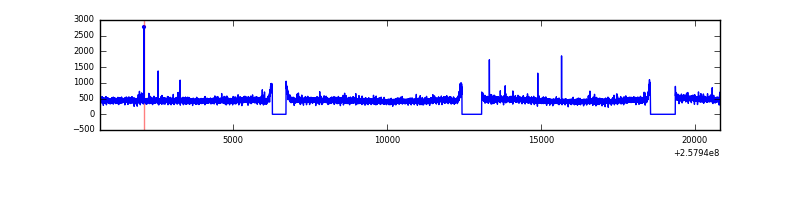 |
| D | 20140 | 18247 | 1152 | 1152 | 5.72% | 6.31% | 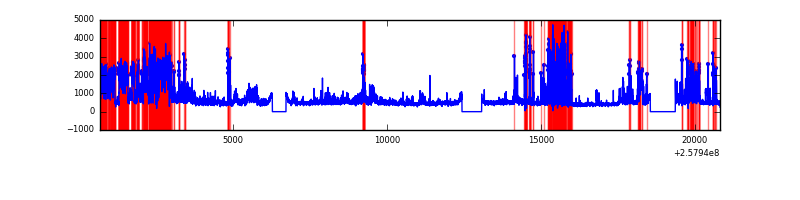 |
Top three noisy pixels from each quadrant. If the there are fewer than three noisy pixels in the level2.evt file, extra rows are filled as -1
| Pixel properties | Quadrant properties | ||||||
|---|---|---|---|---|---|---|---|
| Quadrant | DetID | PixID | Counts | Sigma | Mean | Median | Sigma |
| A | 12 | 189 | 341936 | 786.58 | 2128 | 2081 | 432.1 |
| A | 1 | 162 | 77753 | 175.14 | 2128 | 2081 | 432.1 |
| A | 0 | 23 | 56227 | 125.32 | 2128 | 2081 | 432.1 |
| B | 4 | 239 | 2439907 | 6278.09 | 2056 | 2006 | 388.3 |
| B | 3 | 209 | 90452 | 227.77 | 2056 | 2006 | 388.3 |
| B | 3 | 64 | 84010 | 211.18 | 2056 | 2006 | 388.3 |
| C | 15 | 208 | 23883 | 45.64 | 2070 | 2079 | 477.7 |
| C | 13 | 61 | 15216 | 27.5 | 2070 | 2079 | 477.7 |
| C | 8 | 128 | 11496 | 19.71 | 2070 | 2079 | 477.7 |
| D | 1 | 52 | 3620103 | 7451.96 | 2020 | 1961 | 485.5 |
| D | 10 | 157 | 1201042 | 2469.64 | 2020 | 1961 | 485.5 |
| D | 8 | 195 | 1062594 | 2184.49 | 2020 | 1961 | 485.5 |
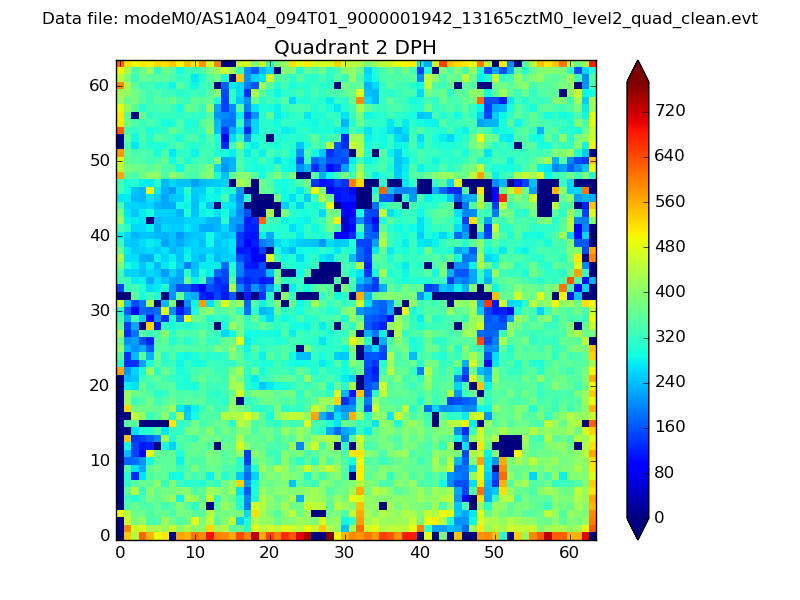
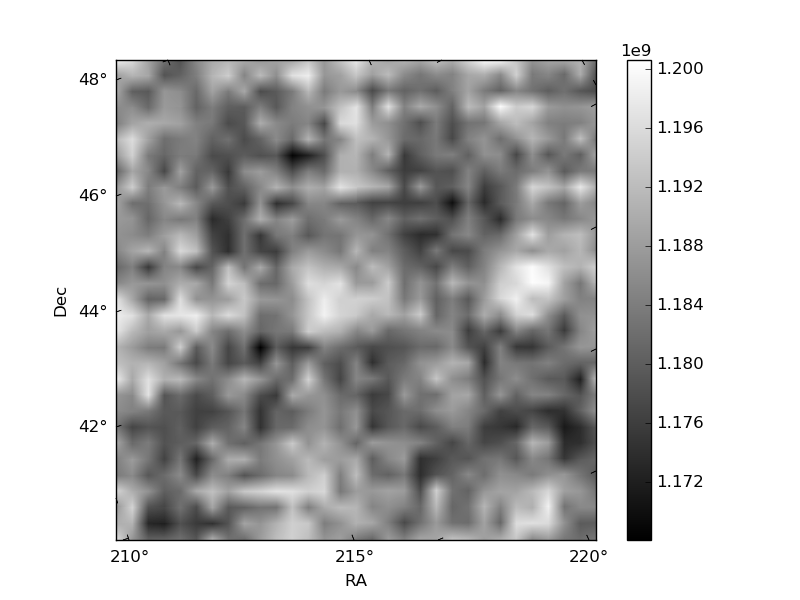
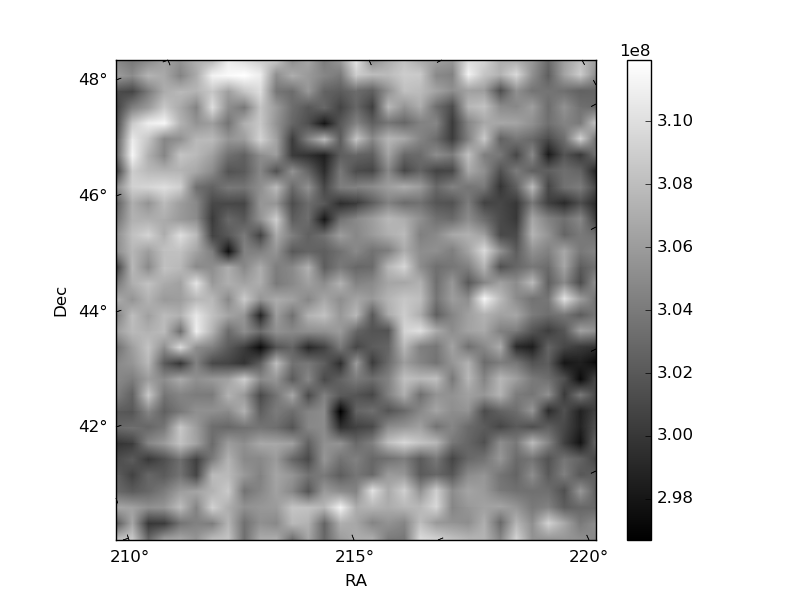
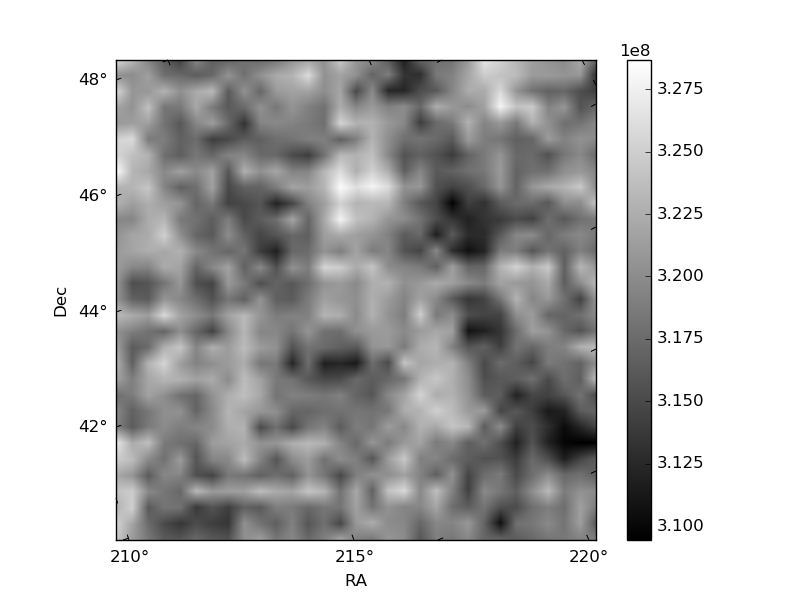
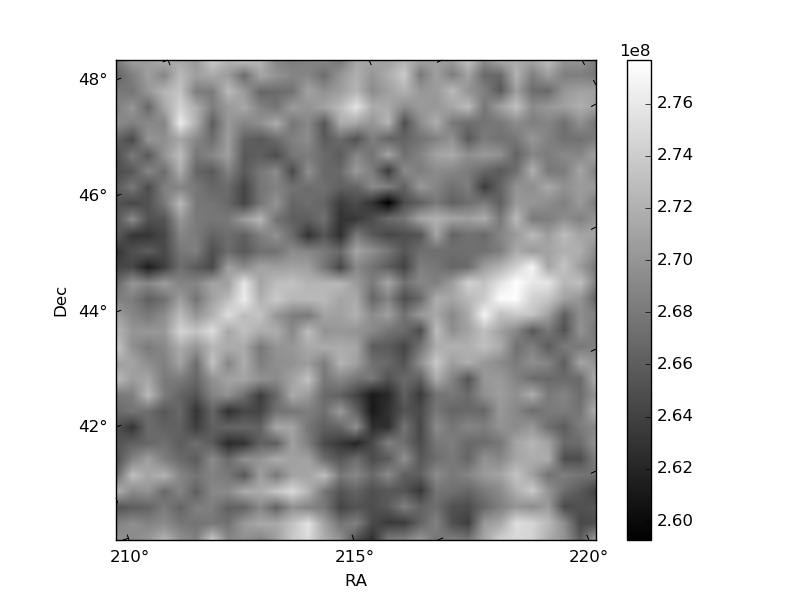
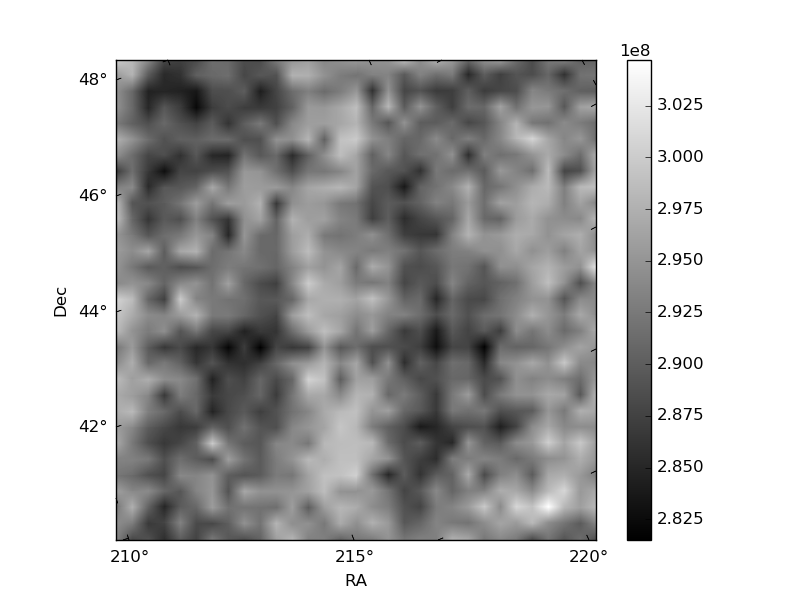
Histogram calculated using DETX and DETY for each event in the final _common_clean file
| Quadrant A | 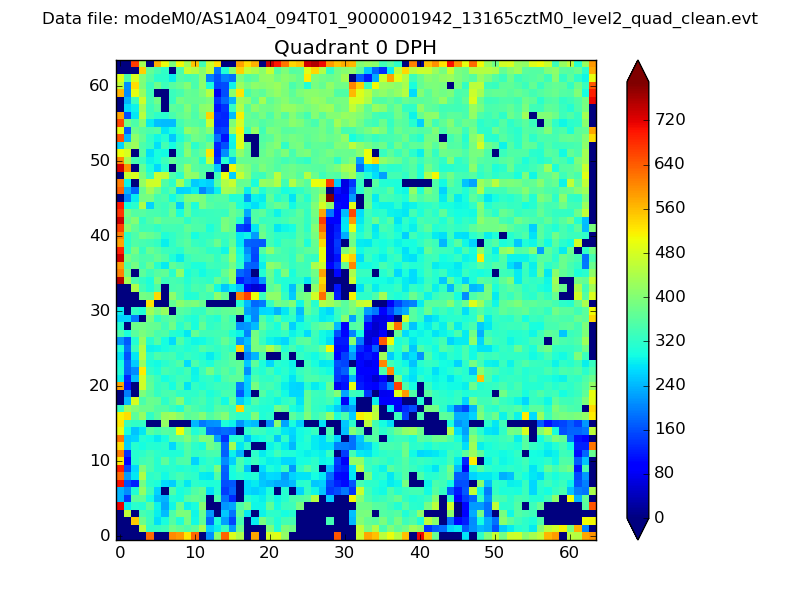 |
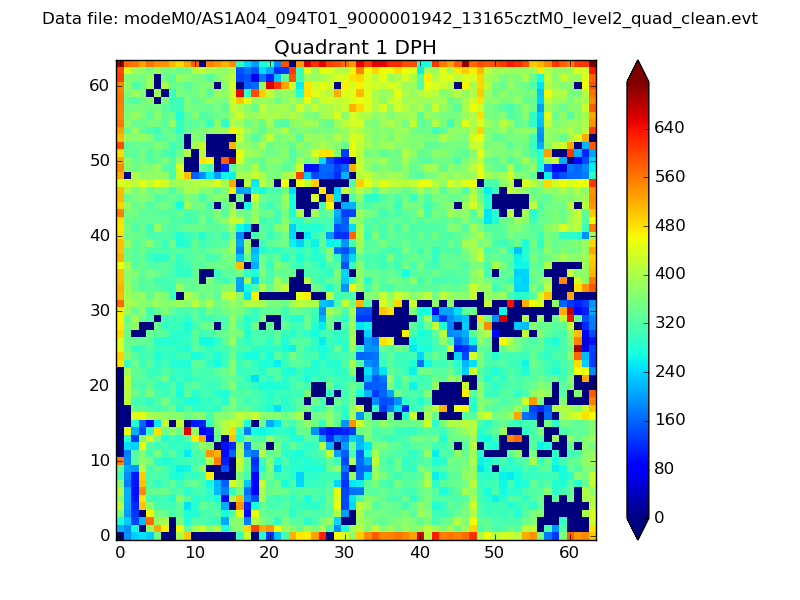 |
Quadrant B |
|---|---|---|---|
| Quadrant D | 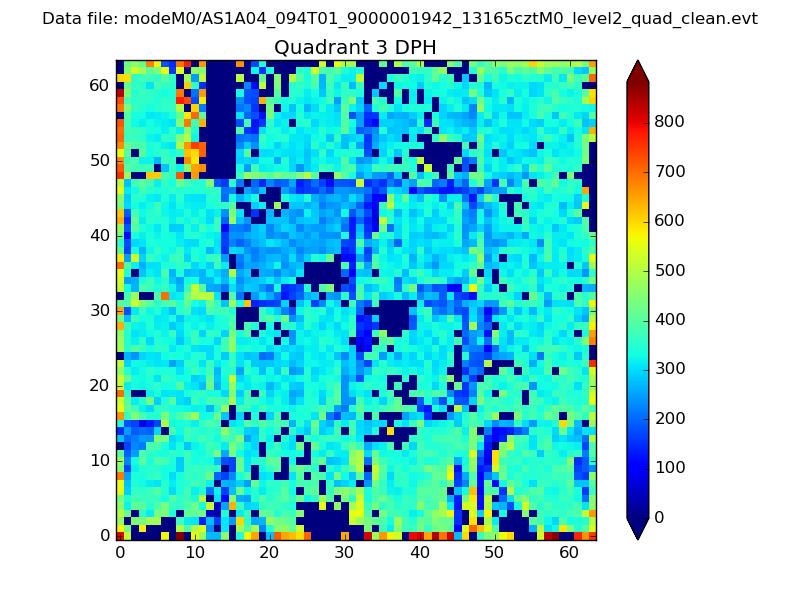 |
 |
Quadrant C |
| Plot type | Count rate plots | Images |
|---|---|---|
| Comparison with Poisson distribution Blue bars denote a histogram of data divided into 1 sec bins. Red curve is a Poisson curve with rate = median count rate of data. |
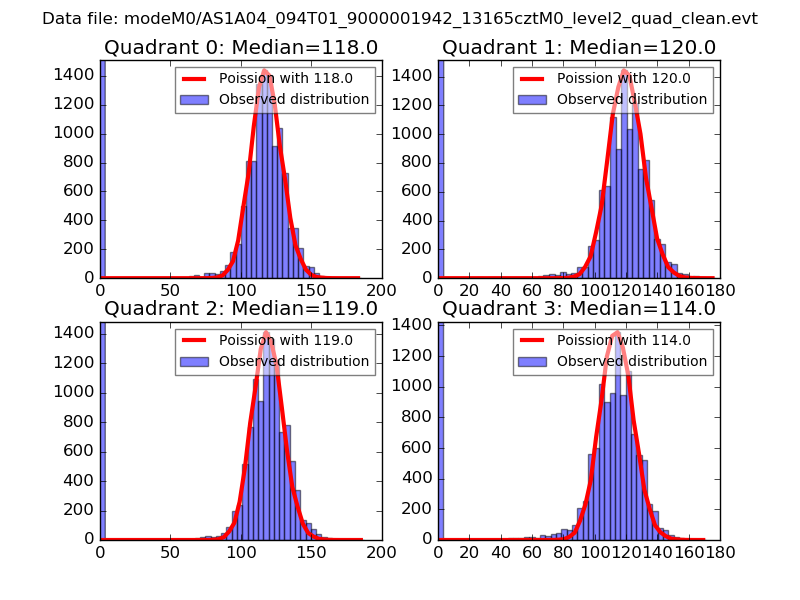 |
 |
| Quadrant-wise count rates Data is divided into 100 sec bins |
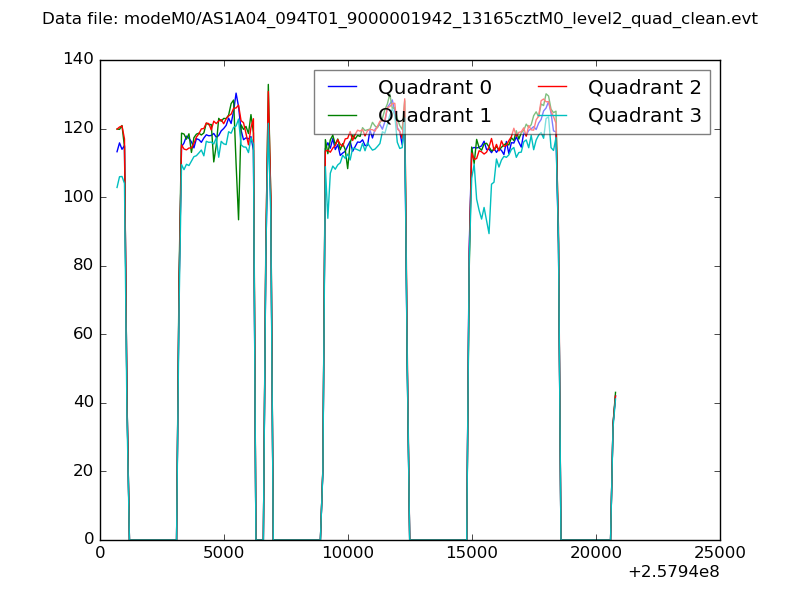 |
|
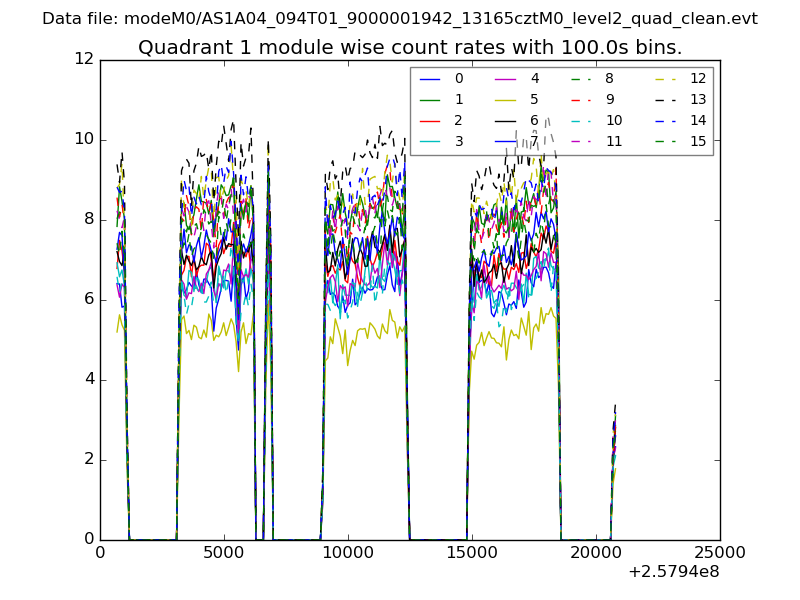
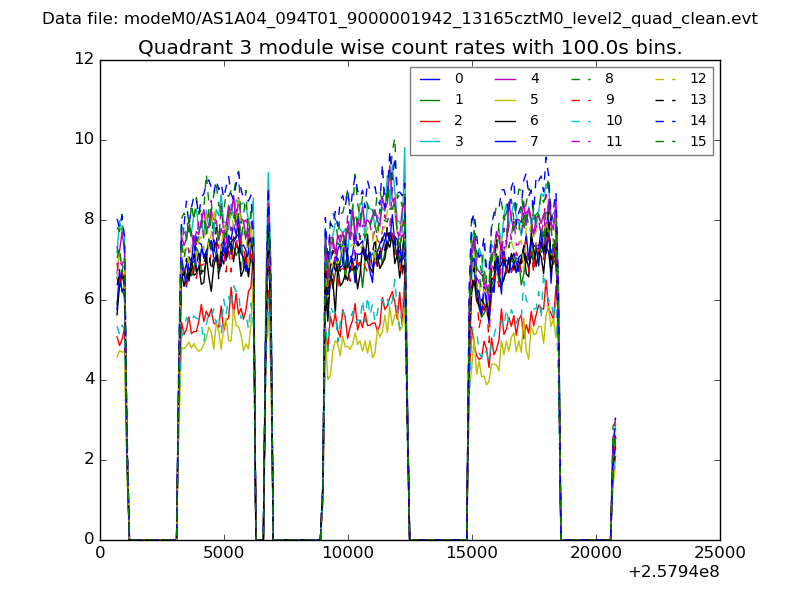
| Module-wise count rates for Quadrant A Data is divided into 100 sec bins |
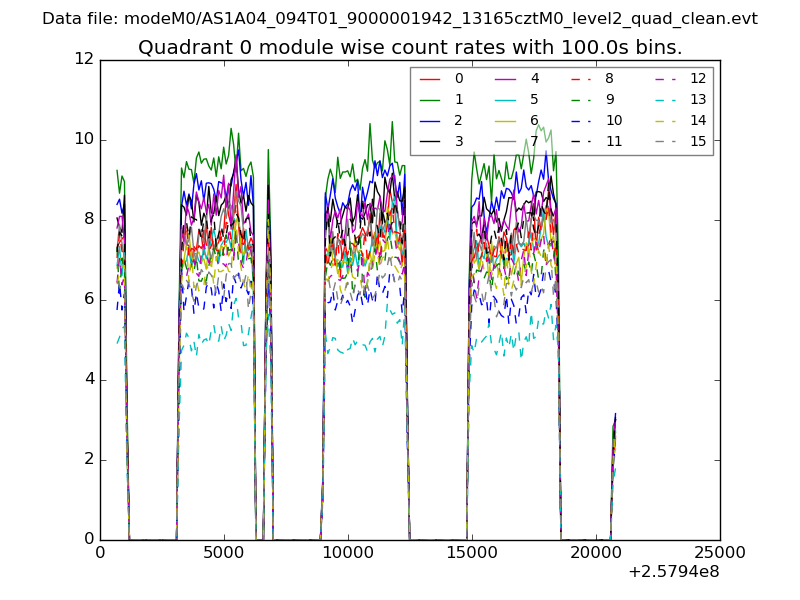 |
 |
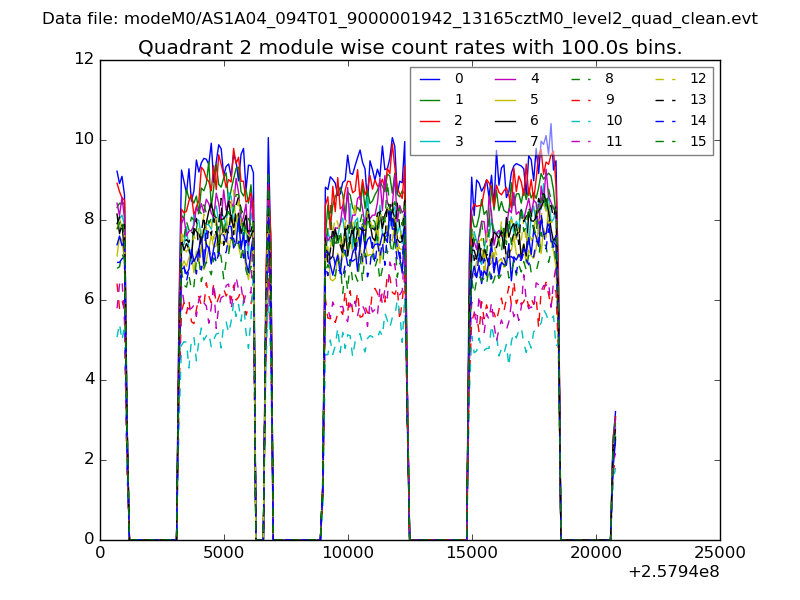
| Module-wise count rates for Quadrant B Data is divided into 100 sec bins |
 |
 |
| Module-wise count rates for Quadrant C Data is divided into 100 sec bins |
 |
 |
| Module-wise count rates for Quadrant D Data is divided into 100 sec bins |
 |
 |
| Parameter | Plot |
|---|---|
| CZT HV Monitor | 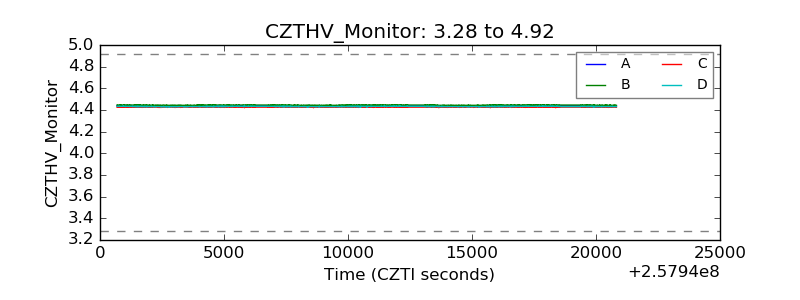 |
| D_VDD | 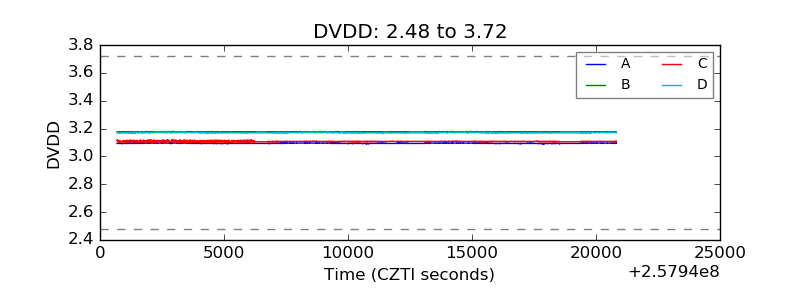 |
| Temperature 1 | 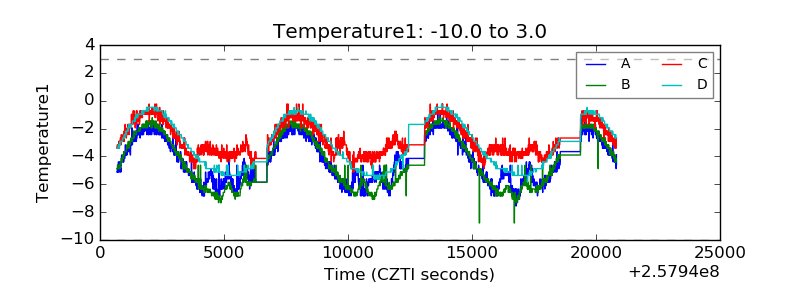 |
| Veto HV Monitor | 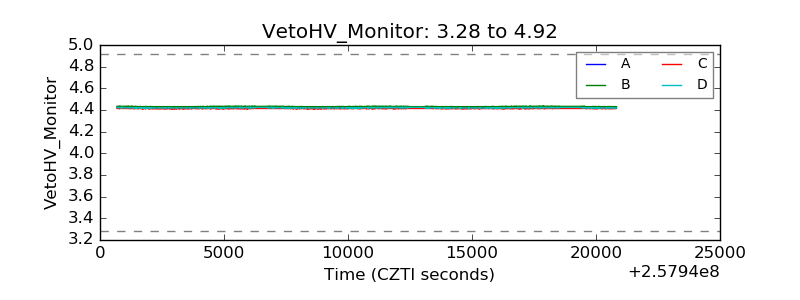 |
| Veto LLD | 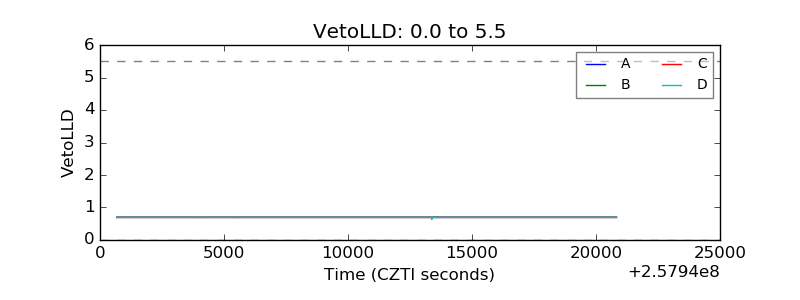 |
| Alpha Counter | 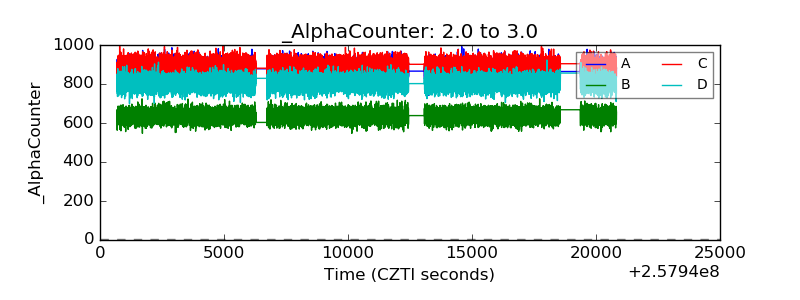 |
| _CPM_Rate | 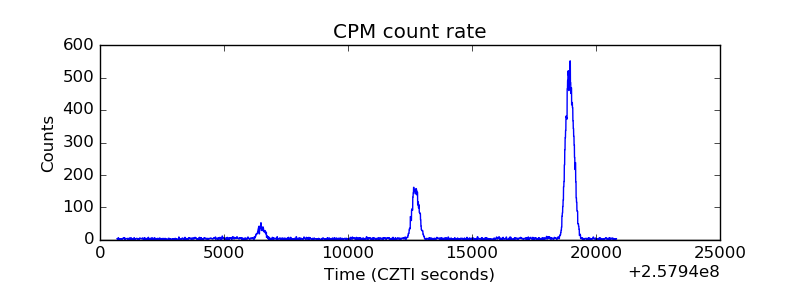 |
| CZT Counter | 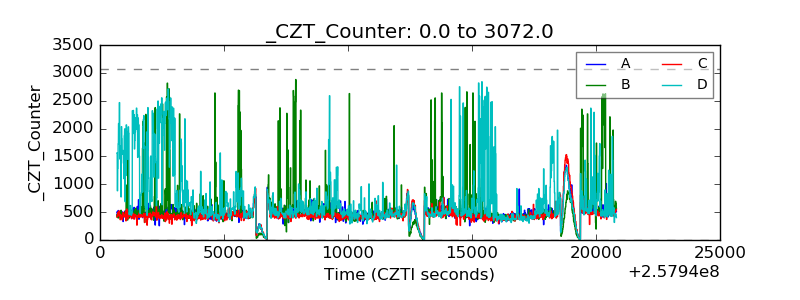 |
| +2.5 Volts monitor |  |
| +5 Volts monitor |  |
| _ROLL_ROT | 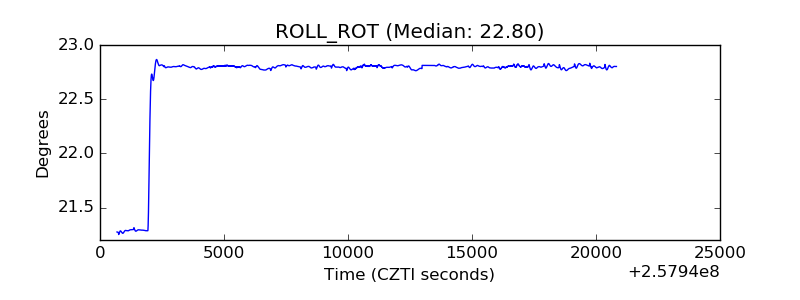 |
| _Roll_DEC | 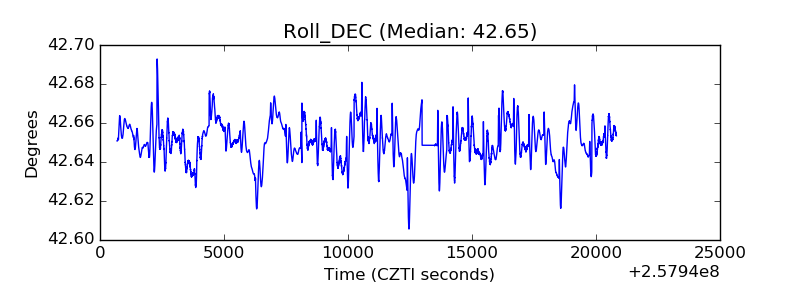 |
| _Roll_RA | 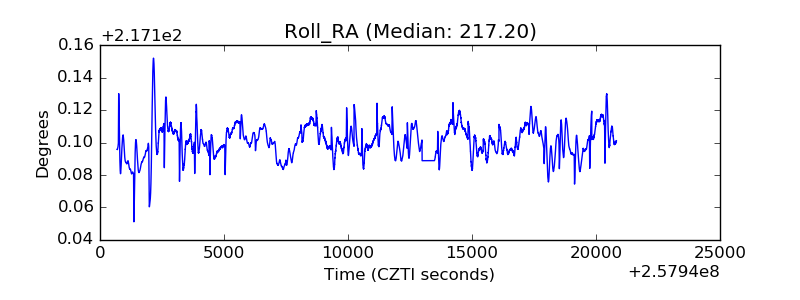 |
| Veto Counter | 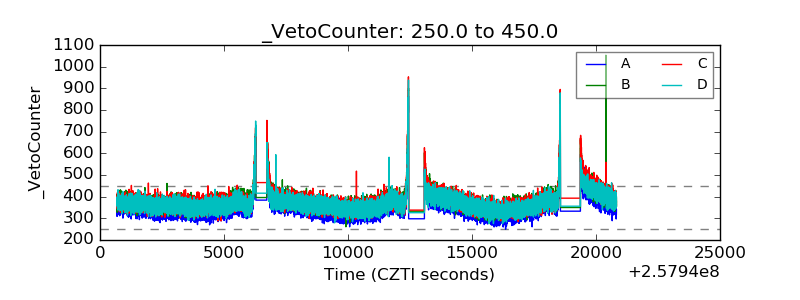 |