| Param | Original file | Final file |
|---|---|---|
| Filename | modeM0/AS1A04_094T01_9000001942_13166cztM0_level2.evt | modeM0/AS1A04_094T01_9000001942_13166cztM0_level2_quad_clean.evt |
| Size (bytes) | 508,466,880 | 80,245,440 |
| Size | 484.9 MB | 76.5 MB |
| Events in quadrant A | 3,339,984 | 494,004 |
| Events in quadrant B | 4,529,105 | 487,587 |
| Events in quadrant C | 3,115,218 | 502,780 |
| Events in quadrant D | 3,958,630 | 477,311 |
| Mode SS | |||
|---|---|---|---|
| Quadrant | BADHDUFLAG | Total packets | Discarded packets |
| A | 0 | 138 | 0 |
| B | 0 | 138 | 0 |
| C | 0 | 138 | 0 |
| D | 0 | 138 | 0 |
| Mode M9 | |||
|---|---|---|---|
| Quadrant | BADHDUFLAG | Total packets | Discarded packets |
| A | 0 | 18 | 0 |
| B | 0 | 18 | 0 |
| C | 0 | 18 | 0 |
| D | 0 | 18 | 0 |
| Mode M0 | |||
|---|---|---|---|
| Quadrant | BADHDUFLAG | Total packets | Discarded packets |
| A | 0 | 14263 | 3 |
| B | 0 | 18091 | 2 |
| C | 0 | 13824 | 2 |
| D | 0 | 16547 | 2 |
| Quadrant | Total seconds | Saturated seconds | Saturation percentage |
|---|---|---|---|
| A | 6715 | 90 | 1.340283% |
| B | 6715 | 618 | 9.203276% |
| C | 6715 | 80 | 1.191363% |
| D | 6715 | 294 | 4.378258% |
Noise dominated data is calculated using 1-second bins in cleaned event files. If a bin has >2000 counts, and if more than 50% of those come from <1% of pixels, then it is considered to be noise-dominated and hence unusable.
| Quadrant | # 1 sec bins | Bins with >0 counts | Bins with >2000 counts | High rate bins dominated by noise | Noise dominated (total time) | Noise dominated (detector-on time) | Marked lightcurve |
|---|---|---|---|---|---|---|---|
| A | 8491 | 6718 | 0 | 0 | 0.00% | 0.00% | 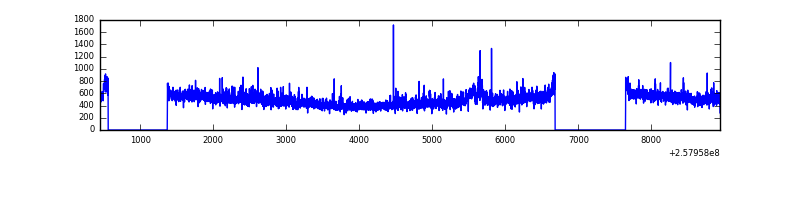 |
| B | 8491 | 6718 | 283 | 283 | 3.33% | 4.21% | 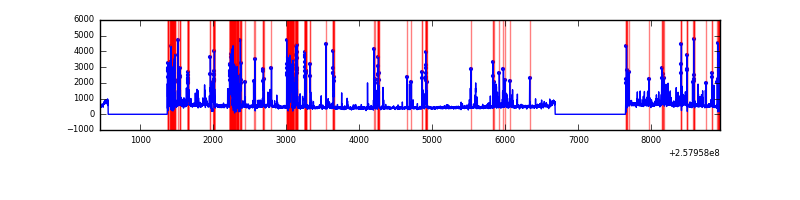 |
| C | 8491 | 6718 | 0 | 0 | 0.00% | 0.00% | 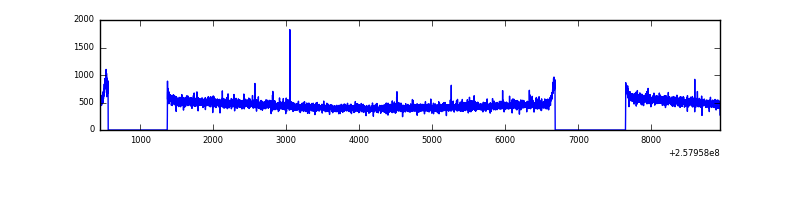 |
| D | 8491 | 6718 | 173 | 173 | 2.04% | 2.58% | 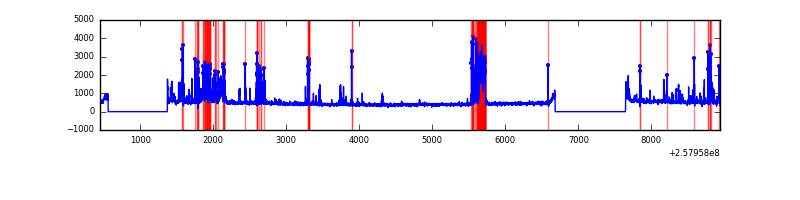 |
Top three noisy pixels from each quadrant. If the there are fewer than three noisy pixels in the level2.evt file, extra rows are filled as -1
| Pixel properties | Quadrant properties | ||||||
|---|---|---|---|---|---|---|---|
| Quadrant | DetID | PixID | Counts | Sigma | Mean | Median | Sigma |
| A | 12 | 189 | 141001 | 848.99 | 810 | 790 | 165.2 |
| A | 1 | 162 | 27116 | 159.41 | 810 | 790 | 165.2 |
| A | 8 | 15 | 19444 | 112.95 | 810 | 790 | 165.2 |
| B | 4 | 239 | 1356968 | 9185.65 | 771 | 750 | 147.6 |
| B | 0 | 189 | 51819 | 345.89 | 771 | 750 | 147.6 |
| B | 3 | 209 | 30022 | 198.26 | 771 | 750 | 147.6 |
| C | 15 | 208 | 10025 | 50.02 | 796 | 800 | 184.4 |
| C | 13 | 61 | 5690 | 26.51 | 796 | 800 | 184.4 |
| C | 3 | 202 | 2029 | 6.66 | 796 | 800 | 184.4 |
| D | 1 | 52 | 468902 | 2441.44 | 784 | 760 | 191.7 |
| D | 14 | 34 | 304390 | 1583.48 | 784 | 760 | 191.7 |
| D | 10 | 157 | 153825 | 798.26 | 784 | 760 | 191.7 |
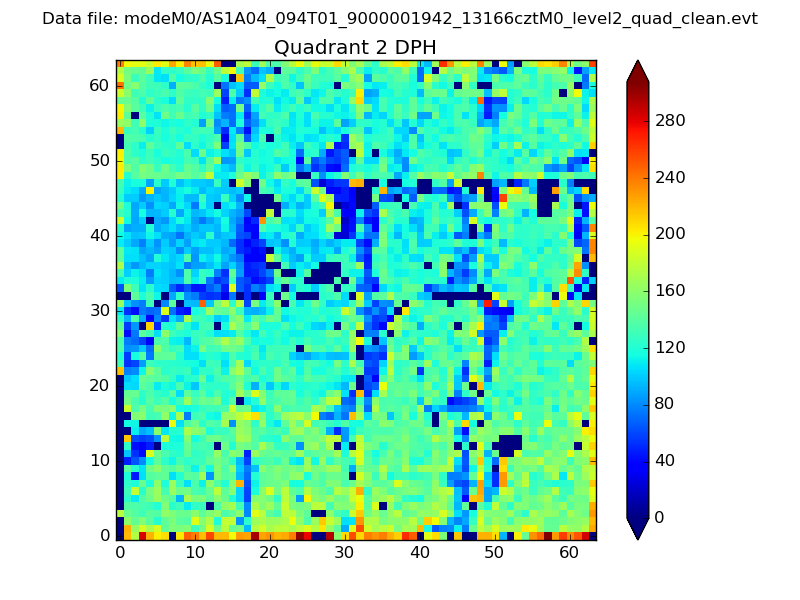
Histogram calculated using DETX and DETY for each event in the final _common_clean file
| Quadrant A | 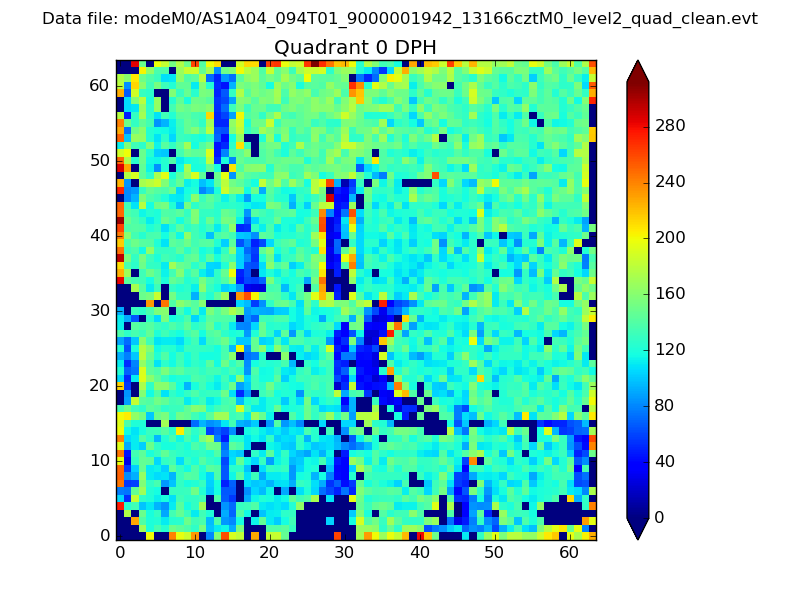 |
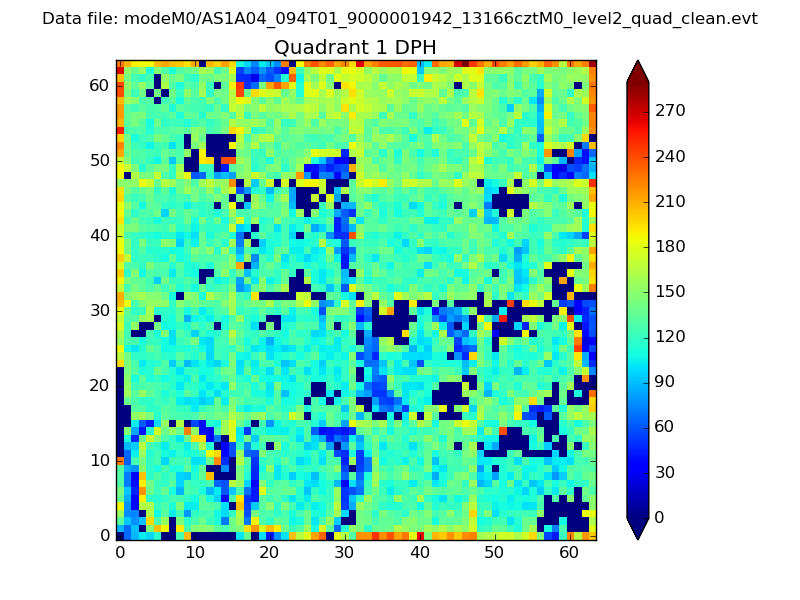 |
Quadrant B |
|---|---|---|---|
| Quadrant D | 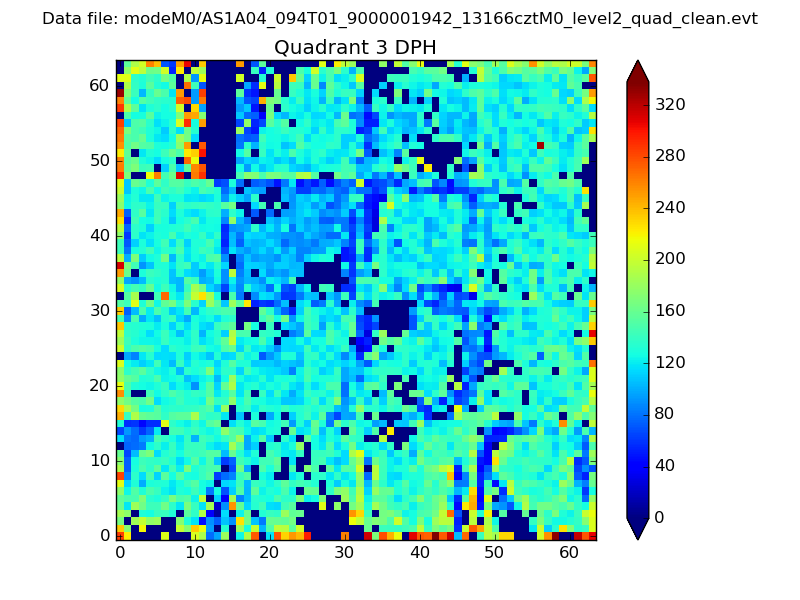 |
 |
Quadrant C |
| Plot type | Count rate plots | Images |
|---|---|---|
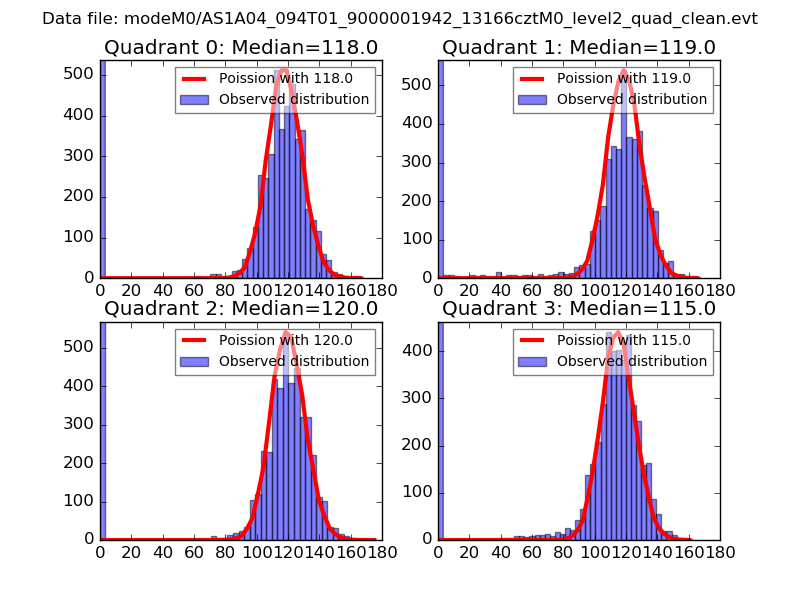
| Comparison with Poisson distribution Blue bars denote a histogram of data divided into 1 sec bins. Red curve is a Poisson curve with rate = median count rate of data. |
 |
 |
| Quadrant-wise count rates Data is divided into 100 sec bins |
 |
|
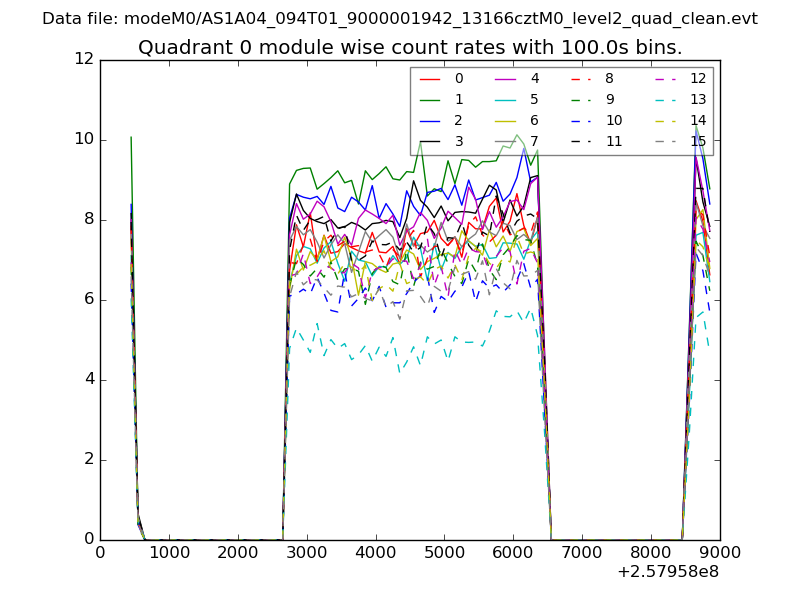
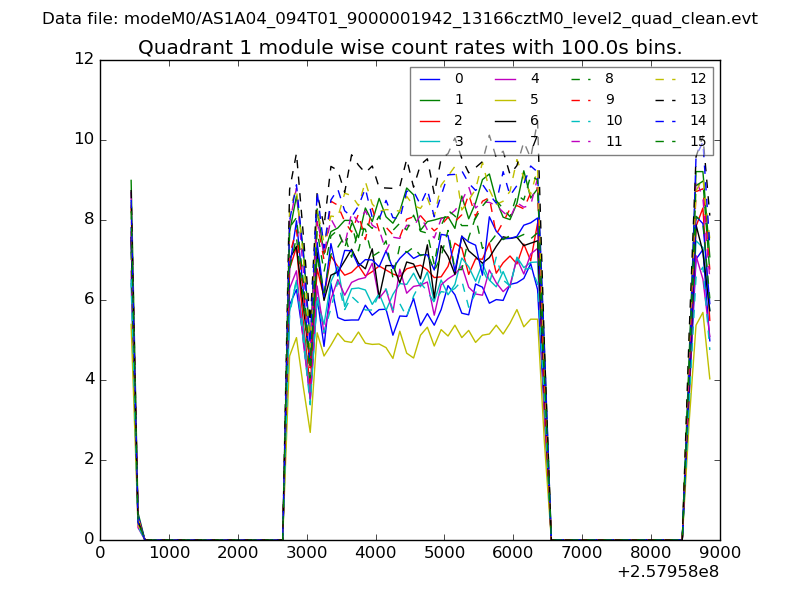
| Module-wise count rates for Quadrant A Data is divided into 100 sec bins |
 |
 |
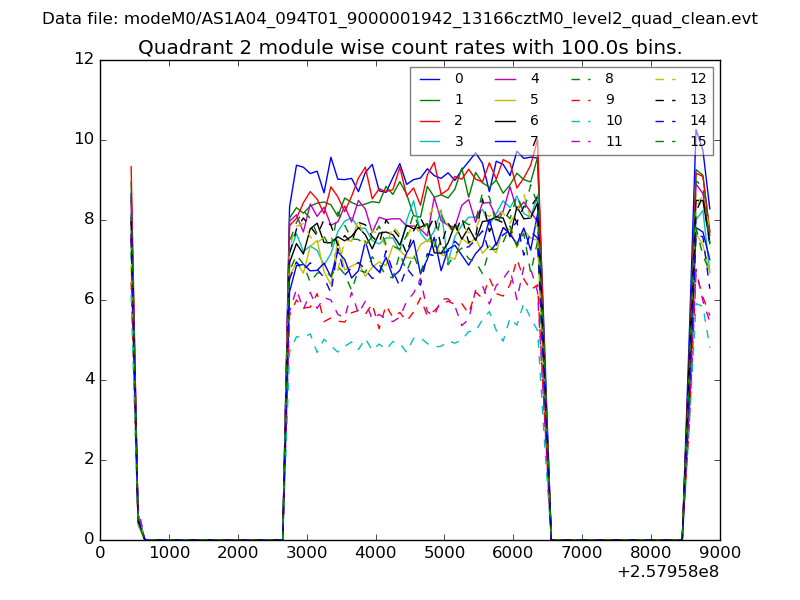
| Module-wise count rates for Quadrant B Data is divided into 100 sec bins |
 |
 |
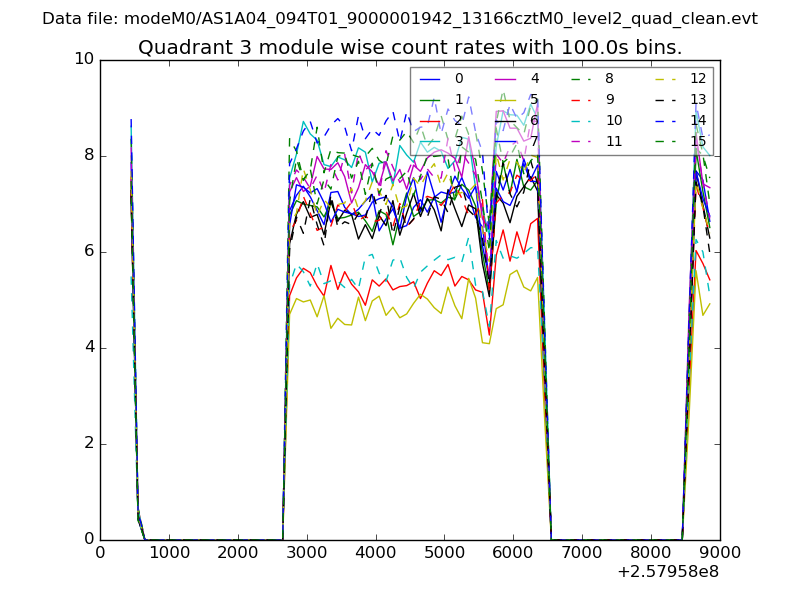
| Module-wise count rates for Quadrant C Data is divided into 100 sec bins |
 |
 |
| Module-wise count rates for Quadrant D Data is divided into 100 sec bins |
 |
 |
| Parameter | Plot |
|---|---|
| CZT HV Monitor | 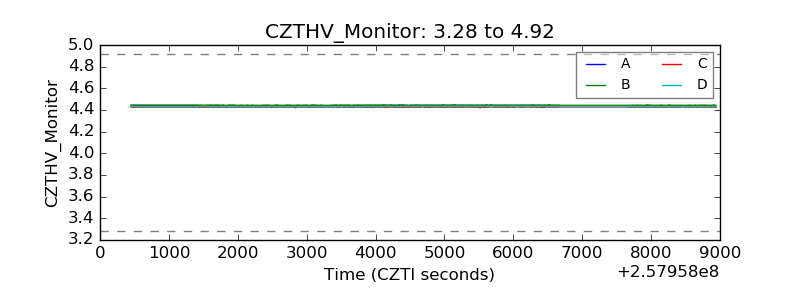 |
| D_VDD | 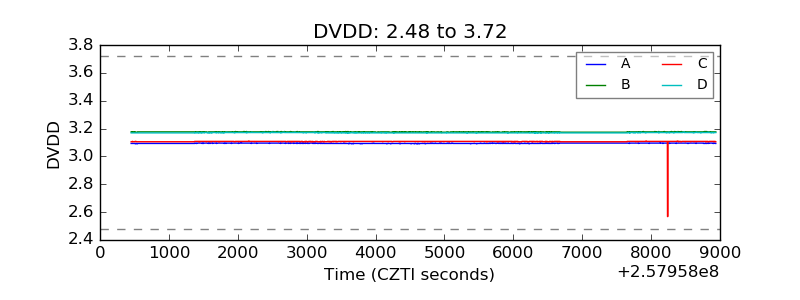 |
| Temperature 1 | 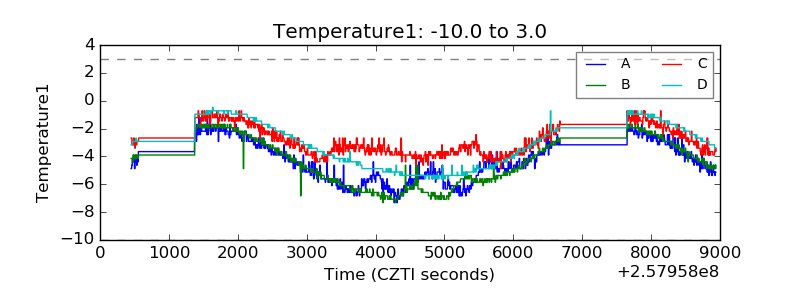 |
| Veto HV Monitor | 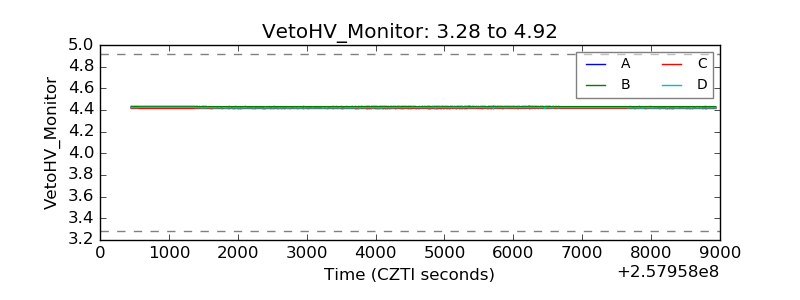 |
| Veto LLD | 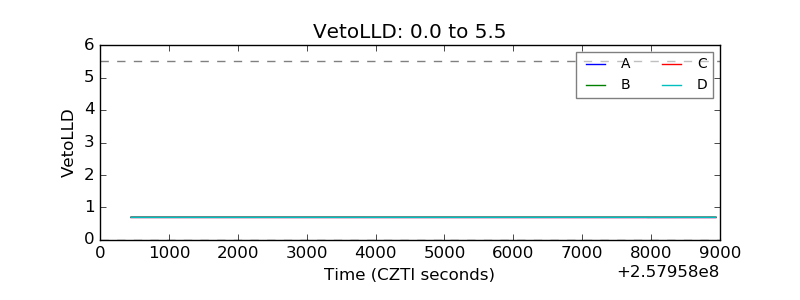 |
| Alpha Counter | 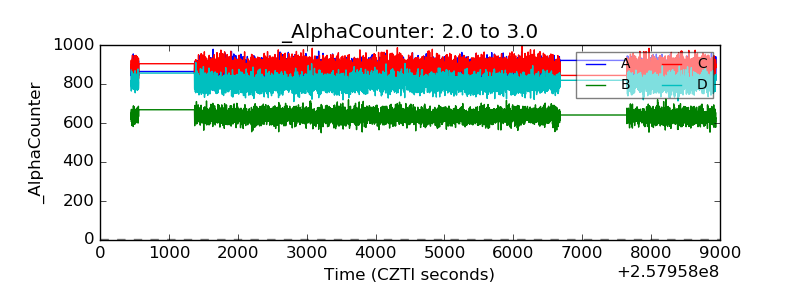 |
| _CPM_Rate | 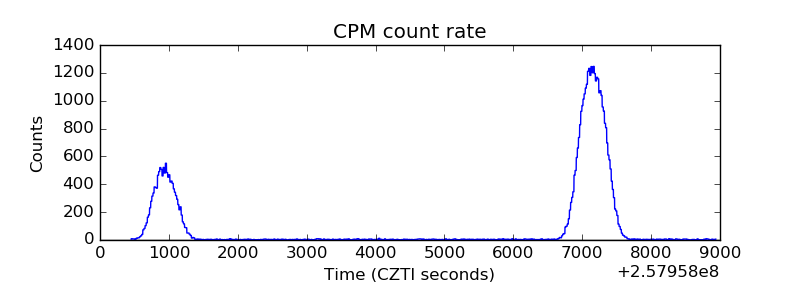 |
| CZT Counter | 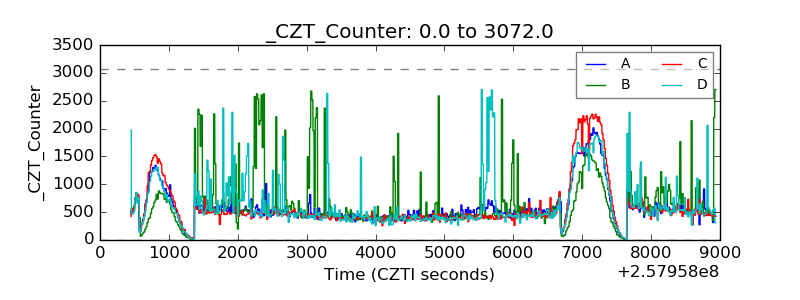 |
| +2.5 Volts monitor |  |
| +5 Volts monitor |  |
| _ROLL_ROT | 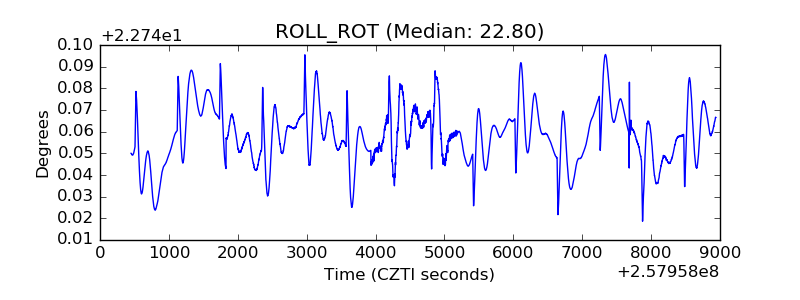 |
| _Roll_DEC | 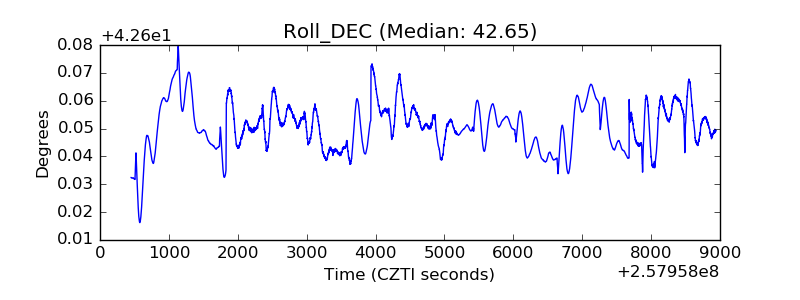 |
| _Roll_RA | 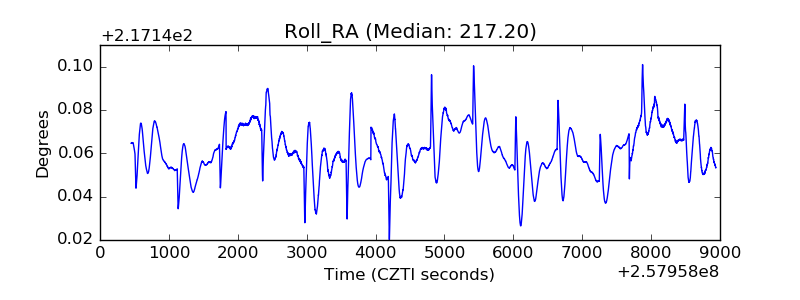 |
| Veto Counter | 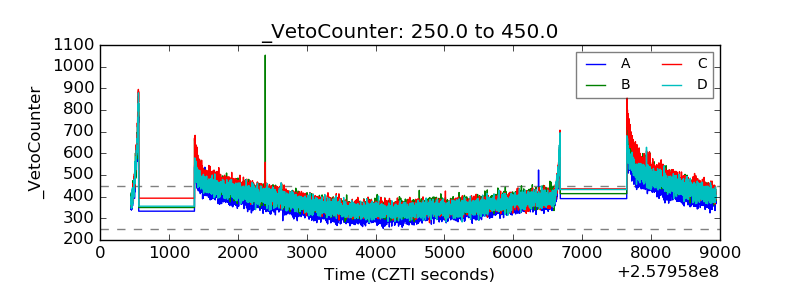 |