| Param | Original file | Final file |
|---|---|---|
| Filename | modeM0/AS1A04_094T01_9000001942_13168cztM0_level2.evt | modeM0/AS1A04_094T01_9000001942_13168cztM0_level2_quad_clean.evt |
| Size (bytes) | 465,209,280 | 86,215,680 |
| Size | 443.7 MB | 82.2 MB |
| Events in quadrant A | 3,327,835 | 539,594 |
| Events in quadrant B | 3,990,802 | 541,824 |
| Events in quadrant C | 2,998,146 | 556,088 |
| Events in quadrant D | 3,337,722 | 527,185 |
| Mode SS | |||
|---|---|---|---|
| Quadrant | BADHDUFLAG | Total packets | Discarded packets |
| A | 0 | 130 | 0 |
| B | 0 | 130 | 0 |
| C | 0 | 130 | 0 |
| D | 0 | 130 | 0 |
| Mode M9 | |||
|---|---|---|---|
| Quadrant | BADHDUFLAG | Total packets | Discarded packets |
| A | 0 | 12 | 0 |
| B | 0 | 12 | 0 |
| C | 0 | 12 | 0 |
| D | 0 | 13 | 0 |
| Mode M0 | |||
|---|---|---|---|
| Quadrant | BADHDUFLAG | Total packets | Discarded packets |
| A | 0 | 14041 | 3 |
| B | 0 | 16360 | 2 |
| C | 0 | 13336 | 2 |
| D | 0 | 14534 | 2 |
| Quadrant | Total seconds | Saturated seconds | Saturation percentage |
|---|---|---|---|
| A | 6393 | 94 | 1.470358% |
| B | 6393 | 297 | 4.645706% |
| C | 6393 | 44 | 0.688253% |
| D | 6393 | 120 | 1.877053% |
Noise dominated data is calculated using 1-second bins in cleaned event files. If a bin has >2000 counts, and if more than 50% of those come from <1% of pixels, then it is considered to be noise-dominated and hence unusable.
| Quadrant | # 1 sec bins | Bins with >0 counts | Bins with >2000 counts | High rate bins dominated by noise | Noise dominated (total time) | Noise dominated (detector-on time) | Marked lightcurve |
|---|---|---|---|---|---|---|---|
| A | 7494 | 6395 | 35 | 35 | 0.47% | 0.55% | 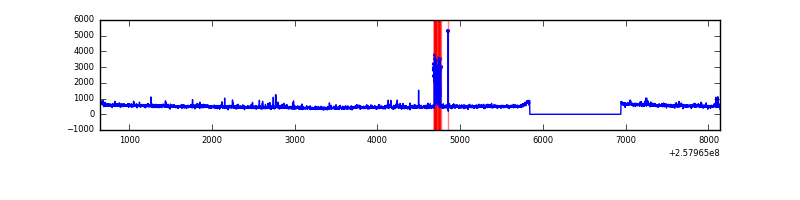 |
| B | 7494 | 6395 | 163 | 163 | 2.18% | 2.55% | 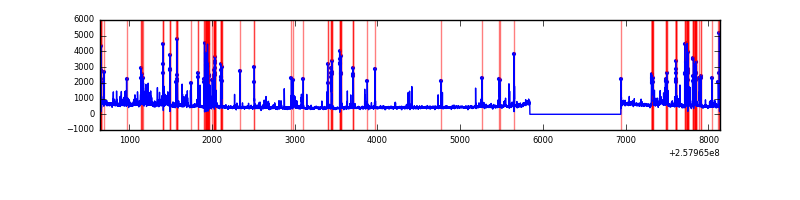 |
| C | 7494 | 6395 | 0 | 0 | 0.00% | 0.00% | 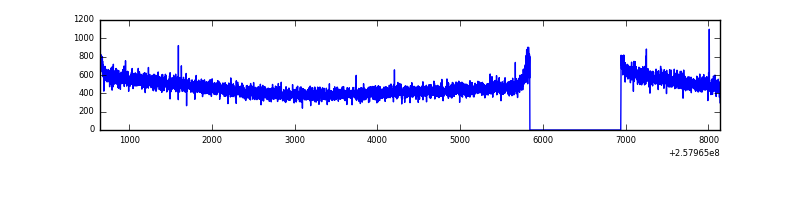 |
| D | 7494 | 6395 | 53 | 53 | 0.71% | 0.83% | 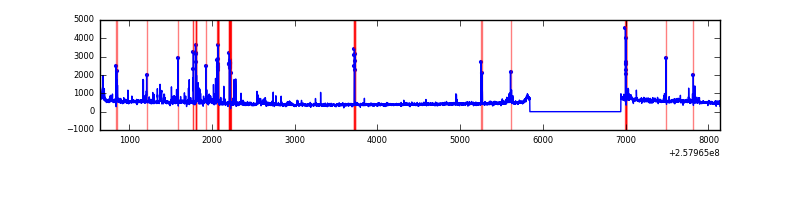 |
Top three noisy pixels from each quadrant. If the there are fewer than three noisy pixels in the level2.evt file, extra rows are filled as -1
| Pixel properties | Quadrant properties | ||||||
|---|---|---|---|---|---|---|---|
| Quadrant | DetID | PixID | Counts | Sigma | Mean | Median | Sigma |
| A | 4 | 2 | 142078 | 894.2 | 775 | 757 | 158.0 |
| A | 12 | 189 | 93311 | 585.63 | 775 | 757 | 158.0 |
| A | 1 | 162 | 36534 | 226.38 | 775 | 757 | 158.0 |
| B | 4 | 239 | 805546 | 5482.95 | 769 | 749 | 146.8 |
| B | 0 | 189 | 53713 | 360.83 | 769 | 749 | 146.8 |
| B | 5 | 32 | 39941 | 267.01 | 769 | 749 | 146.8 |
| C | 13 | 61 | 5711 | 27.89 | 768 | 773 | 177.0 |
| C | 15 | 208 | 3813 | 17.17 | 768 | 773 | 177.0 |
| C | 8 | 222 | 1956 | 6.68 | 768 | 773 | 177.0 |
| D | 1 | 52 | 233751 | 1269.12 | 757 | 736 | 183.6 |
| D | 10 | 157 | 155934 | 845.29 | 757 | 736 | 183.6 |
| D | 14 | 34 | 40449 | 216.3 | 757 | 736 | 183.6 |
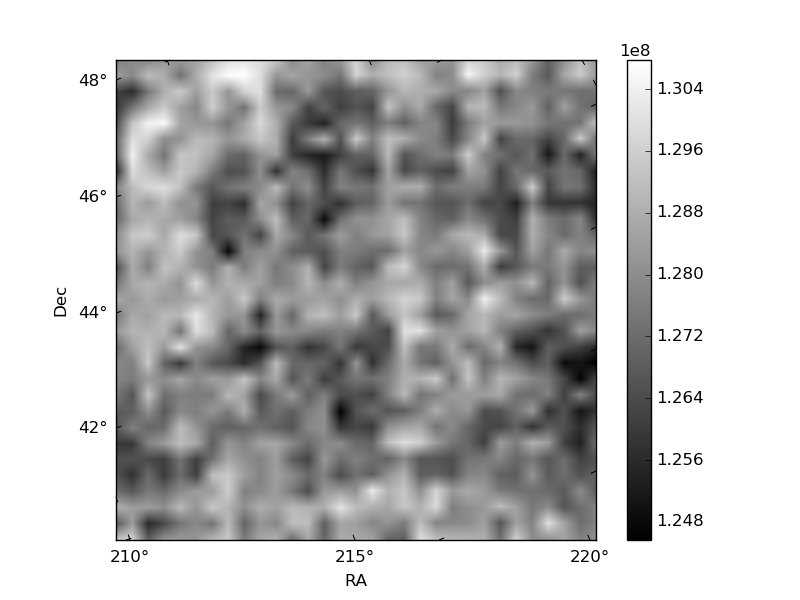
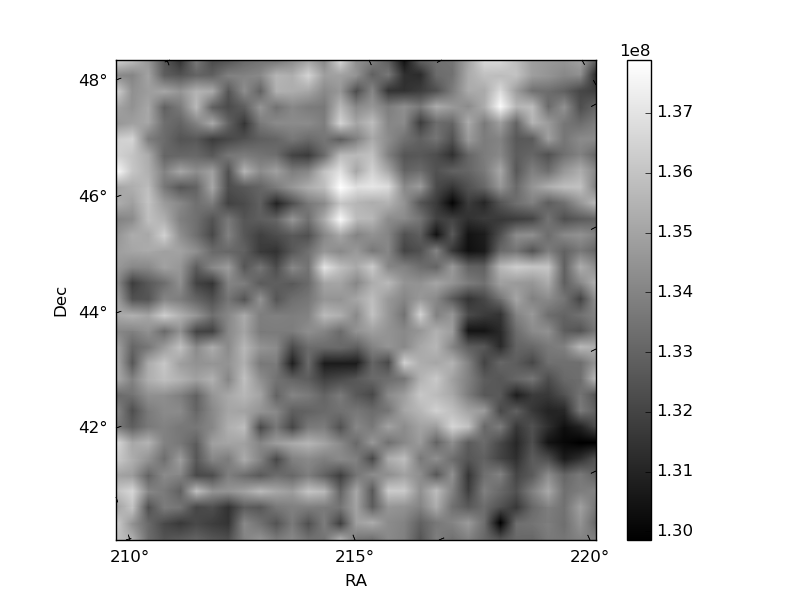
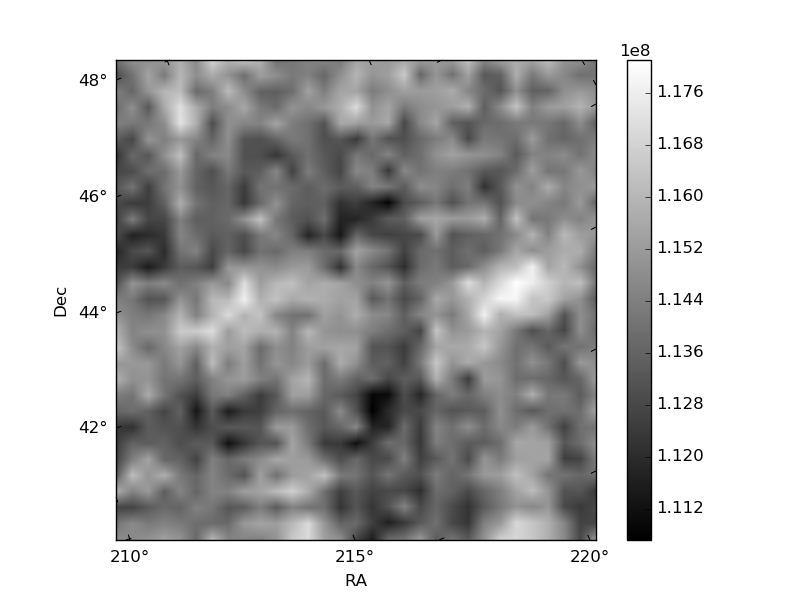
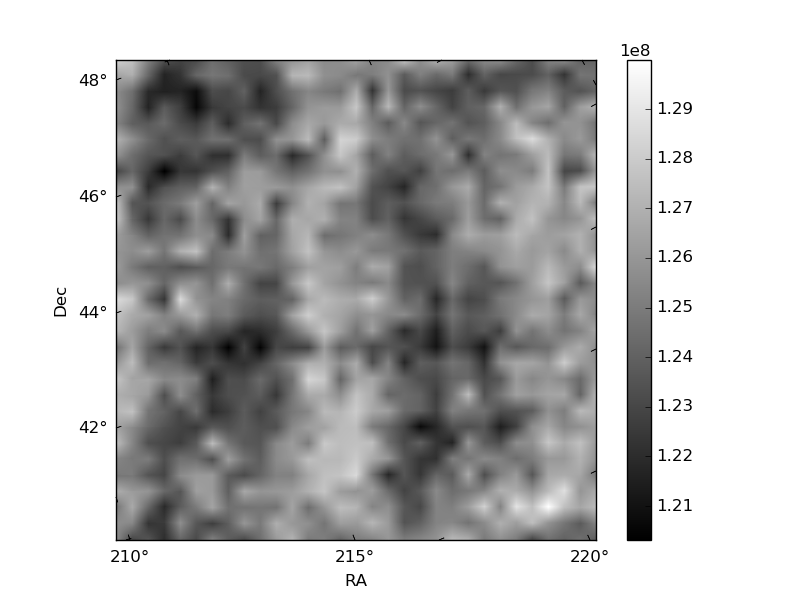
Histogram calculated using DETX and DETY for each event in the final _common_clean file
| Quadrant A | 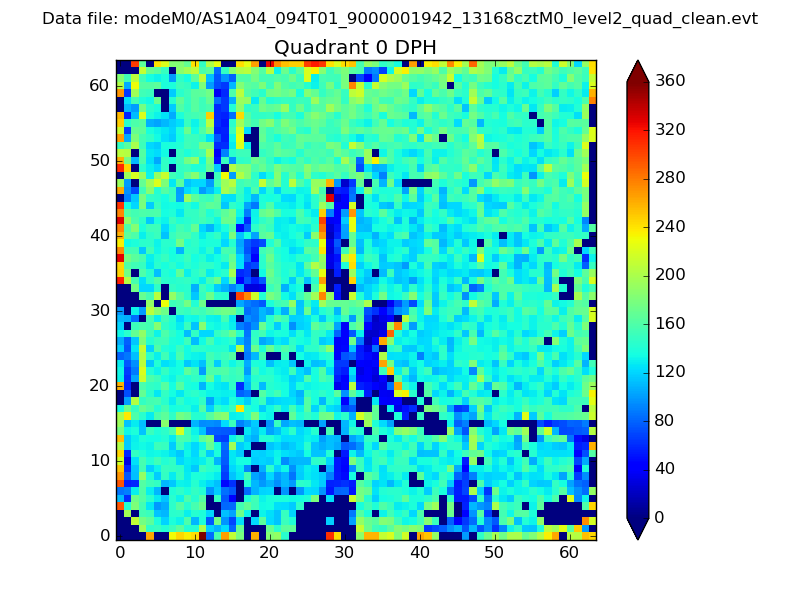 |
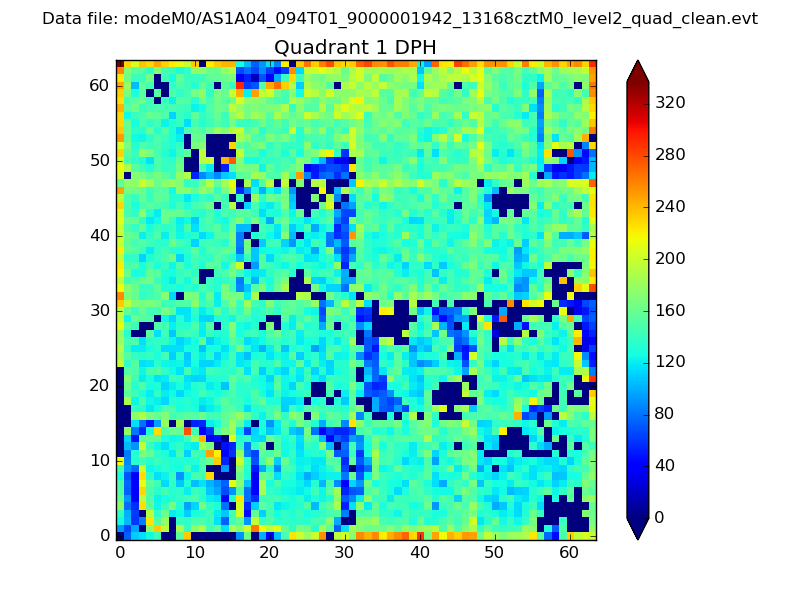 |
Quadrant B |
|---|---|---|---|
| Quadrant D | 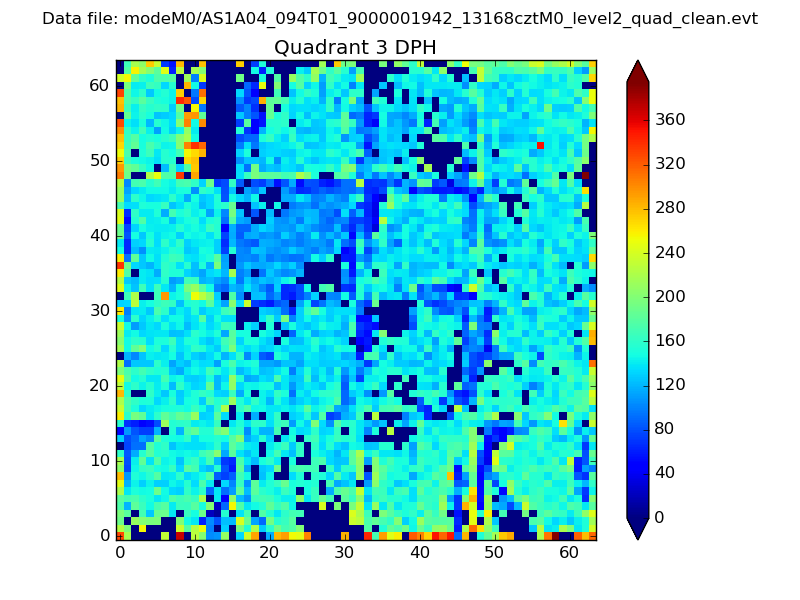 |
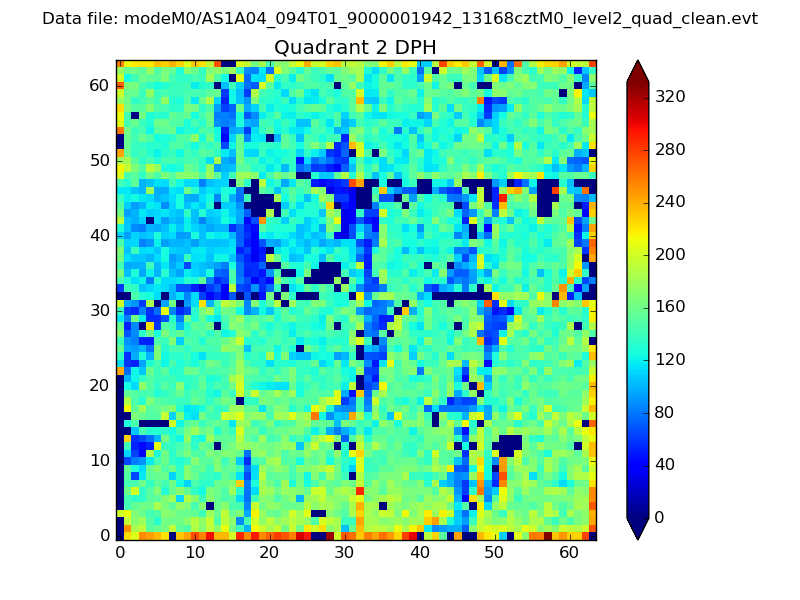 |
Quadrant C |
| Plot type | Count rate plots | Images |
|---|---|---|
| Comparison with Poisson distribution Blue bars denote a histogram of data divided into 1 sec bins. Red curve is a Poisson curve with rate = median count rate of data. |
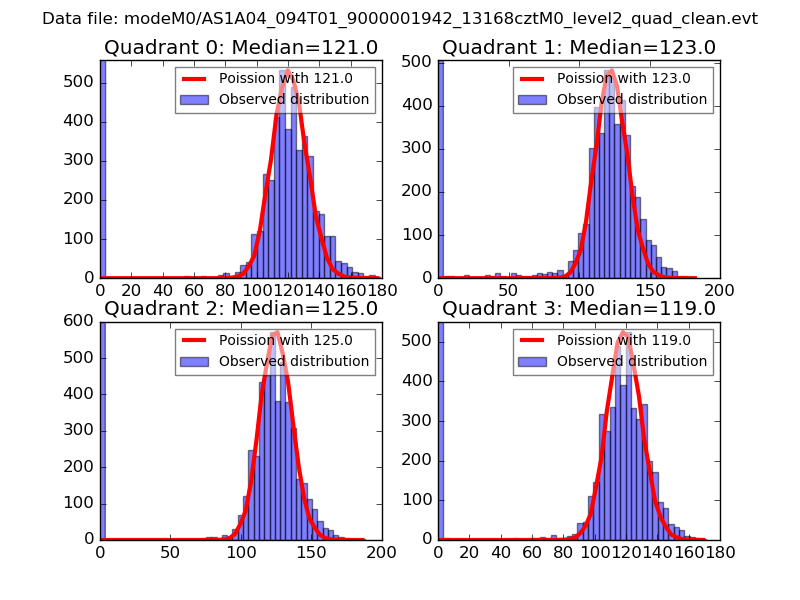 |
 |
| Quadrant-wise count rates Data is divided into 100 sec bins |
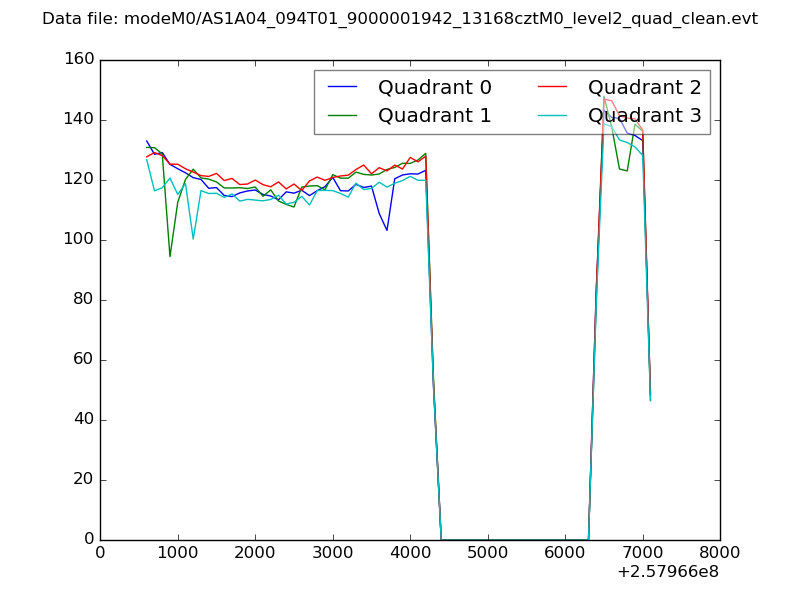 |
|
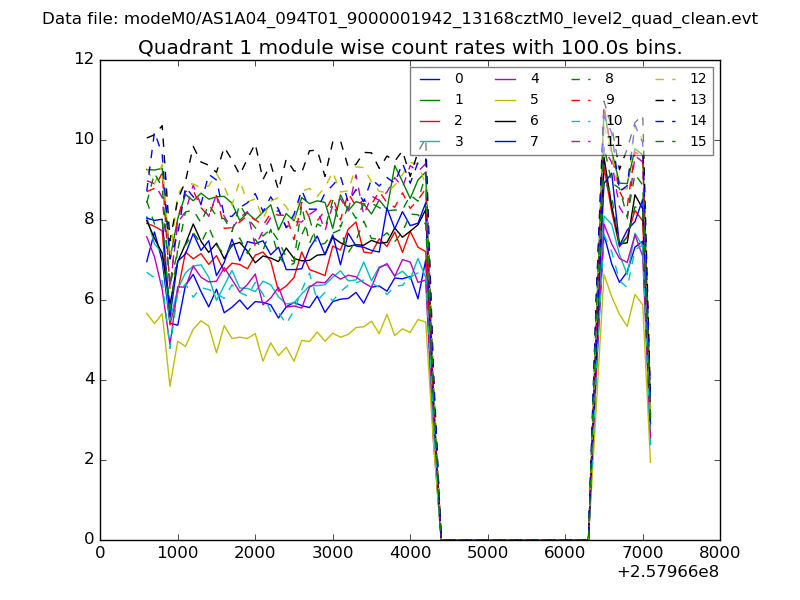
| Module-wise count rates for Quadrant A Data is divided into 100 sec bins |
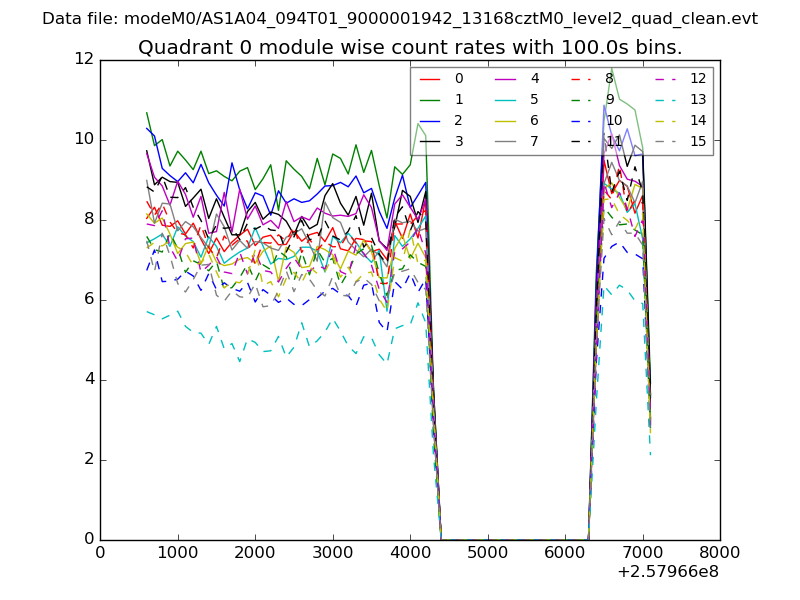 |
 |
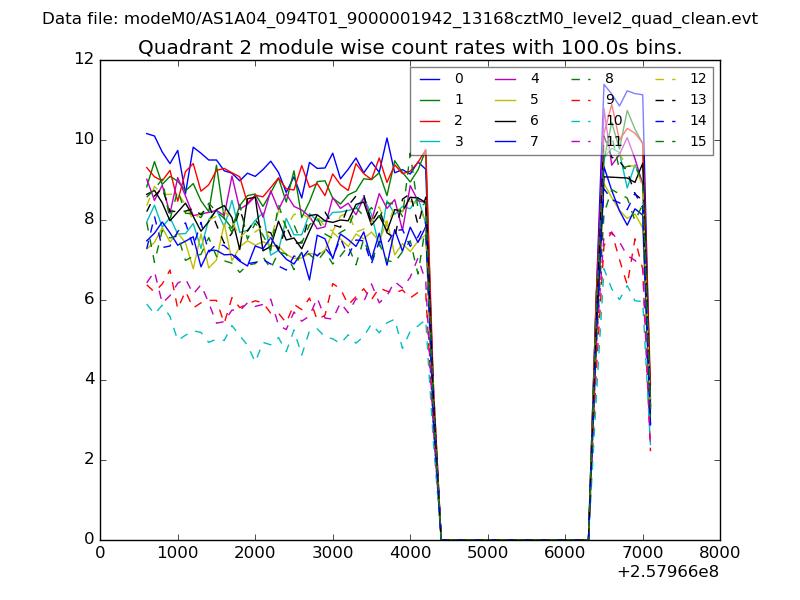
| Module-wise count rates for Quadrant B Data is divided into 100 sec bins |
 |
 |
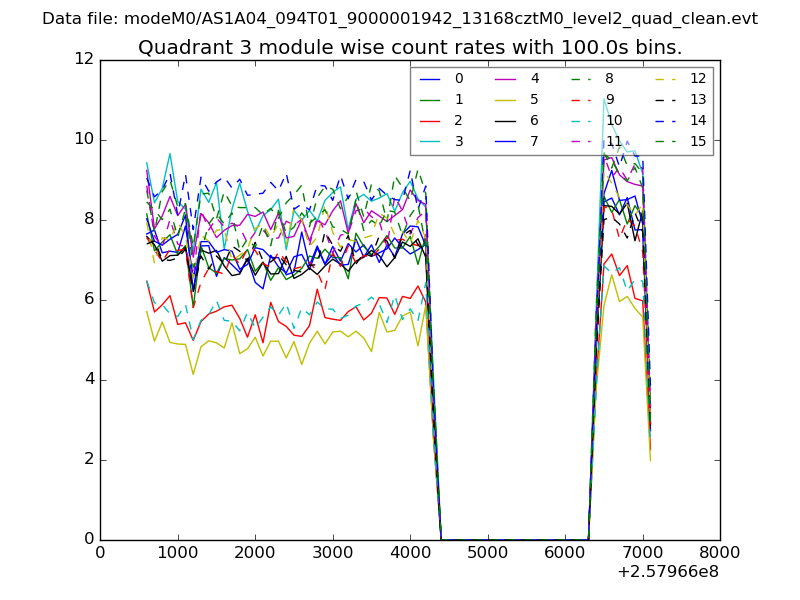
| Module-wise count rates for Quadrant C Data is divided into 100 sec bins |
 |
 |
| Module-wise count rates for Quadrant D Data is divided into 100 sec bins |
 |
 |
| Parameter | Plot |
|---|---|
| CZT HV Monitor | 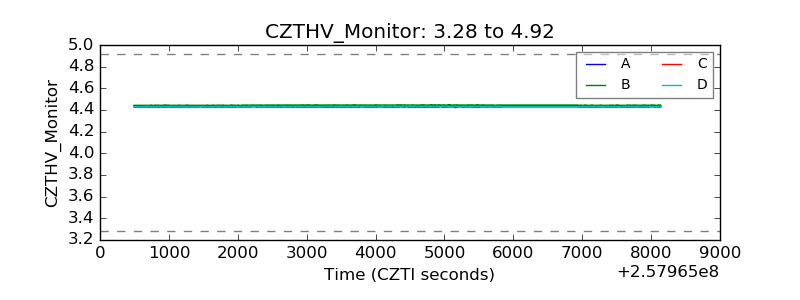 |
| D_VDD | 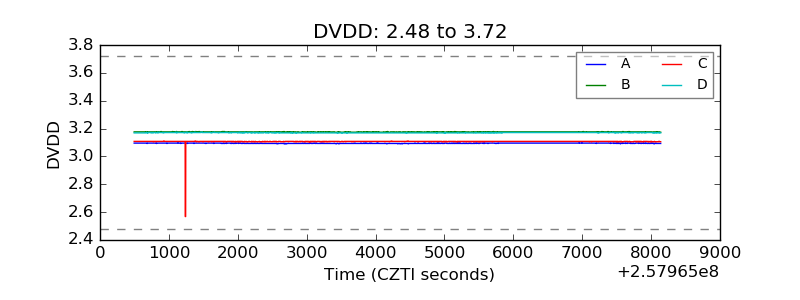 |
| Temperature 1 | 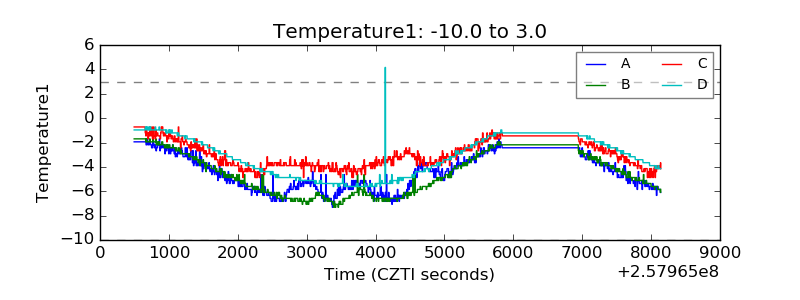 |
| Veto HV Monitor | 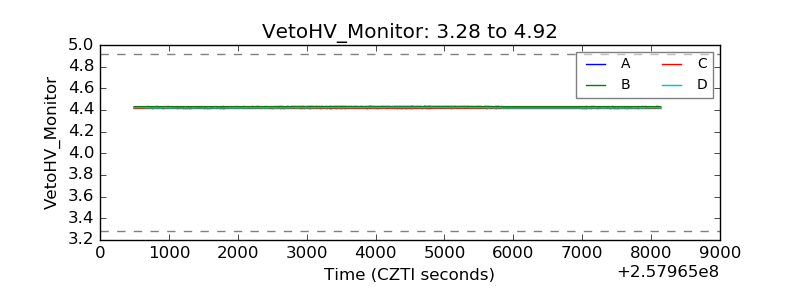 |
| Veto LLD | 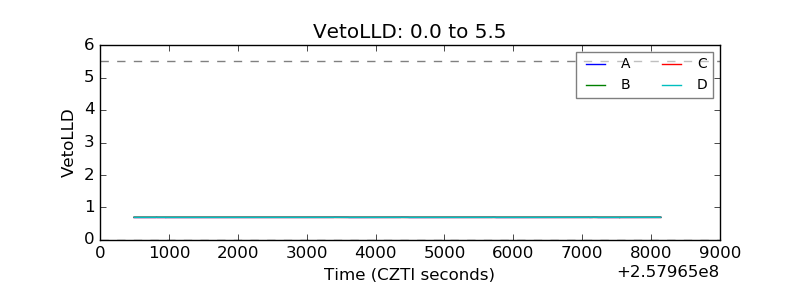 |
| Alpha Counter | 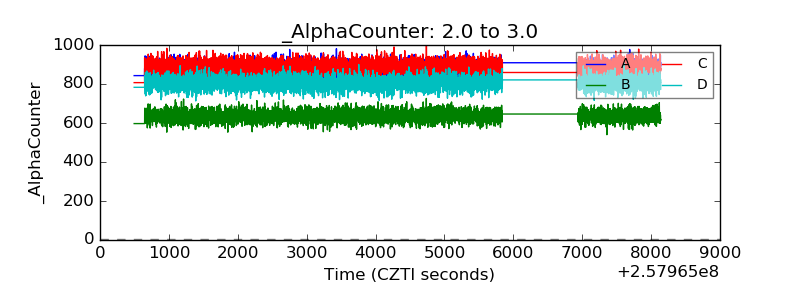 |
| _CPM_Rate | 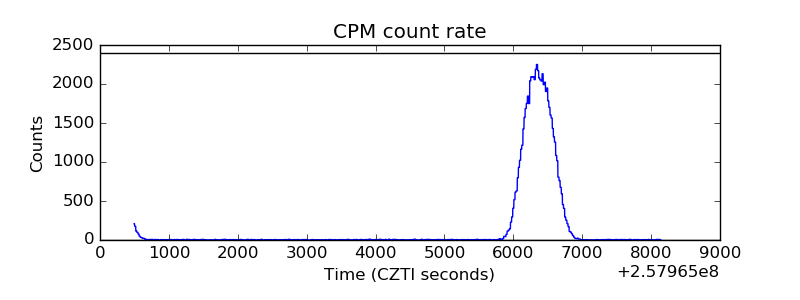 |
| CZT Counter | 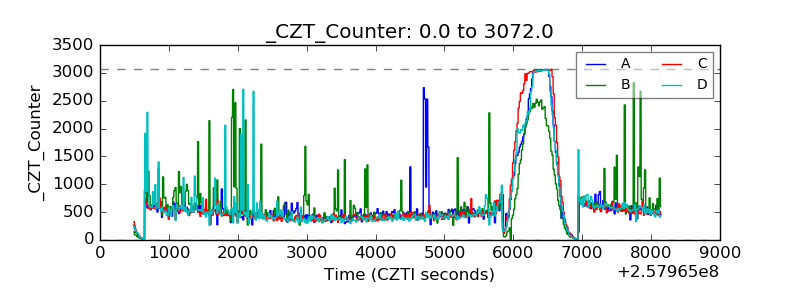 |
| +2.5 Volts monitor |  |
| +5 Volts monitor |  |
| _ROLL_ROT | 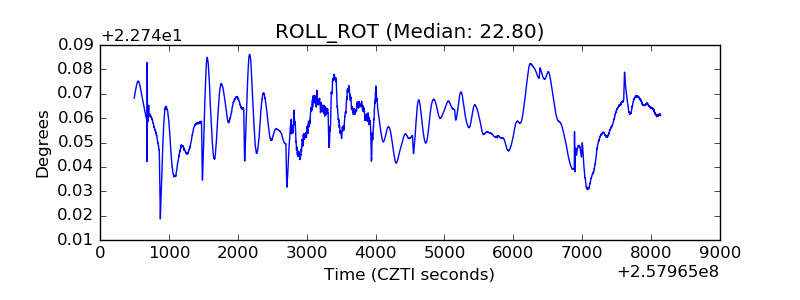 |
| _Roll_DEC | 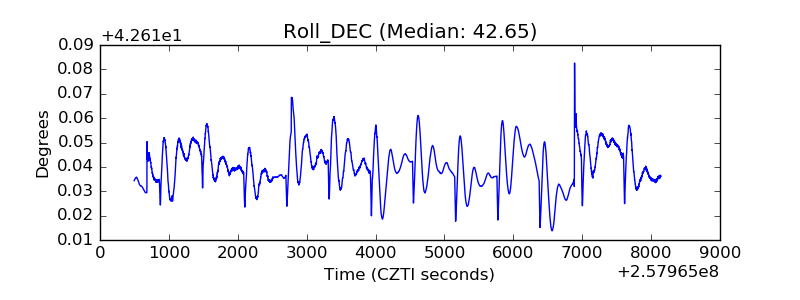 |
| _Roll_RA | 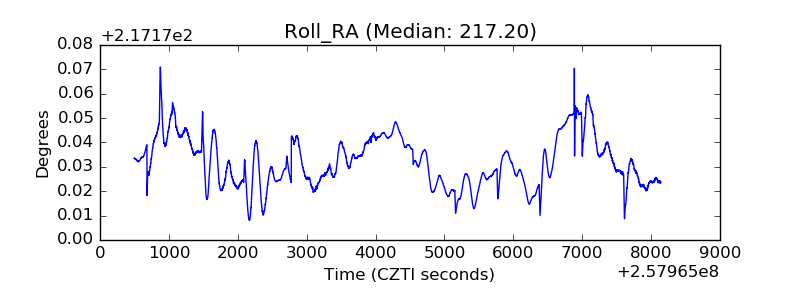 |
| Veto Counter | 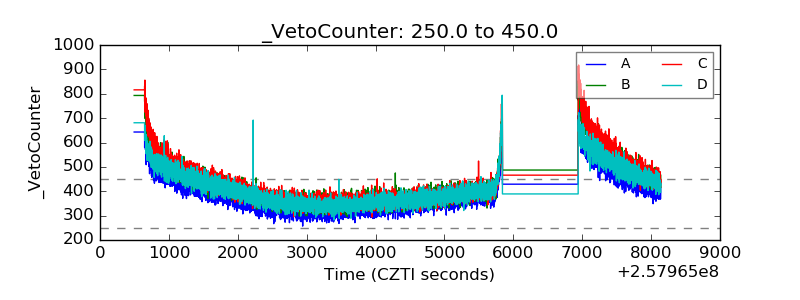 |