| Param | Original file | Final file |
|---|---|---|
| Filename | modeM0/AS1A04_094T01_9000001942_13170cztM0_level2.evt | modeM0/AS1A04_094T01_9000001942_13170cztM0_level2_quad_clean.evt |
| Size (bytes) | 98,680,320 | 24,192,000 |
| Size | 94.1 MB | 23.1 MB |
| Events in quadrant A | 656,021 | 160,777 |
| Events in quadrant B | 770,138 | 166,477 |
| Events in quadrant C | 642,994 | 165,248 |
| Events in quadrant D | 838,553 | 152,497 |
| Mode SS | |||
|---|---|---|---|
| Quadrant | BADHDUFLAG | Total packets | Discarded packets |
| A | 0 | 22 | 0 |
| B | 0 | 22 | 0 |
| C | 0 | 22 | 0 |
| D | 0 | 22 | 0 |
| Mode M9 | |||
|---|---|---|---|
| Quadrant | BADHDUFLAG | Total packets | Discarded packets |
| A | 0 | 3 | 0 |
| B | 0 | 3 | 0 |
| C | 0 | 3 | 0 |
| D | 0 | 4 | 0 |
| Mode M0 | |||
|---|---|---|---|
| Quadrant | BADHDUFLAG | Total packets | Discarded packets |
| A | 0 | 2704 | 1 |
| B | 0 | 3043 | 1 |
| C | 0 | 2633 | 1 |
| D | 0 | 3281 | 1 |
| Quadrant | Total seconds | Saturated seconds | Saturation percentage |
|---|---|---|---|
| A | 1151 | 3 | 0.260643% |
| B | 1151 | 25 | 2.172024% |
| C | 1151 | 4 | 0.347524% |
| D | 1151 | 35 | 3.040834% |
Noise dominated data is calculated using 1-second bins in cleaned event files. If a bin has >2000 counts, and if more than 50% of those come from <1% of pixels, then it is considered to be noise-dominated and hence unusable.
| Quadrant | # 1 sec bins | Bins with >0 counts | Bins with >2000 counts | High rate bins dominated by noise | Noise dominated (total time) | Noise dominated (detector-on time) | Marked lightcurve |
|---|---|---|---|---|---|---|---|
| A | 1152 | 1152 | 0 | 0 | 0.00% | 0.00% | 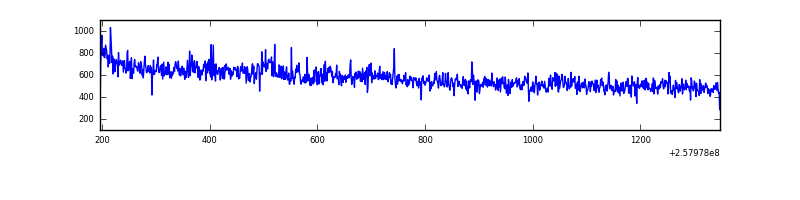 |
| B | 1152 | 1152 | 8 | 8 | 0.69% | 0.69% | 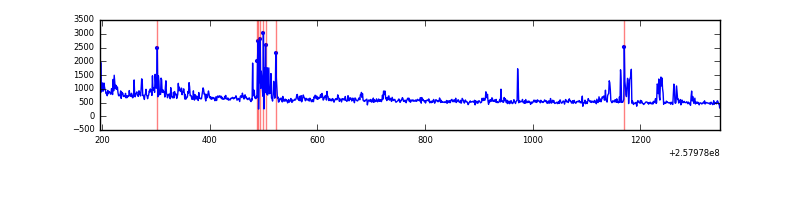 |
| C | 1152 | 1152 | 0 | 0 | 0.00% | 0.00% | 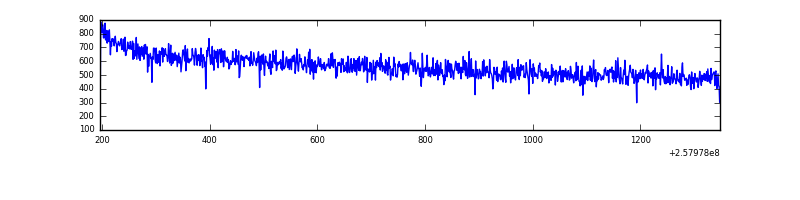 |
| D | 1152 | 1152 | 18 | 18 | 1.56% | 1.56% | 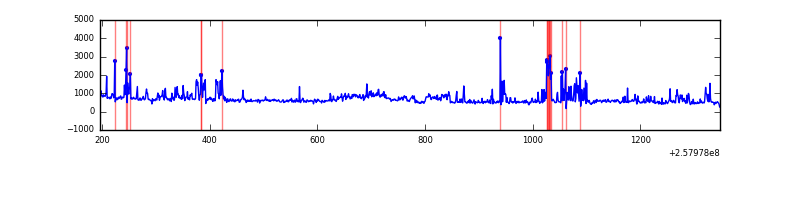 |
Top three noisy pixels from each quadrant. If the there are fewer than three noisy pixels in the level2.evt file, extra rows are filled as -1
| Pixel properties | Quadrant properties | ||||||
|---|---|---|---|---|---|---|---|
| Quadrant | DetID | PixID | Counts | Sigma | Mean | Median | Sigma |
| A | 12 | 189 | 26890 | 781.14 | 161 | 157 | 34.2 |
| A | 8 | 15 | 4642 | 131.05 | 161 | 157 | 34.2 |
| A | 0 | 23 | 2171 | 58.85 | 161 | 157 | 34.2 |
| B | 4 | 239 | 88174 | 2738.37 | 164 | 161 | 32.1 |
| B | 3 | 64 | 11297 | 346.48 | 164 | 161 | 32.1 |
| B | 3 | 209 | 7851 | 239.26 | 164 | 161 | 32.1 |
| C | 15 | 208 | 1616 | 36.86 | 164 | 166 | 39.3 |
| C | 13 | 61 | 1152 | 25.06 | 164 | 166 | 39.3 |
| C | 3 | 202 | 371 | 5.21 | 164 | 166 | 39.3 |
| D | 1 | 52 | 162952 | 4114.69 | 158 | 153 | 39.6 |
| D | 14 | 34 | 68241 | 1720.9 | 158 | 153 | 39.6 |
| D | 8 | 195 | 6630 | 163.7 | 158 | 153 | 39.6 |
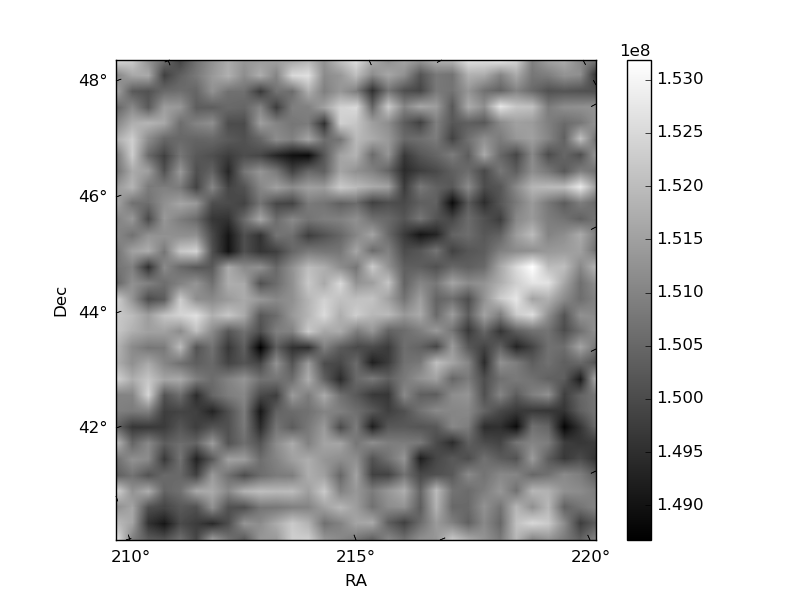
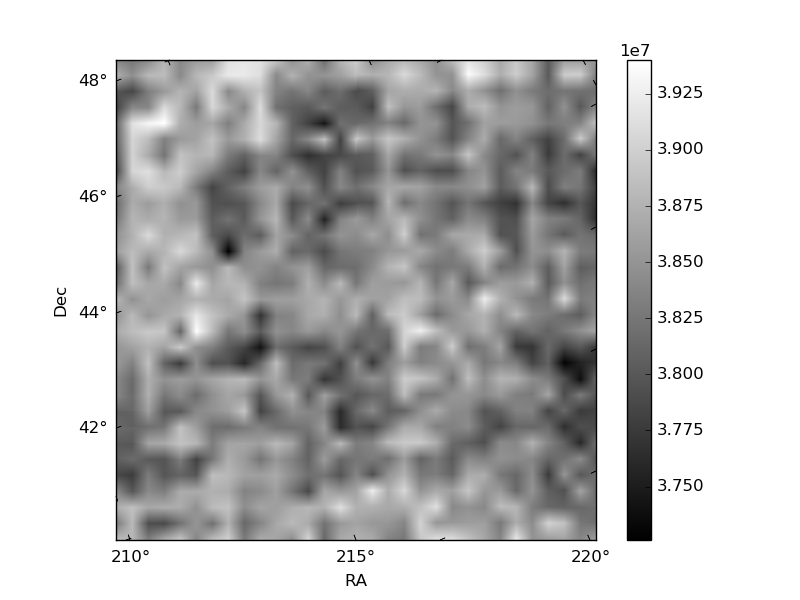
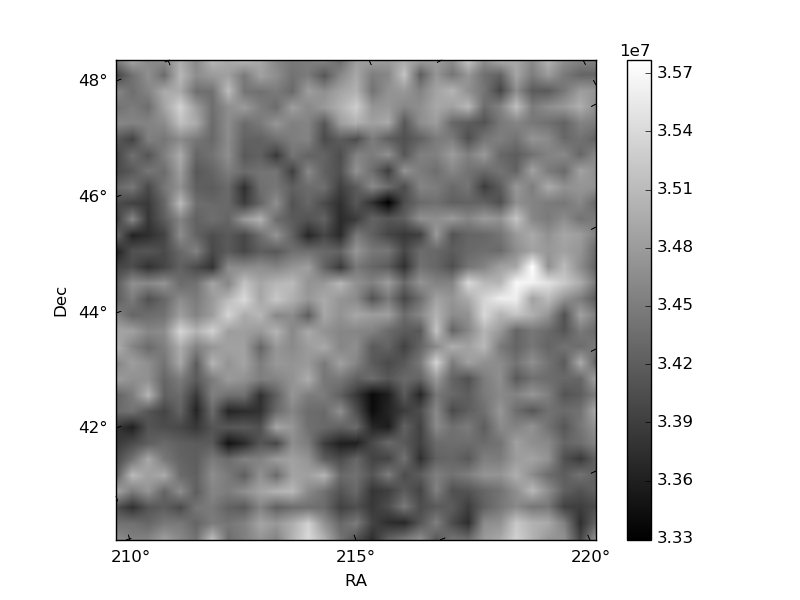
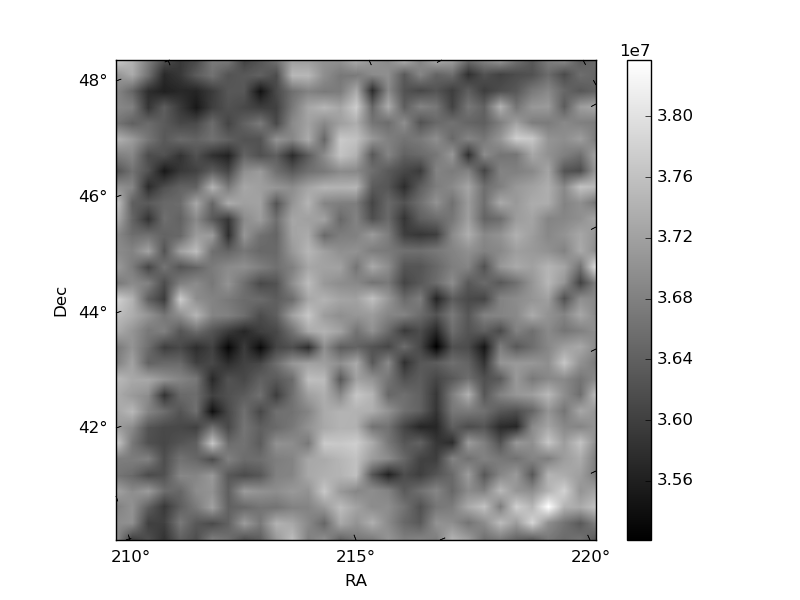
Histogram calculated using DETX and DETY for each event in the final _common_clean file
| Quadrant A | 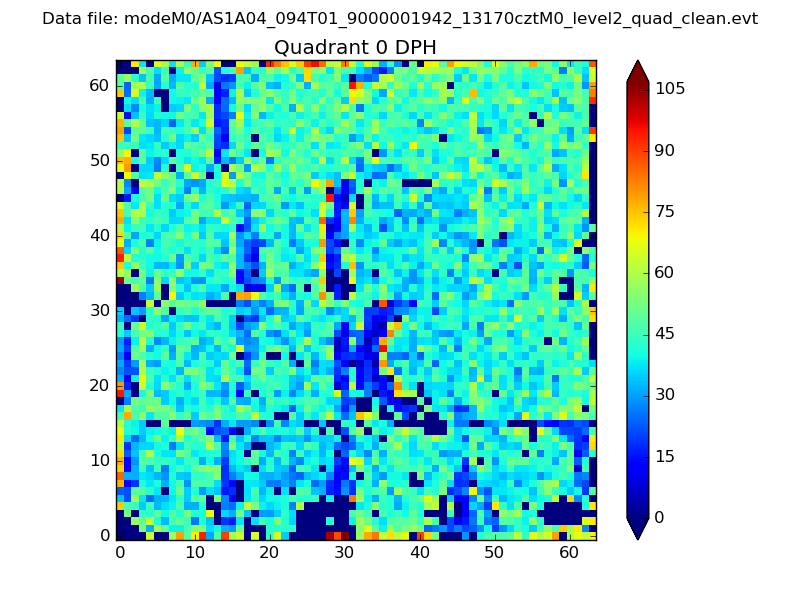 |
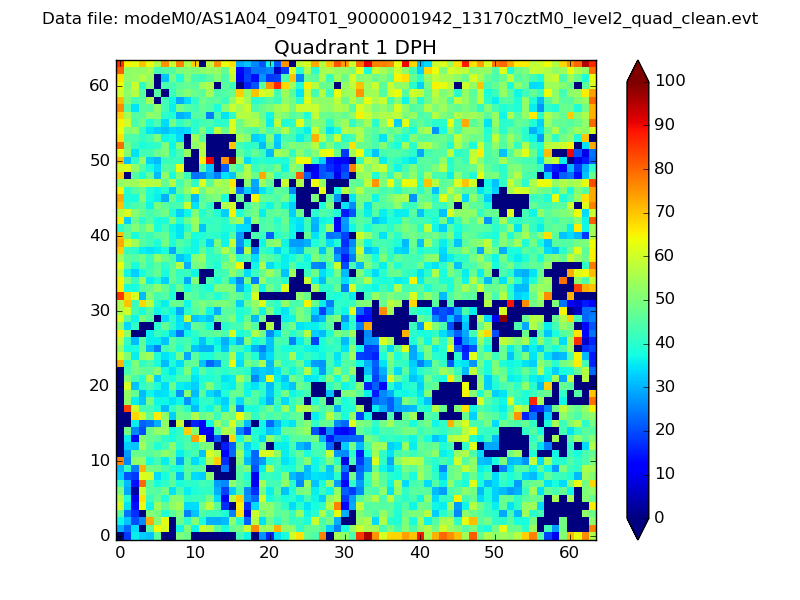 |
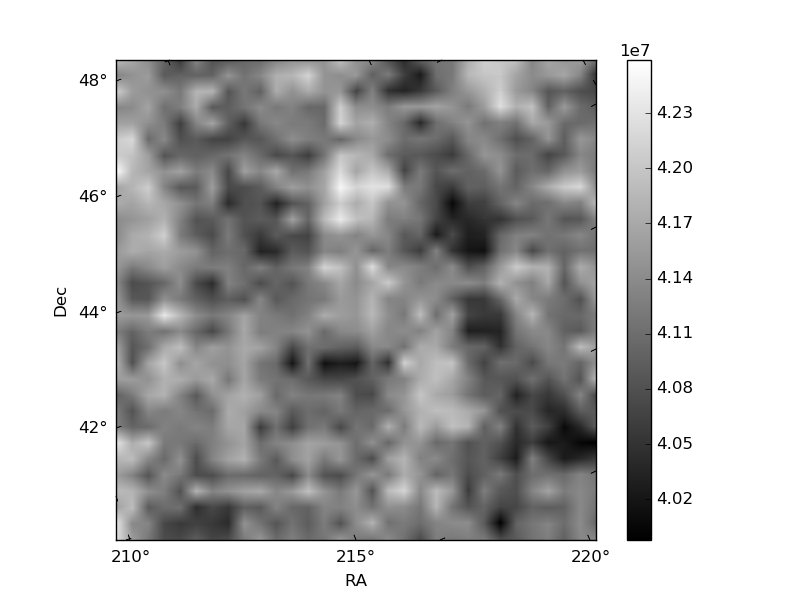
Quadrant B |
|---|---|---|---|
| Quadrant D | 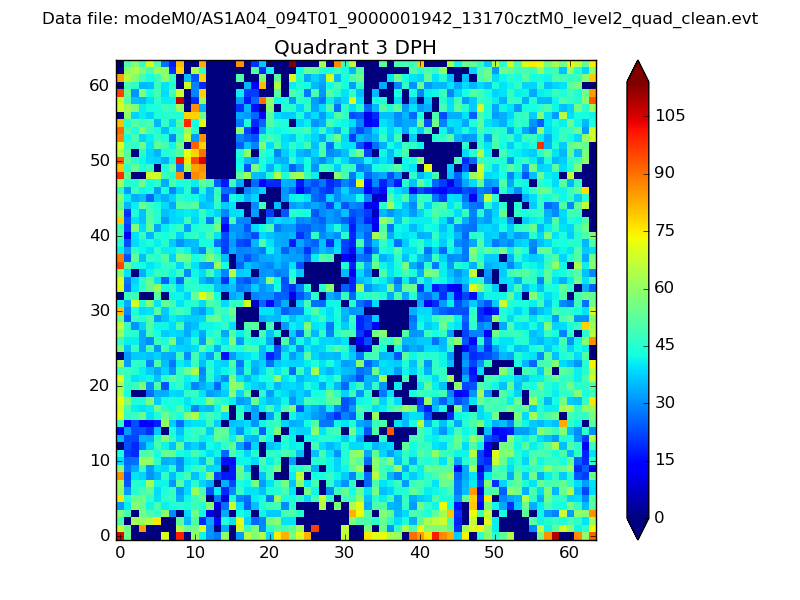 |
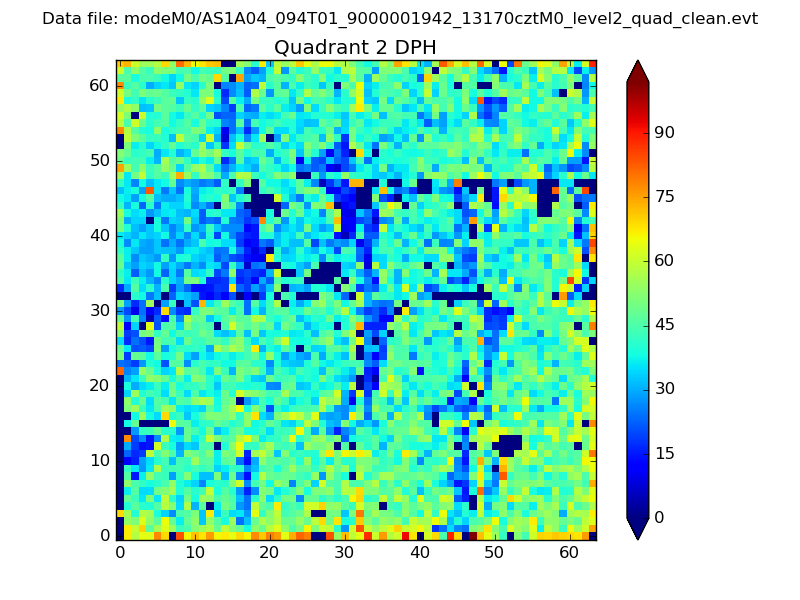 |
Quadrant C |
| Plot type | Count rate plots | Images |
|---|---|---|
| Comparison with Poisson distribution Blue bars denote a histogram of data divided into 1 sec bins. Red curve is a Poisson curve with rate = median count rate of data. |
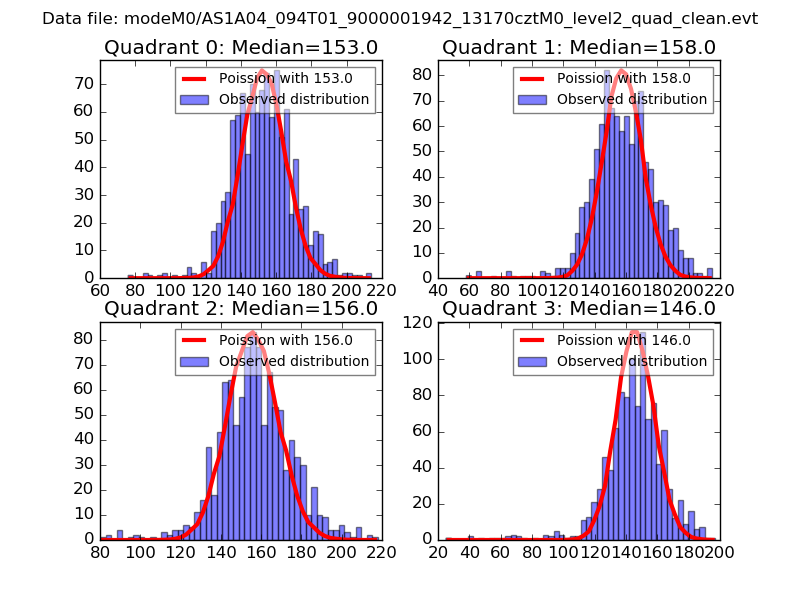 |
 |
| Quadrant-wise count rates Data is divided into 100 sec bins |
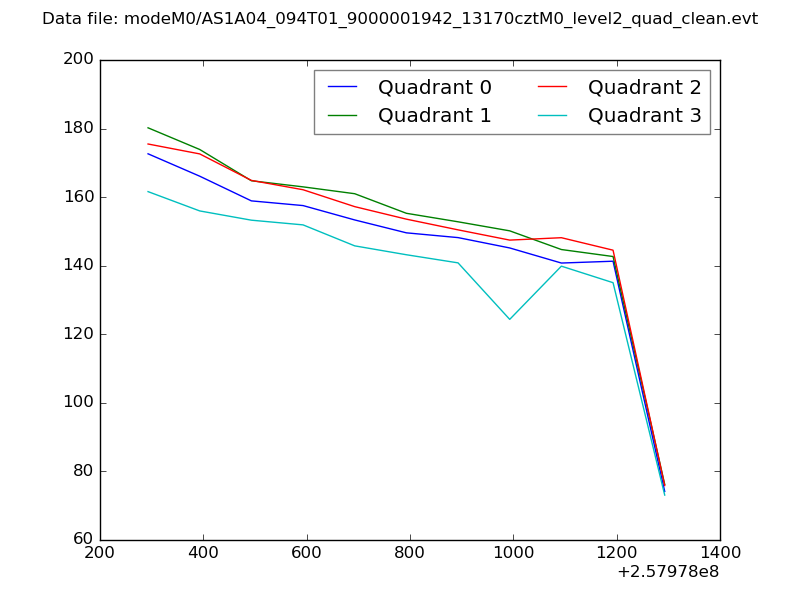 |
|
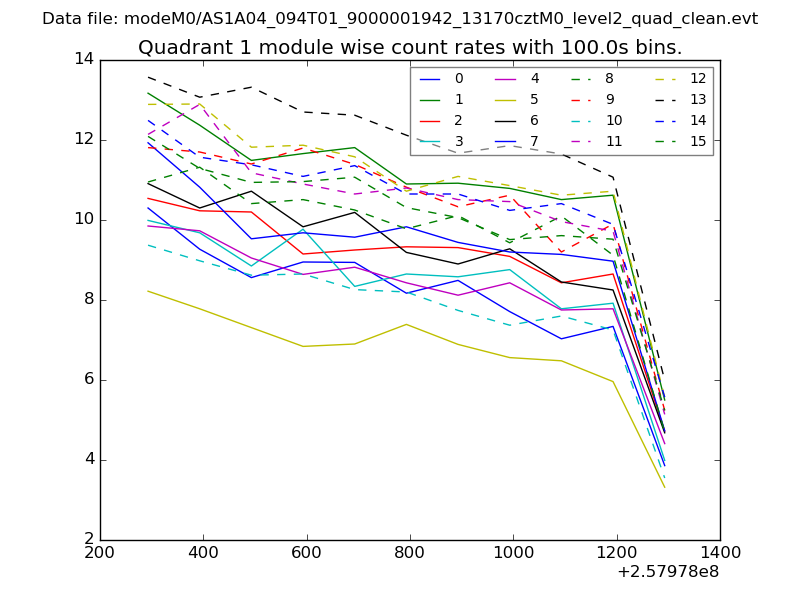
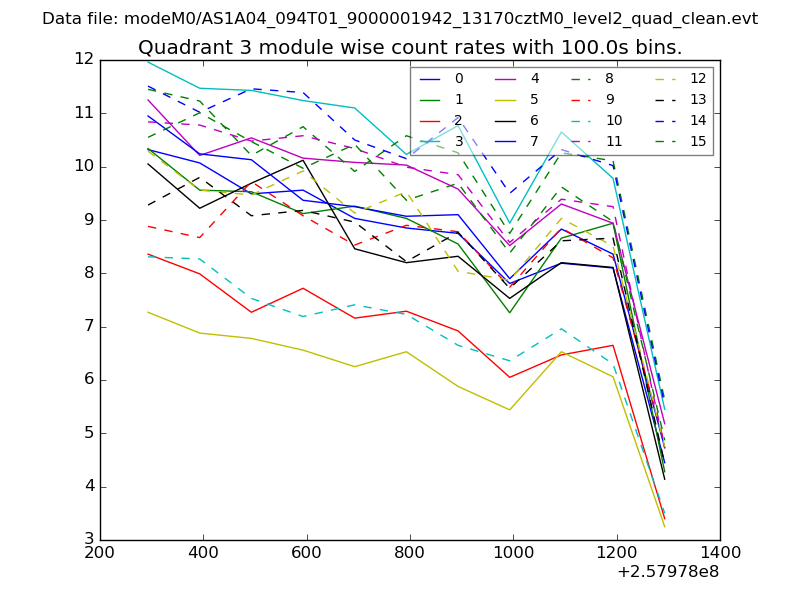
| Module-wise count rates for Quadrant A Data is divided into 100 sec bins |
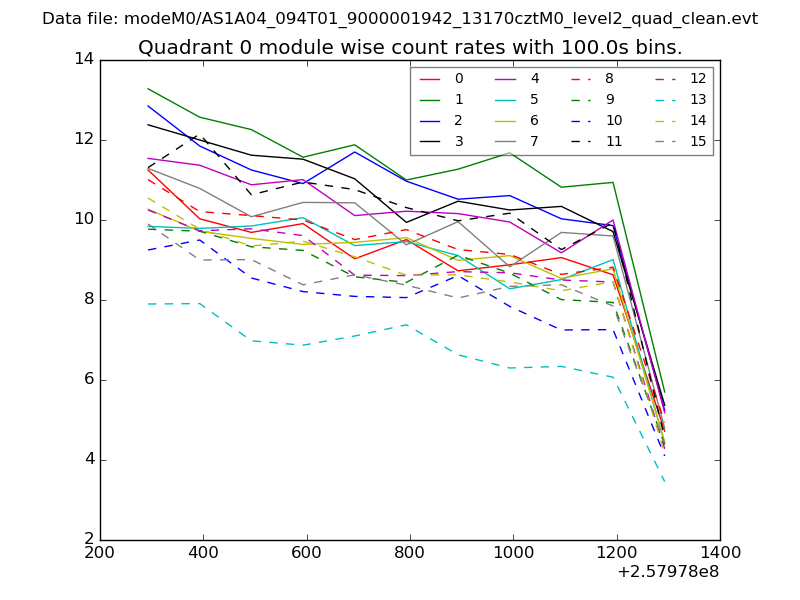 |
 |
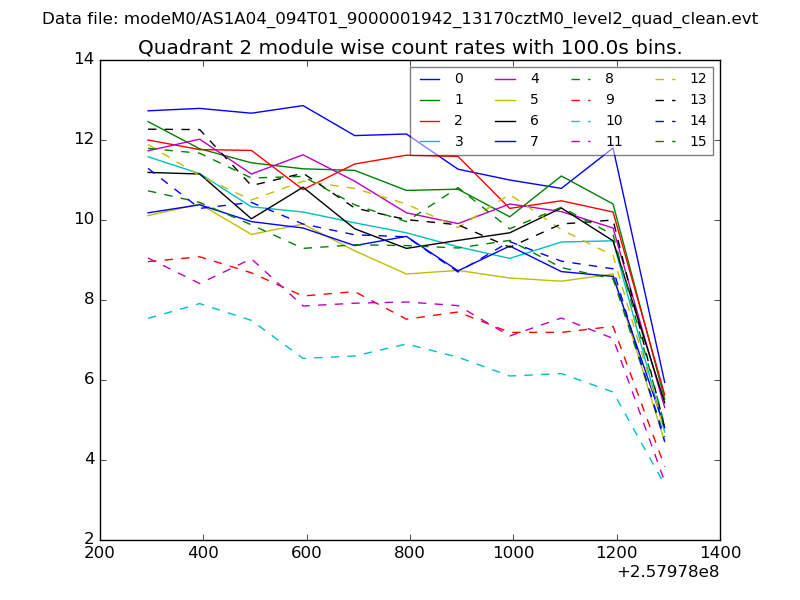
| Module-wise count rates for Quadrant B Data is divided into 100 sec bins |
 |
 |
| Module-wise count rates for Quadrant C Data is divided into 100 sec bins |
 |
 |
| Module-wise count rates for Quadrant D Data is divided into 100 sec bins |
 |
 |
| Parameter | Plot |
|---|---|
| CZT HV Monitor | 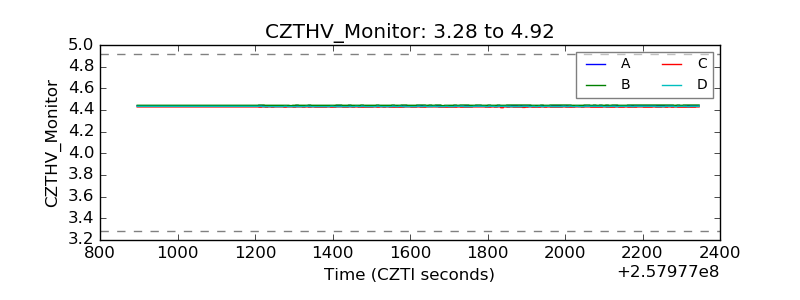 |
| D_VDD | 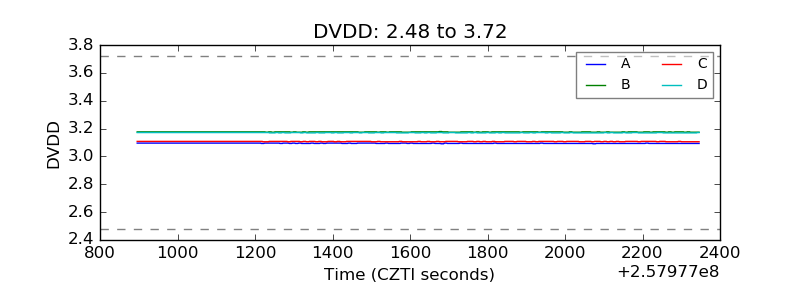 |
| Temperature 1 | 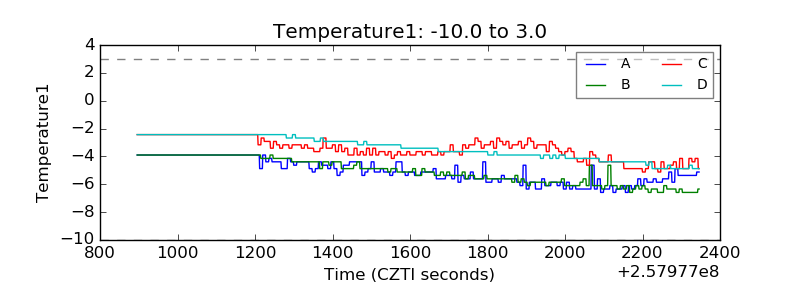 |
| Veto HV Monitor | 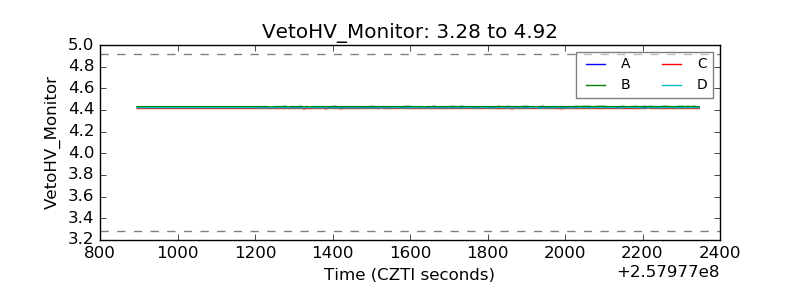 |
| Veto LLD | 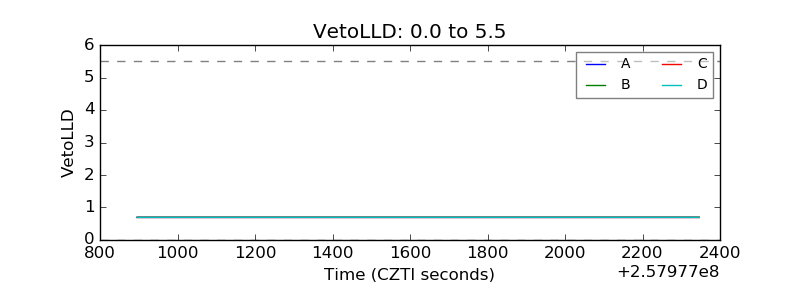 |
| Alpha Counter | 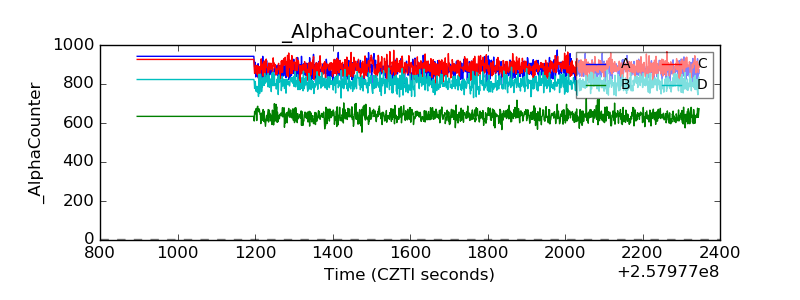 |
| _CPM_Rate |  |
| CZT Counter | 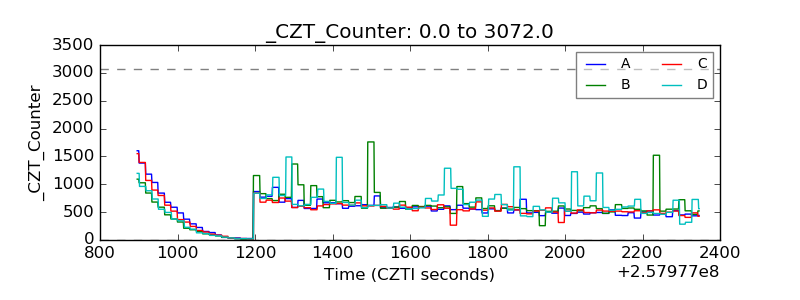 |
| +2.5 Volts monitor |  |
| +5 Volts monitor |  |
| _ROLL_ROT | 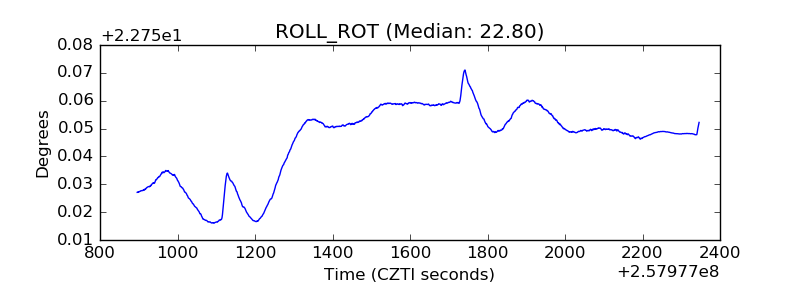 |
| _Roll_DEC |  |
| _Roll_RA | 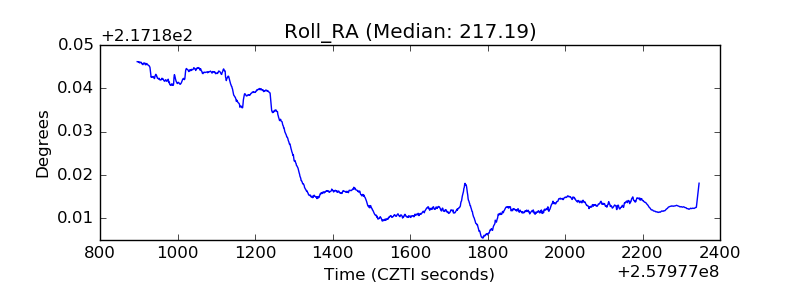 |
| Veto Counter | 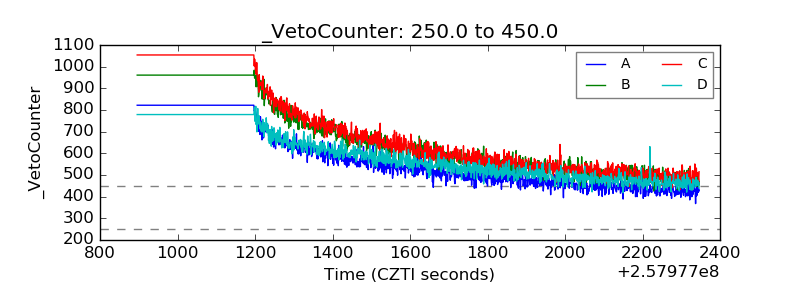 |