| Param | Original file | Final file |
|---|---|---|
| Filename | modeM0/AS1G08_034T01_9000001944cztM0_level2.fits | modeM0/AS1G08_034T01_9000001944cztM0_level2_quad_clean.evt |
| Size (bytes) | 282,899,520 | 240,243,840 |
| Size | 269.8 MB | 229.1 MB |
| Events in quadrant A | 1,692,688 | 1,333,923 |
| Events in quadrant B | 1,623,996 | 1,347,148 |
| Events in quadrant C | 1,699,558 | 1,319,383 |
| Events in quadrant D | 1,463,434 | 1,187,267 |
| Mode M0 | |||
|---|---|---|---|
| Quadrant | BADHDUFLAG | Total packets | Discarded packets |
| A | 0 | 66266 | 0 |
| B | 0 | 73864 | 0 |
| C | 0 | 62322 | 0 |
| D | 0 | 71427 | 0 |
| Mode SS | |||
|---|---|---|---|
| Quadrant | BADHDUFLAG | Total packets | Discarded packets |
| A | 0 | 616 | 0 |
| B | 0 | 616 | 0 |
| C | 0 | 616 | 0 |
| D | 0 | 616 | 0 |
| Mode M9 | |||
|---|---|---|---|
| Quadrant | BADHDUFLAG | Total packets | Discarded packets |
| A | 0 | 33 | 0 |
| B | 0 | 33 | 0 |
| C | 0 | 33 | 0 |
| D | 0 | 33 | 0 |
| Quadrant | Total seconds | Saturated seconds | Saturation percentage |
|---|---|---|---|
| A | 30362 | 745 | 2.453725% |
| B | 30362 | 1641 | 5.404782% |
| C | 30362 | 387 | 1.274620% |
| D | 30362 | 905 | 2.980700% |
Noise dominated data is calculated using 1-second bins in cleaned event files. If a bin has >2000 counts, and if more than 50% of those come from <1% of pixels, then it is considered to be noise-dominated and hence unusable.
| Quadrant | # 1 sec bins | Bins with >0 counts | Bins with >2000 counts | High rate bins dominated by noise | Noise dominated (total time) | Noise dominated (detector-on time) | Marked lightcurve |
|---|---|---|---|---|---|---|---|
| A | 52055 | 30363 | 0 | 0 | 0.00% | 0.00% |  |
| B | 52055 | 30296 | 0 | 0 | 0.00% | 0.00% |  |
| C | 52055 | 30363 | 0 | 0 | 0.00% | 0.00% |  |
| D | 52055 | 30357 | 0 | 0 | 0.00% | 0.00% |  |
Top three noisy pixels from each quadrant. If the there are fewer than three noisy pixels in the level2.evt file, extra rows are filled as -1
| Pixel properties | Quadrant properties | ||||||
|---|---|---|---|---|---|---|---|
| Quadrant | DetID | PixID | Counts | Sigma | Mean | Median | Sigma |
| A | 0 | 29 | 1635 | 10.96 | 441 | 412 | 111.6 |
| A | 7 | 110 | 1384 | 8.71 | 441 | 412 | 111.6 |
| A | 9 | 19 | 1272 | 7.7 | 441 | 412 | 111.6 |
| B | 2 | 9 | 1452 | 12.09 | 428 | 408 | 86.3 |
| B | 14 | 254 | 1166 | 8.78 | 428 | 408 | 86.3 |
| B | 2 | 8 | 1088 | 7.88 | 428 | 408 | 86.3 |
| C | 12 | 241 | 1245 | 7.09 | 448 | 416 | 116.9 |
| C | 2 | 191 | 1200 | 6.71 | 448 | 416 | 116.9 |
| C | 9 | 242 | 1146 | 6.25 | 448 | 416 | 116.9 |
| D | 4 | 246 | 1145 | 6.68 | 417 | 378 | 114.9 |
| D | 3 | 14 | 1097 | 6.26 | 417 | 378 | 114.9 |
| D | 7 | 3 | 1070 | 6.02 | 417 | 378 | 114.9 |
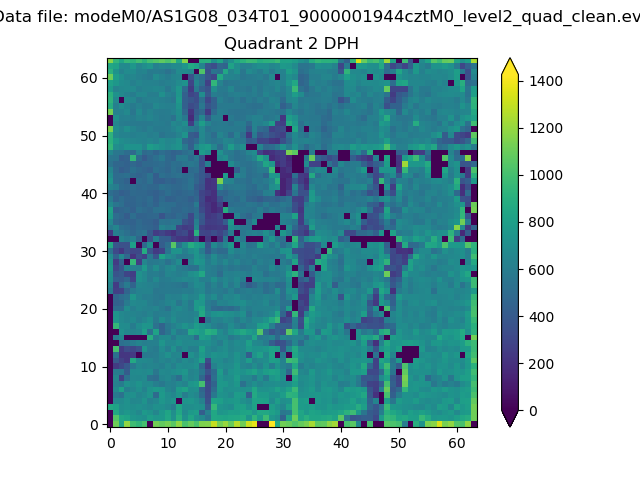
Histogram calculated using DETX and DETY for each event in the final _common_clean file
| Quadrant A |  |
 |
Quadrant B |
|---|---|---|---|
| Quadrant D | 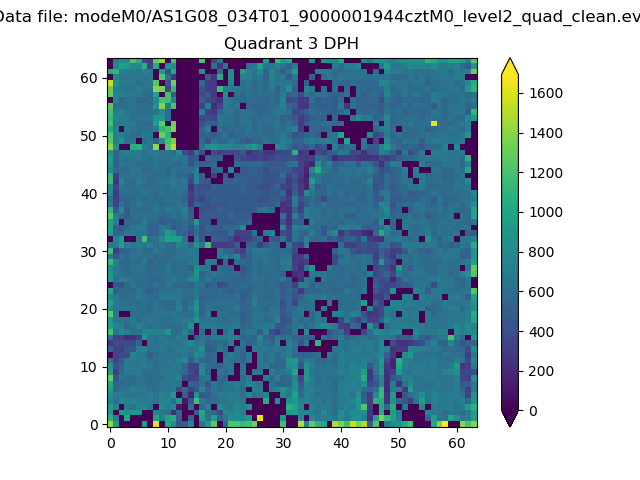 |
 |
Quadrant C |
| Plot type | Count rate plots | Images |
|---|---|---|
| Comparison with Poisson distribution Blue bars denote a histogram of data divided into 1 sec bins. Red curve is a Poisson curve with rate = median count rate of data. |
 |
 |
| Quadrant-wise count rates Data is divided into 100 sec bins |
 |
|
| Module-wise count rates for Quadrant A Data is divided into 100 sec bins |
 |
 |
| Module-wise count rates for Quadrant B Data is divided into 100 sec bins |
 |
 |
| Module-wise count rates for Quadrant C Data is divided into 100 sec bins |
 |
 |
| Module-wise count rates for Quadrant D Data is divided into 100 sec bins |
 |
 |
| Parameter | Plot |
|---|---|
| CZT HV Monitor |  |
| D_VDD |  |
| Temperature 1 |  |
| Veto HV Monitor |  |
| Veto LLD |  |
| Alpha Counter |  |
| _CPM_Rate |  |
| CZT Counter |  |
| +2.5 Volts monitor |  |
| +5 Volts monitor |  |
| _ROLL_ROT |  |
| _Roll_DEC |  |
| _Roll_RA |  |
| Veto Counter | 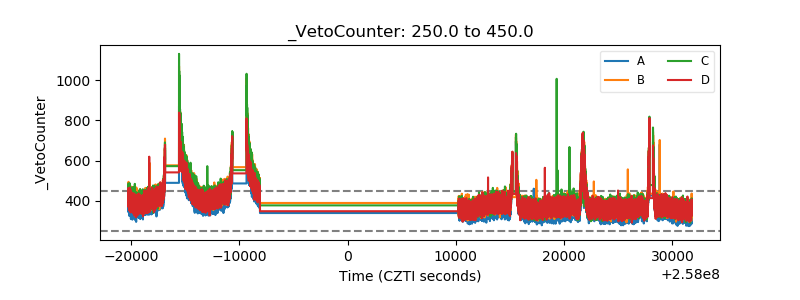 |