| Param | Original file | Final file |
|---|---|---|
| Filename | modeM0/AS1G08_034T01_9000001944_13170cztM0_level2.evt | modeM0/AS1G08_034T01_9000001944_13170cztM0_level2_quad_clean.evt |
| Size (bytes) | 340,473,600 | 71,550,720 |
| Size | 324.7 MB | 68.2 MB |
| Events in quadrant A | 2,308,973 | 455,924 |
| Events in quadrant B | 3,051,985 | 464,776 |
| Events in quadrant C | 2,162,023 | 474,103 |
| Events in quadrant D | 2,472,000 | 445,832 |
| Mode M0 | |||
|---|---|---|---|
| Quadrant | BADHDUFLAG | Total packets | Discarded packets |
| A | 0 | 9875 | 2 |
| B | 0 | 12221 | 1 |
| C | 0 | 9590 | 1 |
| D | 0 | 10585 | 1 |
| Mode SS | |||
|---|---|---|---|
| Quadrant | BADHDUFLAG | Total packets | Discarded packets |
| A | 0 | 94 | 0 |
| B | 0 | 94 | 0 |
| C | 0 | 94 | 0 |
| D | 0 | 94 | 0 |
| Mode M9 | |||
|---|---|---|---|
| Quadrant | BADHDUFLAG | Total packets | Discarded packets |
| A | 0 | 13 | 0 |
| B | 0 | 13 | 0 |
| C | 0 | 13 | 0 |
| D | 0 | 13 | 0 |
| Quadrant | Total seconds | Saturated seconds | Saturation percentage |
|---|---|---|---|
| A | 4642 | 26 | 0.560103% |
| B | 4642 | 344 | 7.410599% |
| C | 4642 | 22 | 0.473934% |
| D | 4642 | 52 | 1.120207% |
Noise dominated data is calculated using 1-second bins in cleaned event files. If a bin has >2000 counts, and if more than 50% of those come from <1% of pixels, then it is considered to be noise-dominated and hence unusable.
| Quadrant | # 1 sec bins | Bins with >0 counts | Bins with >2000 counts | High rate bins dominated by noise | Noise dominated (total time) | Noise dominated (detector-on time) | Marked lightcurve |
|---|---|---|---|---|---|---|---|
| A | 5933 | 4644 | 3 | 3 | 0.05% | 0.06% | 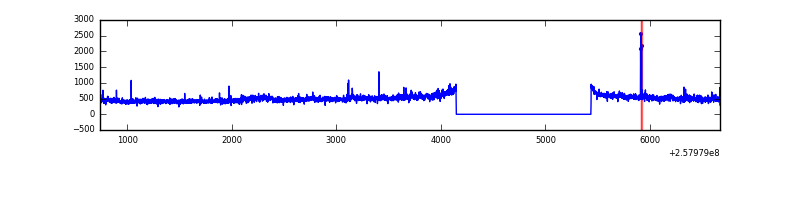 |
| B | 5932 | 4643 | 208 | 208 | 3.51% | 4.48% | 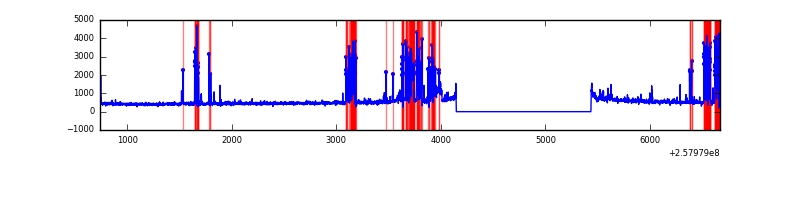 |
| C | 5933 | 4644 | 0 | 0 | 0.00% | 0.00% | 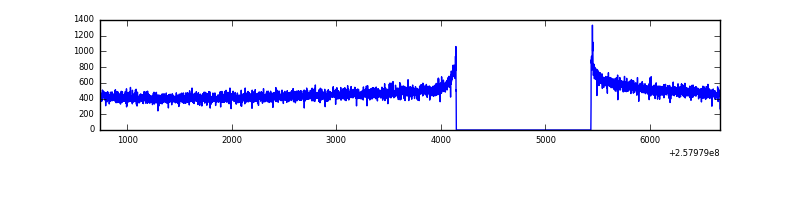 |
| D | 5933 | 4644 | 16 | 16 | 0.27% | 0.34% | 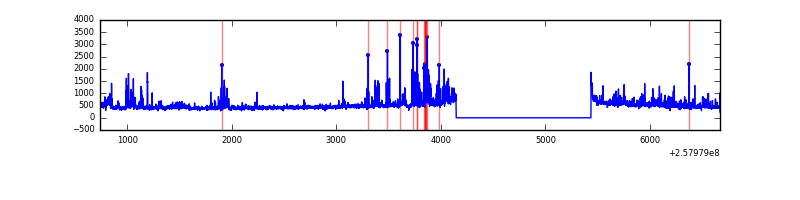 |
Top three noisy pixels from each quadrant. If the there are fewer than three noisy pixels in the level2.evt file, extra rows are filled as -1
| Pixel properties | Quadrant properties | ||||||
|---|---|---|---|---|---|---|---|
| Quadrant | DetID | PixID | Counts | Sigma | Mean | Median | Sigma |
| A | 12 | 189 | 71986 | 623.49 | 563 | 551 | 114.6 |
| A | 8 | 192 | 24460 | 208.68 | 563 | 551 | 114.6 |
| A | 15 | 69 | 13553 | 113.48 | 563 | 551 | 114.6 |
| B | 4 | 239 | 737381 | 7097.98 | 549 | 536 | 103.8 |
| B | 0 | 230 | 48621 | 463.2 | 549 | 536 | 103.8 |
| B | 5 | 32 | 29930 | 283.15 | 549 | 536 | 103.8 |
| C | 13 | 61 | 3896 | 26.22 | 553 | 557 | 127.3 |
| C | 15 | 208 | 3734 | 24.95 | 553 | 557 | 127.3 |
| C | 3 | 202 | 1416 | 6.75 | 553 | 557 | 127.3 |
| D | 1 | 52 | 285928 | 2206.47 | 543 | 529 | 129.3 |
| D | 14 | 34 | 81193 | 623.63 | 543 | 529 | 129.3 |
| D | 8 | 195 | 32631 | 248.19 | 543 | 529 | 129.3 |
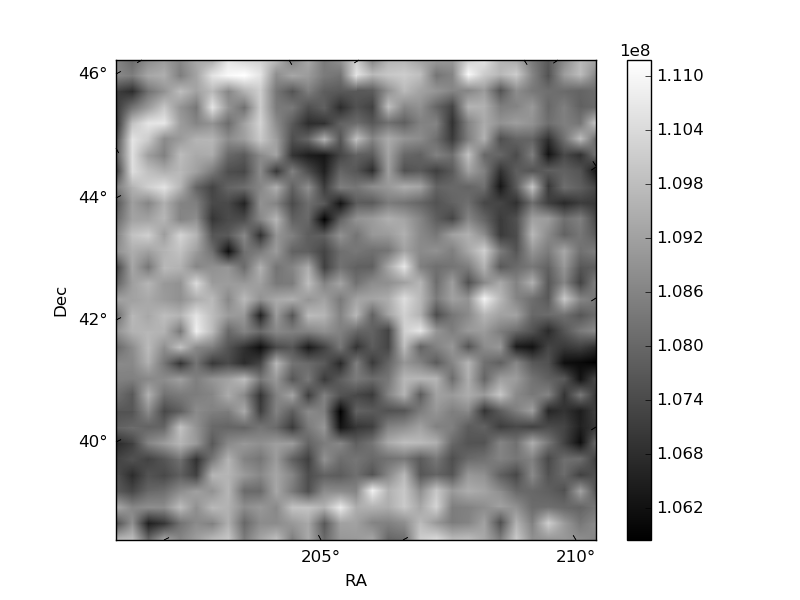
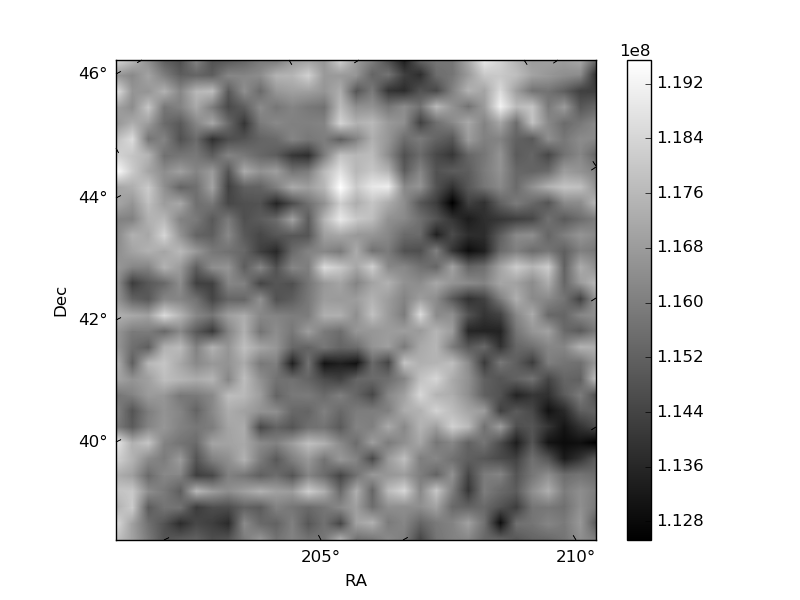
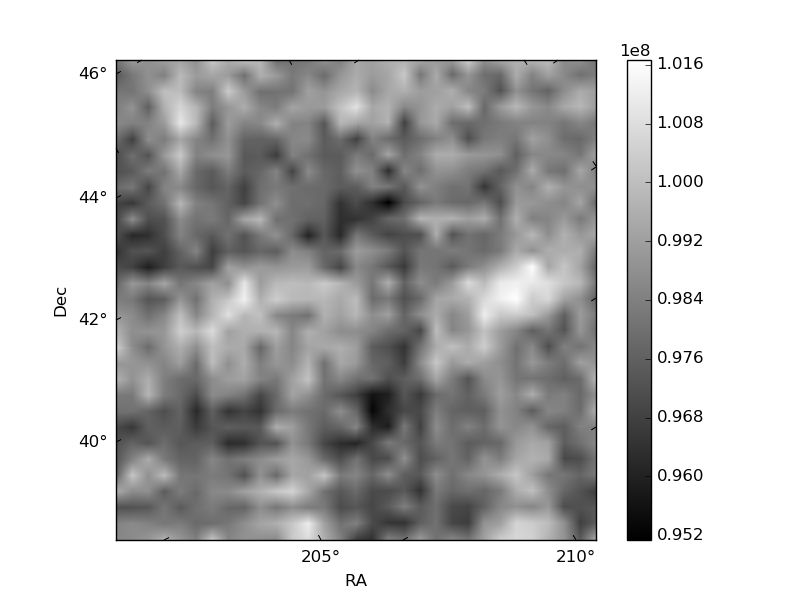
Histogram calculated using DETX and DETY for each event in the final _common_clean file
| Quadrant A |  |
 |
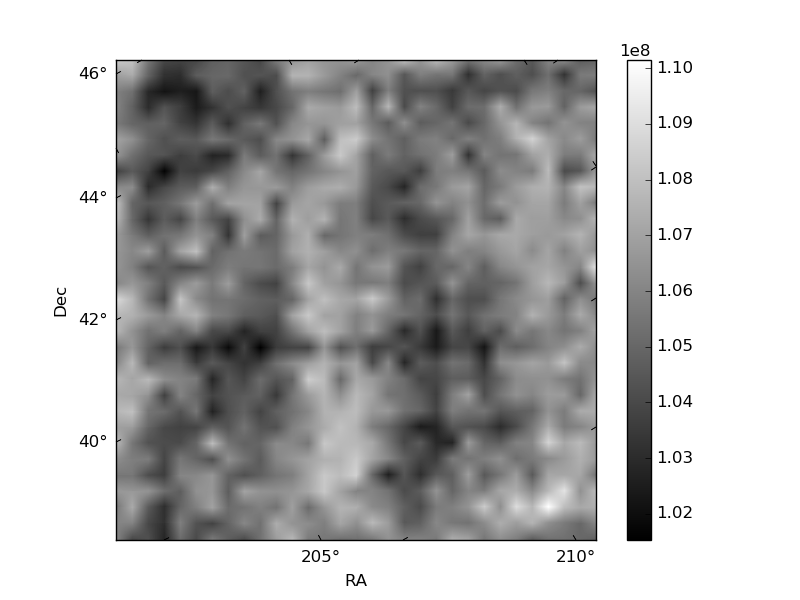
Quadrant B |
|---|---|---|---|
| Quadrant D |  |
 |
Quadrant C |
| Plot type | Count rate plots | Images |
|---|---|---|
| Comparison with Poisson distribution Blue bars denote a histogram of data divided into 1 sec bins. Red curve is a Poisson curve with rate = median count rate of data. |
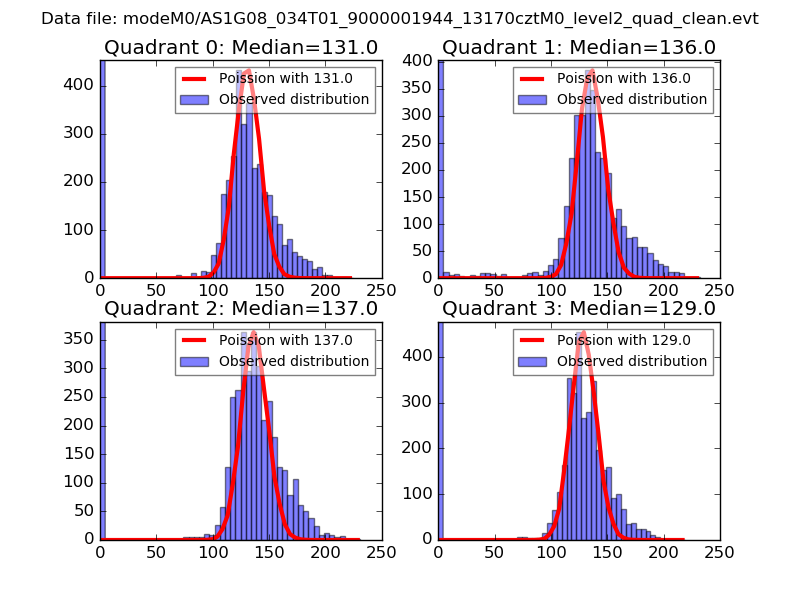 |
 |
| Quadrant-wise count rates Data is divided into 100 sec bins |
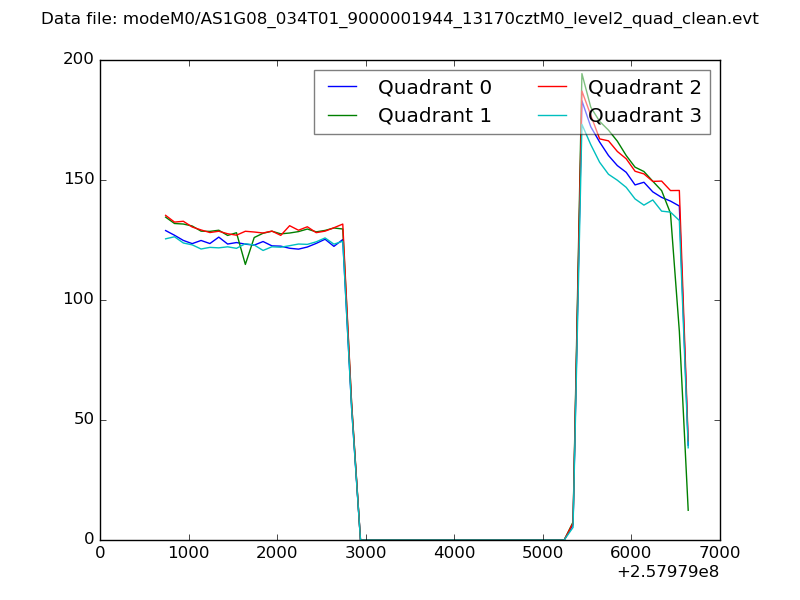 |
|
| Module-wise count rates for Quadrant A Data is divided into 100 sec bins |
 |
 |
| Module-wise count rates for Quadrant B Data is divided into 100 sec bins |
 |
 |
| Module-wise count rates for Quadrant C Data is divided into 100 sec bins |
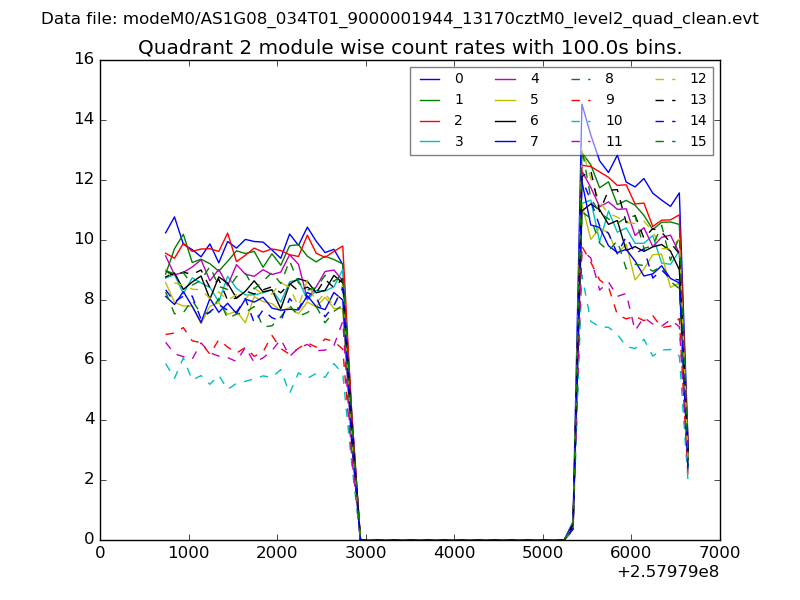 |
 |
| Module-wise count rates for Quadrant D Data is divided into 100 sec bins |
 |
 |
| Parameter | Plot |
|---|---|
| CZT HV Monitor |  |
| D_VDD |  |
| Temperature 1 |  |
| Veto HV Monitor |  |
| Veto LLD |  |
| Alpha Counter | 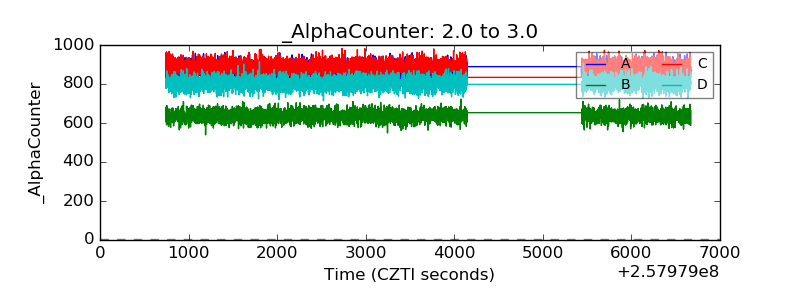 |
| _CPM_Rate | 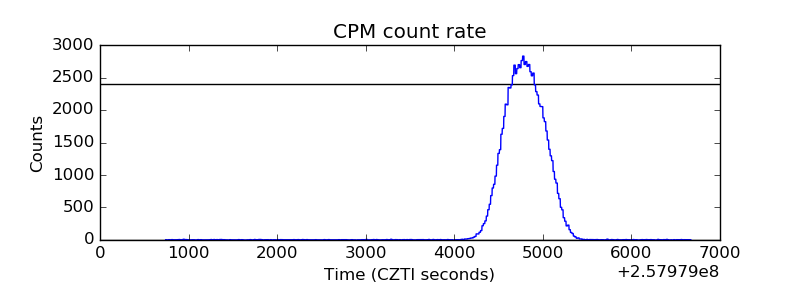 |
| CZT Counter |  |
| +2.5 Volts monitor |  |
| +5 Volts monitor |  |
| _ROLL_ROT |  |
| _Roll_DEC |  |
| _Roll_RA |  |
| Veto Counter |  |