| Param | Original file | Final file |
|---|---|---|
| Filename | modeM0/AS1G08_034T01_9000001944_13173cztM0_level2.evt | modeM0/AS1G08_034T01_9000001944_13173cztM0_level2_quad_clean.evt |
| Size (bytes) | 33,125,760 | 10,537,920 |
| Size | 31.6 MB | 10.0 MB |
| Events in quadrant A | 246,759 | 67,761 |
| Events in quadrant B | 264,093 | 69,535 |
| Events in quadrant C | 222,600 | 67,602 |
| Events in quadrant D | 227,593 | 66,315 |
| Mode M0 | |||
|---|---|---|---|
| Quadrant | BADHDUFLAG | Total packets | Discarded packets |
| A | 0 | 1836 | 690 |
| B | 0 | 1913 | 715 |
| C | 0 | 1838 | 734 |
| D | 0 | 1852 | 708 |
| Mode SS | |||
|---|---|---|---|
| Quadrant | BADHDUFLAG | Total packets | Discarded packets |
| A | 0 | 18 | 4 |
| B | 0 | 19 | 9 |
| C | 0 | 22 | 10 |
| D | 0 | 20 | 8 |
| Mode M9 | |||
|---|---|---|---|
| Quadrant | BADHDUFLAG | Total packets | Discarded packets |
| A | 1 | 273359709408 | 0 |
| B | 1 | -1 | -1 |
| C | 1 | -1 | -1 |
| D | 1 | -1 | -1 |
| Quadrant | Total seconds | Saturated seconds | Saturation percentage |
|---|---|---|---|
| A | 571 | 0 | 0.000000% |
| B | 569 | 6 | 1.054482% |
| C | 552 | 0 | 0.000000% |
| D | 564 | 0 | 0.000000% |
Noise dominated data is calculated using 1-second bins in cleaned event files. If a bin has >2000 counts, and if more than 50% of those come from <1% of pixels, then it is considered to be noise-dominated and hence unusable.
| Quadrant | # 1 sec bins | Bins with >0 counts | Bins with >2000 counts | High rate bins dominated by noise | Noise dominated (total time) | Noise dominated (detector-on time) | Marked lightcurve |
|---|---|---|---|---|---|---|---|
| A | 682 | 610 | 0 | 0 | 0.00% | 0.00% | 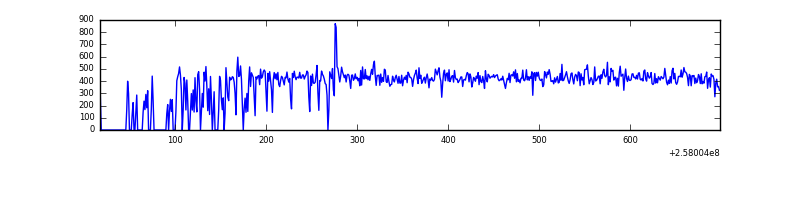 |
| B | 653 | 610 | 5 | 5 | 0.77% | 0.82% | 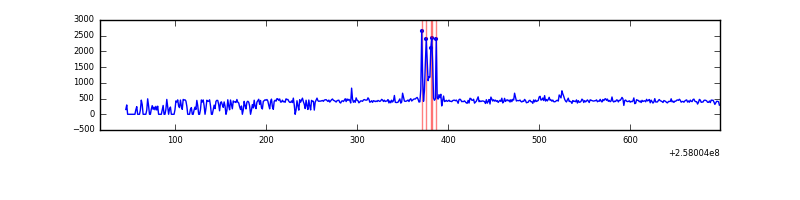 |
| C | 634 | 584 | 0 | 0 | 0.00% | 0.00% | 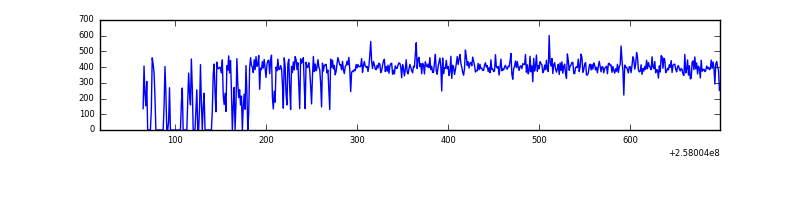 |
| D | 649 | 592 | 0 | 0 | 0.00% | 0.00% | 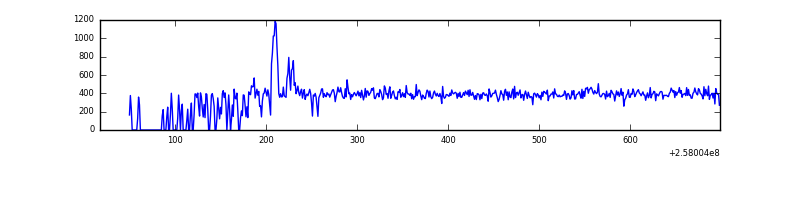 |
Top three noisy pixels from each quadrant. If the there are fewer than three noisy pixels in the level2.evt file, extra rows are filled as -1
| Pixel properties | Quadrant properties | ||||||
|---|---|---|---|---|---|---|---|
| Quadrant | DetID | PixID | Counts | Sigma | Mean | Median | Sigma |
| A | 12 | 189 | 8752 | 595.83 | 61 | 60 | 14.6 |
| A | 0 | 23 | 1925 | 127.84 | 61 | 60 | 14.6 |
| A | 0 | 226 | 682 | 42.64 | 61 | 60 | 14.6 |
| B | 4 | 239 | 23489 | 1688.94 | 61 | 60 | 13.9 |
| B | 0 | 219 | 1455 | 100.56 | 61 | 60 | 13.9 |
| B | 12 | 111 | 1296 | 89.1 | 61 | 60 | 13.9 |
| C | 13 | 61 | 436 | 25.17 | 57 | 57 | 15.1 |
| C | 3 | 202 | 148 | 6.04 | 57 | 57 | 15.1 |
| C | 3 | 203 | 135 | 5.18 | 57 | 57 | 15.1 |
| D | 9 | 85 | 7324 | 457.63 | 57 | 56 | 15.9 |
| D | 1 | 52 | 2296 | 141.04 | 57 | 56 | 15.9 |
| D | 2 | 234 | 1942 | 118.75 | 57 | 56 | 15.9 |
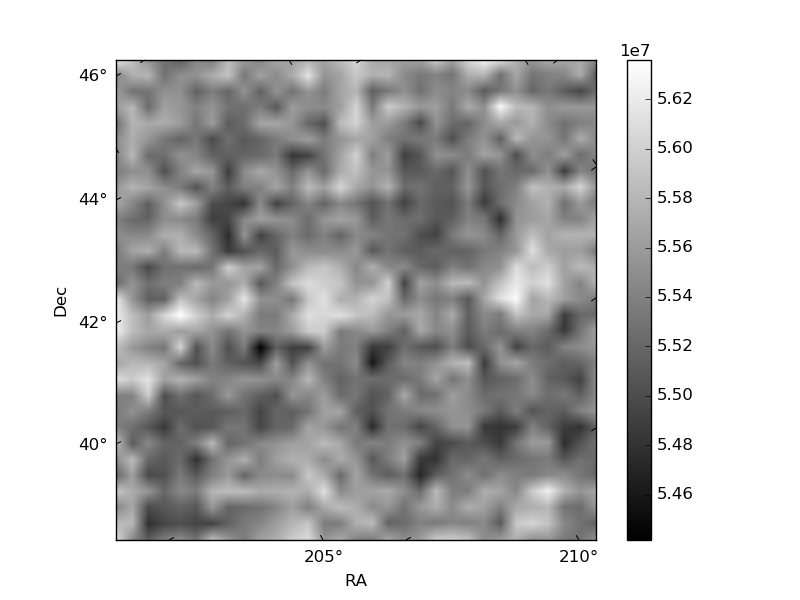
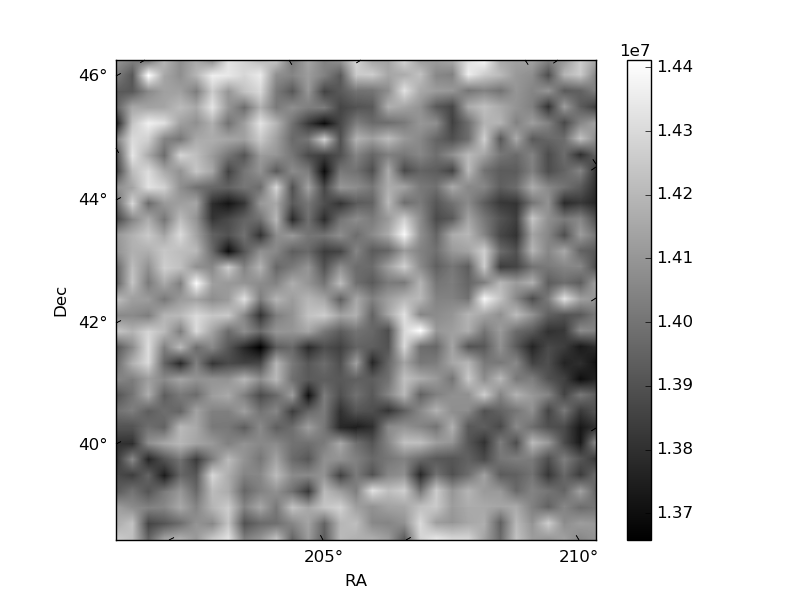
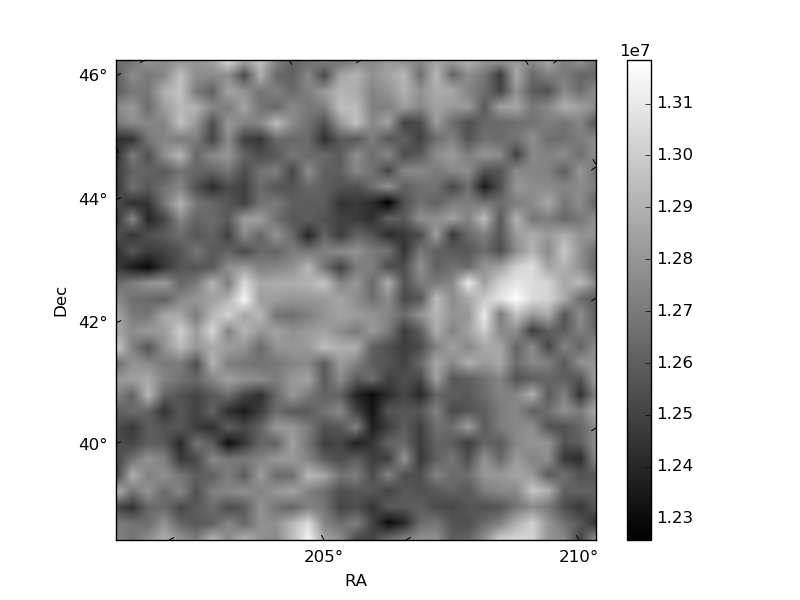
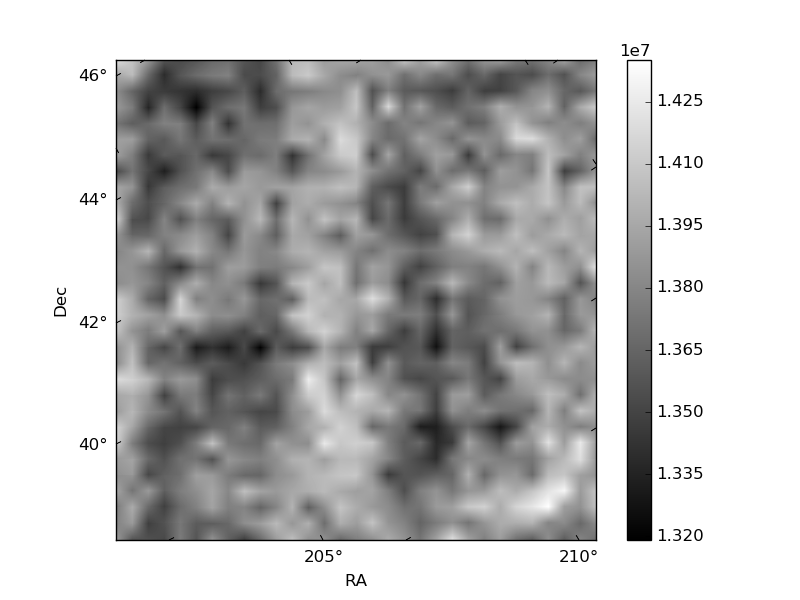
Histogram calculated using DETX and DETY for each event in the final _common_clean file
| Quadrant A | 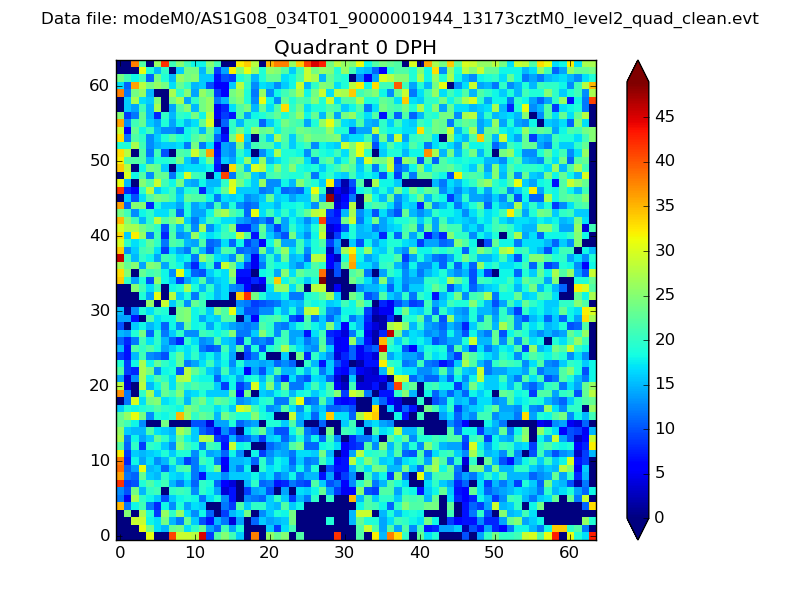 |
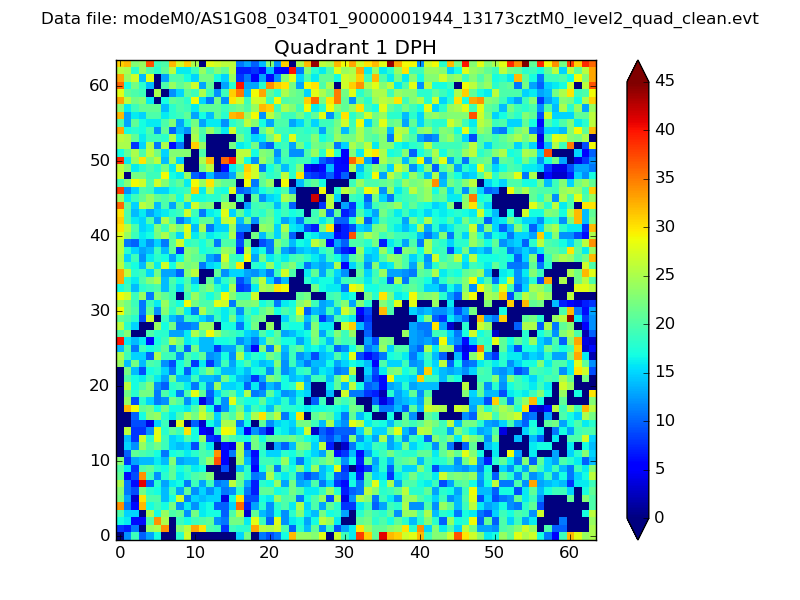 |
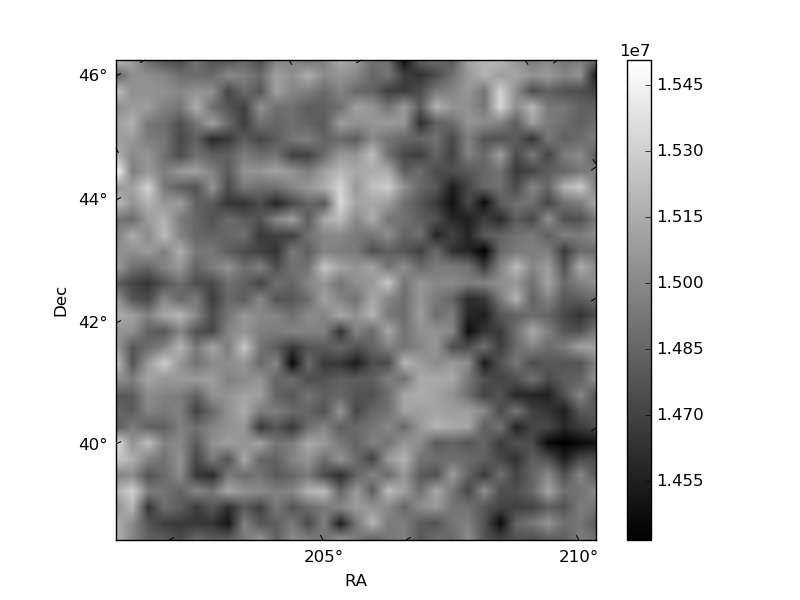
Quadrant B |
|---|---|---|---|
| Quadrant D | 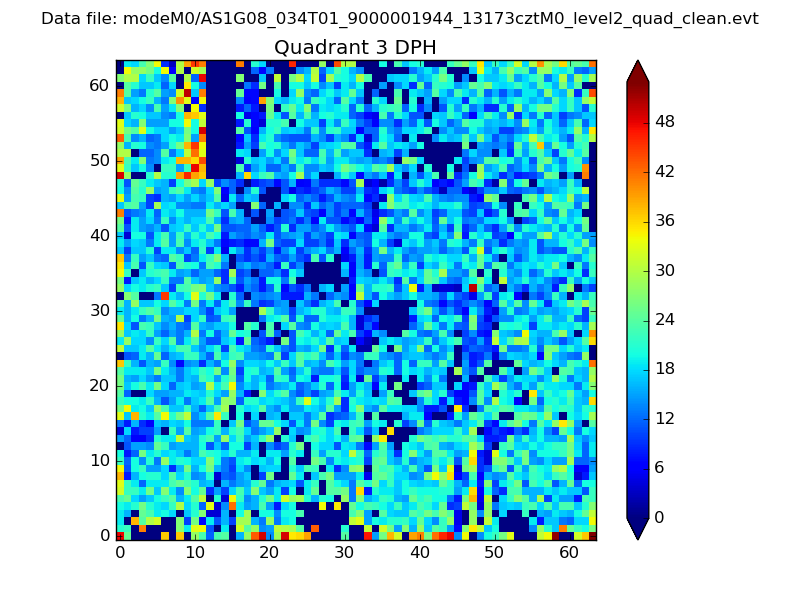 |
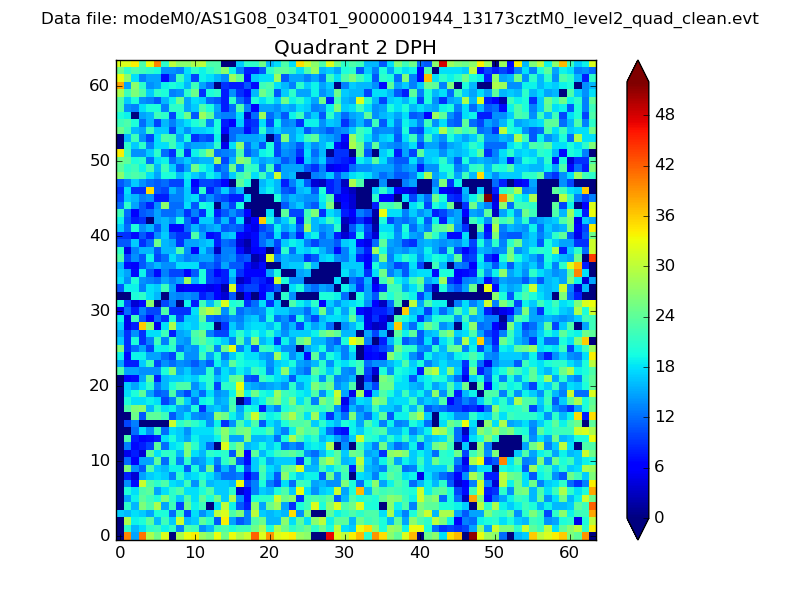 |
Quadrant C |
| Plot type | Count rate plots | Images |
|---|---|---|
| Comparison with Poisson distribution Blue bars denote a histogram of data divided into 1 sec bins. Red curve is a Poisson curve with rate = median count rate of data. |
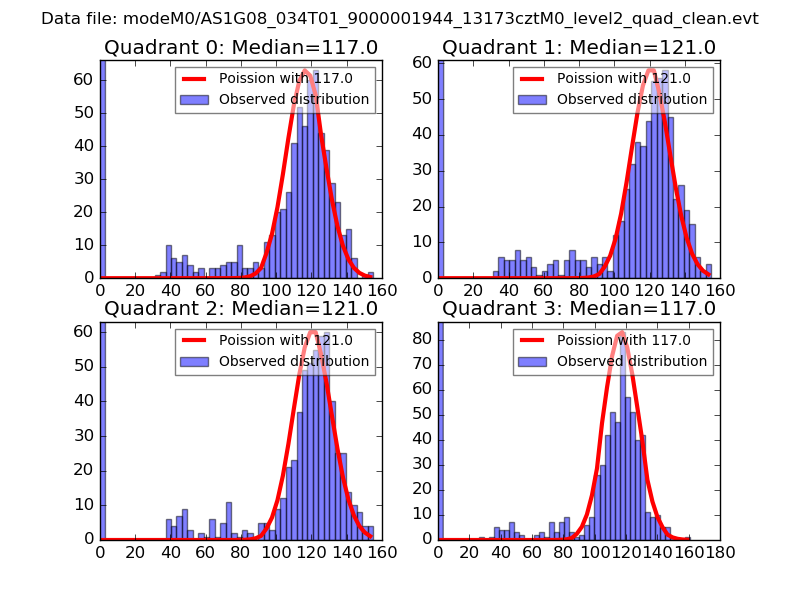 |
 |
| Quadrant-wise count rates Data is divided into 100 sec bins |
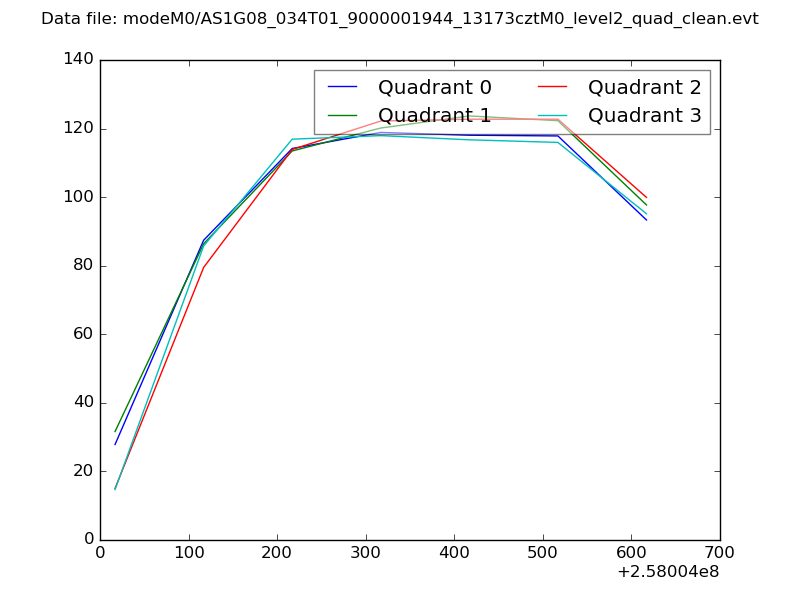 |
|
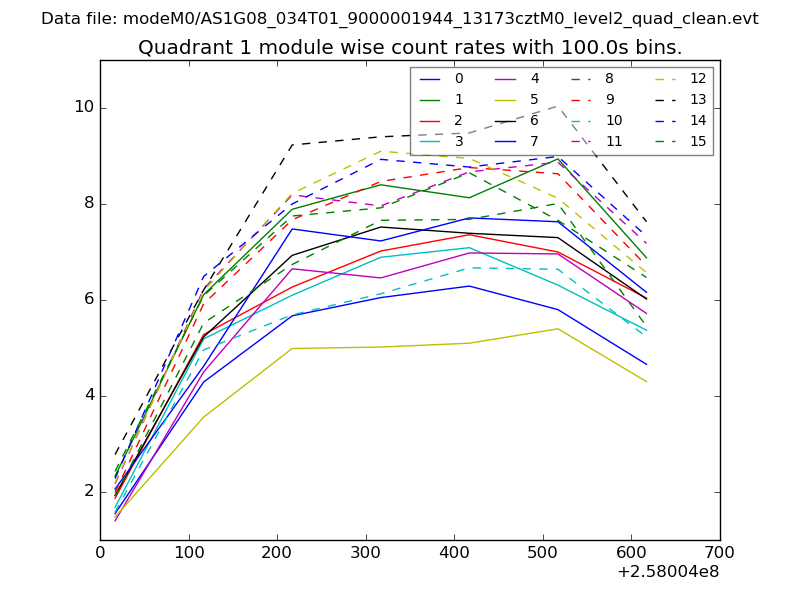
| Module-wise count rates for Quadrant A Data is divided into 100 sec bins |
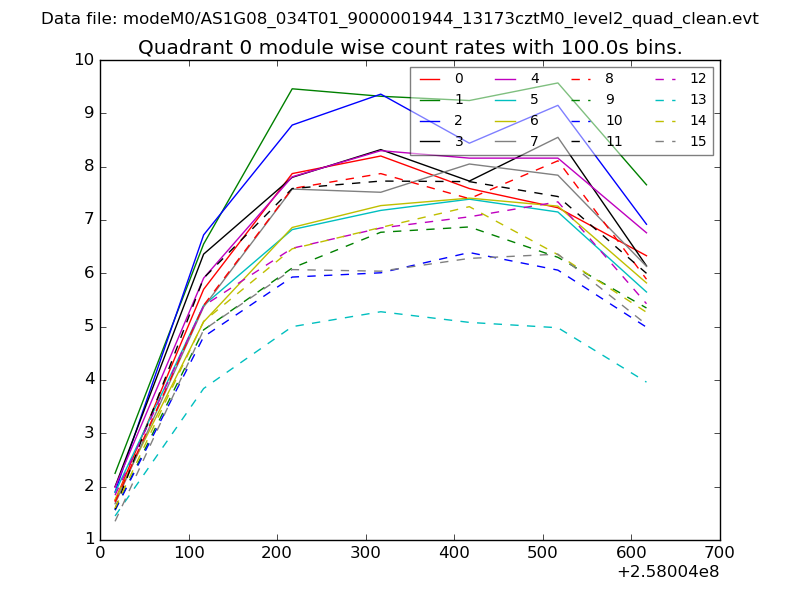 |
 |
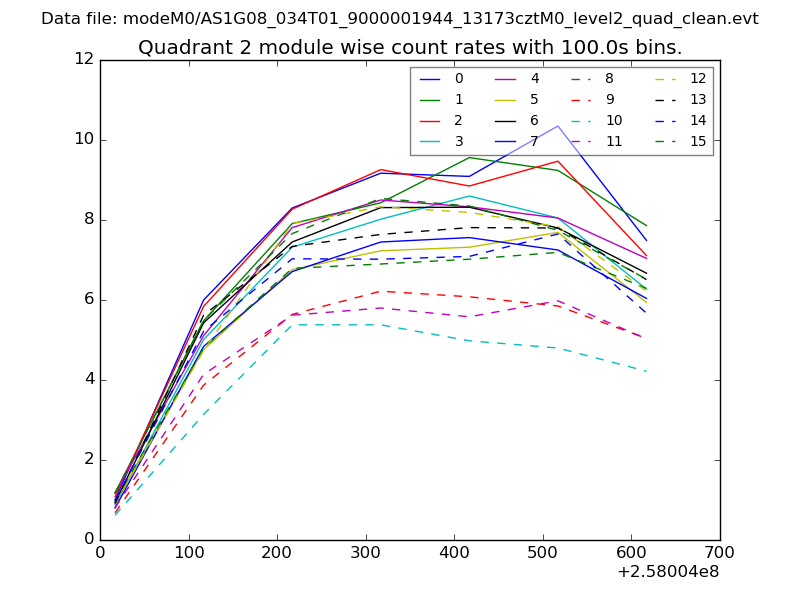
| Module-wise count rates for Quadrant B Data is divided into 100 sec bins |
 |
 |
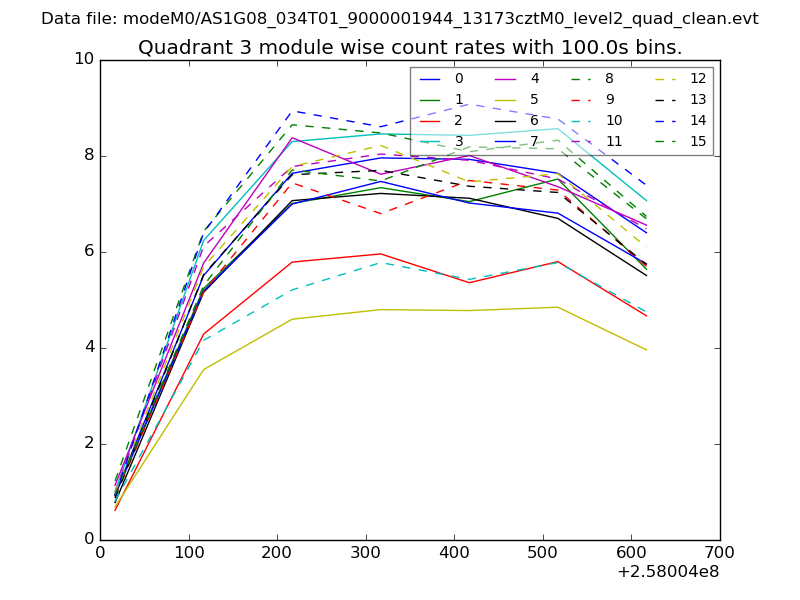
| Module-wise count rates for Quadrant C Data is divided into 100 sec bins |
 |
 |
| Module-wise count rates for Quadrant D Data is divided into 100 sec bins |
 |
 |
| Parameter | Plot |
|---|---|
| CZT HV Monitor | 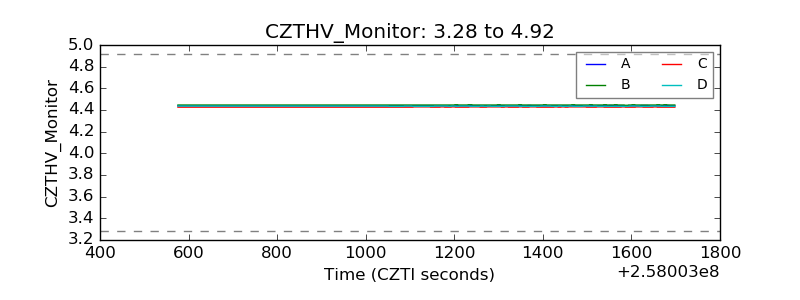 |
| D_VDD | 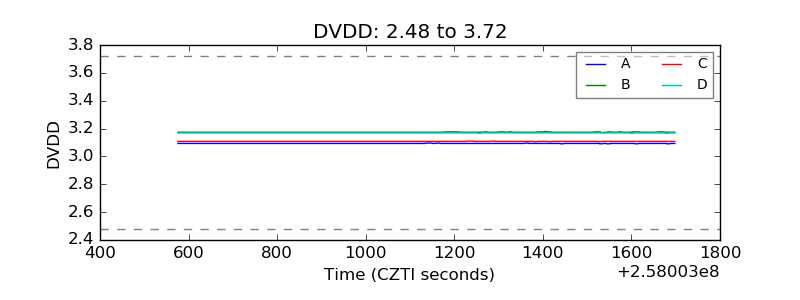 |
| Temperature 1 | 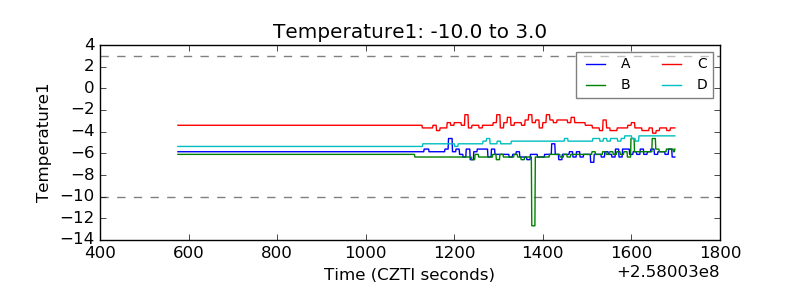 |
| Veto HV Monitor | 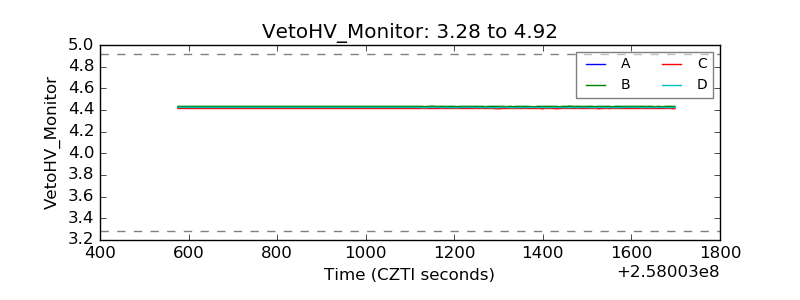 |
| Veto LLD | 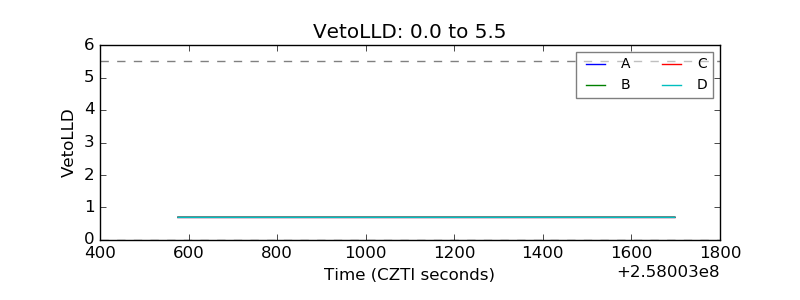 |
| Alpha Counter | 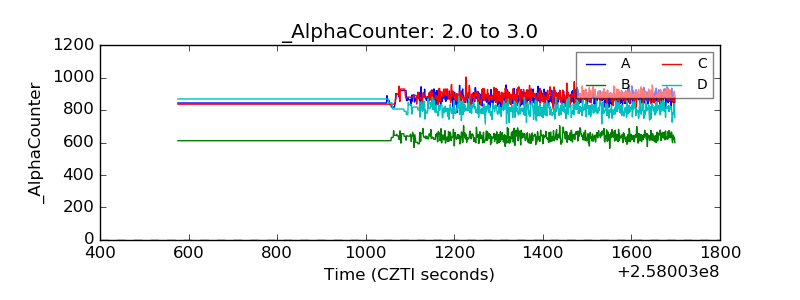 |
| _CPM_Rate |  |
| CZT Counter | 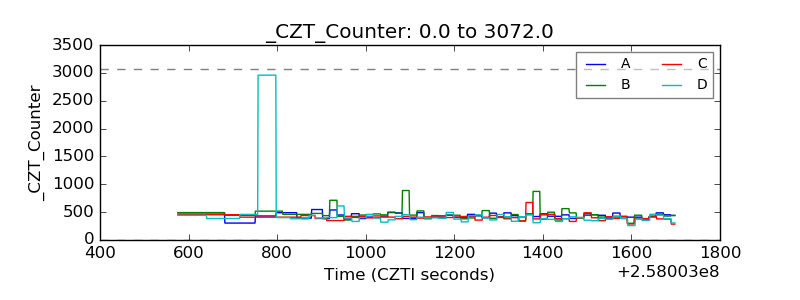 |
| +2.5 Volts monitor | 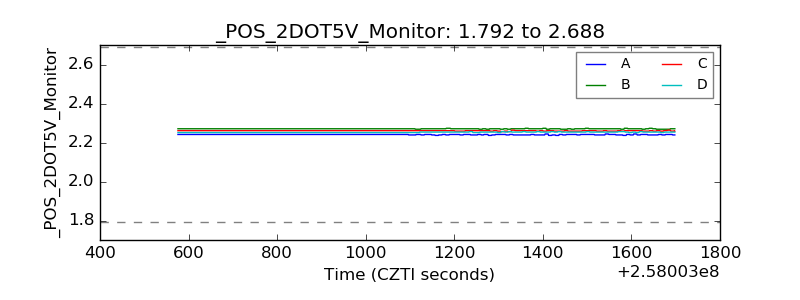 |
| +5 Volts monitor | 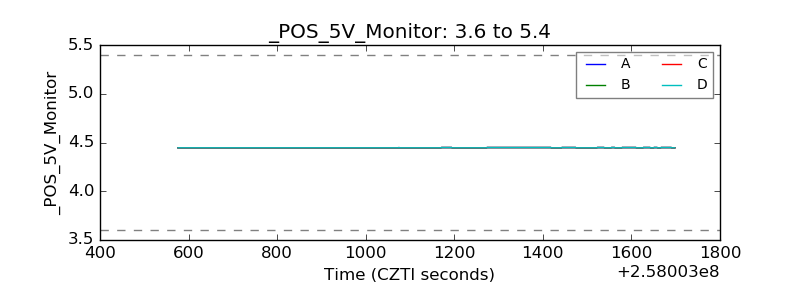 |
| _ROLL_ROT | 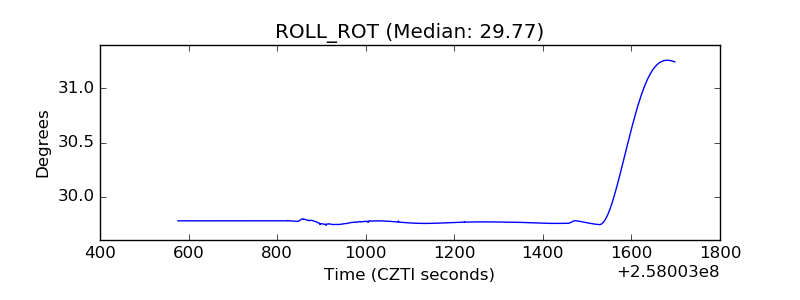 |
| _Roll_DEC | 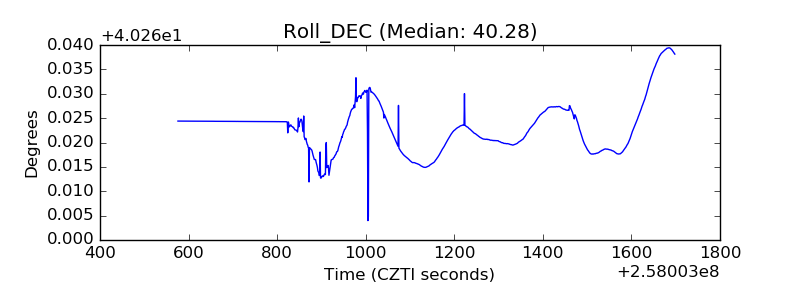 |
| _Roll_RA | 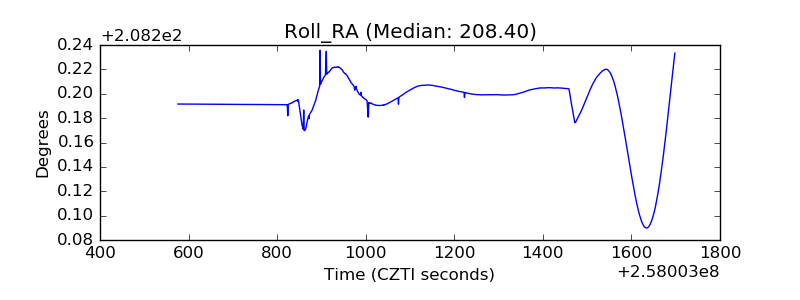 |
| Veto Counter | 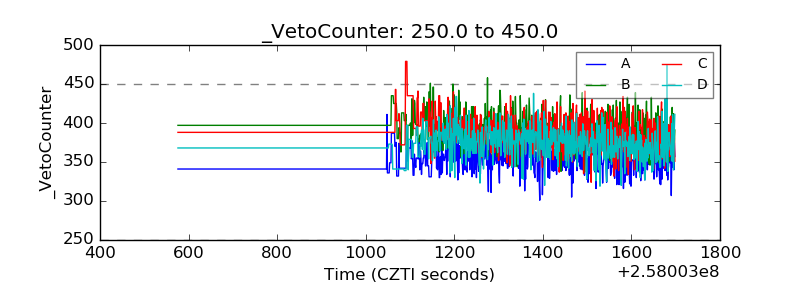 |