| Param | Original file | Final file |
|---|---|---|
| Filename | modeM0/AS1G08_034T01_9000001944_13174cztM0_level2.evt | modeM0/AS1G08_034T01_9000001944_13174cztM0_level2_quad_clean.evt |
| Size (bytes) | 923,028,480 | 177,753,600 |
| Size | 880.3 MB | 169.5 MB |
| Events in quadrant A | 6,647,112 | 1,110,569 |
| Events in quadrant B | 7,878,122 | 1,128,684 |
| Events in quadrant C | 6,104,585 | 1,141,030 |
| Events in quadrant D | 6,415,700 | 1,076,868 |
| Mode M0 | |||
|---|---|---|---|
| Quadrant | BADHDUFLAG | Total packets | Discarded packets |
| A | 0 | 35061 | 6383 |
| B | 0 | 40747 | 8346 |
| C | 0 | 33908 | 6169 |
| D | 0 | 35130 | 6646 |
| Mode SS | |||
|---|---|---|---|
| Quadrant | BADHDUFLAG | Total packets | Discarded packets |
| A | 0 | 337 | 57 |
| B | 0 | 339 | 65 |
| C | 0 | 342 | 70 |
| D | 0 | 340 | 68 |
| Mode M9 | |||
|---|---|---|---|
| Quadrant | BADHDUFLAG | Total packets | Discarded packets |
| A | 0 | 33 | 2 |
| B | 0 | 34 | 3 |
| C | 0 | 31 | 0 |
| D | 0 | 31 | 0 |
| Quadrant | Total seconds | Saturated seconds | Saturation percentage |
|---|---|---|---|
| A | 13407 | 130 | 0.969643% |
| B | 13364 | 617 | 4.616881% |
| C | 13461 | 60 | 0.445732% |
| D | 13379 | 89 | 0.665222% |
Noise dominated data is calculated using 1-second bins in cleaned event files. If a bin has >2000 counts, and if more than 50% of those come from <1% of pixels, then it is considered to be noise-dominated and hence unusable.
| Quadrant | # 1 sec bins | Bins with >0 counts | Bins with >2000 counts | High rate bins dominated by noise | Noise dominated (total time) | Noise dominated (detector-on time) | Marked lightcurve |
|---|---|---|---|---|---|---|---|
| A | 19700 | 13864 | 2 | 2 | 0.01% | 0.01% | 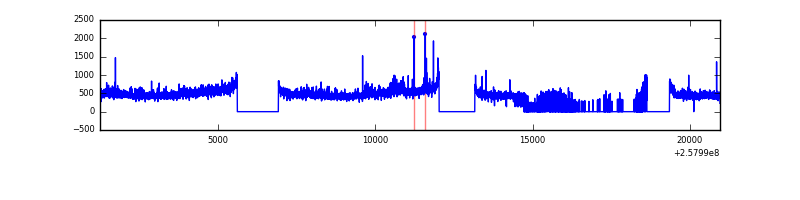 |
| B | 19700 | 13771 | 326 | 326 | 1.65% | 2.37% | 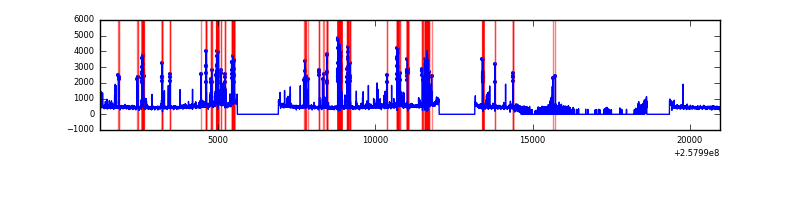 |
| C | 19700 | 13929 | 6 | 6 | 0.03% | 0.04% | 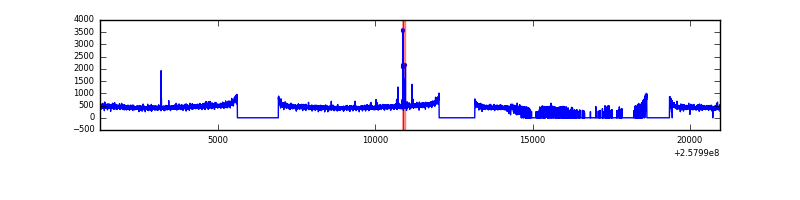 |
| D | 19700 | 13827 | 14 | 14 | 0.07% | 0.10% | 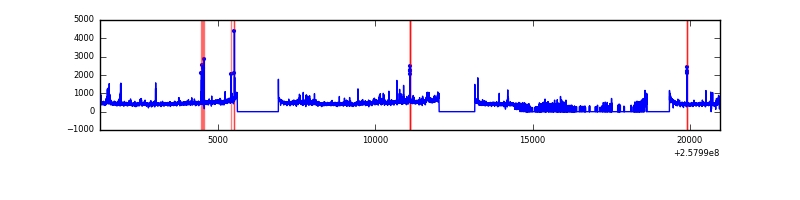 |
Top three noisy pixels from each quadrant. If the there are fewer than three noisy pixels in the level2.evt file, extra rows are filled as -1
| Pixel properties | Quadrant properties | ||||||
|---|---|---|---|---|---|---|---|
| Quadrant | DetID | PixID | Counts | Sigma | Mean | Median | Sigma |
| A | 12 | 189 | 413514 | 1291.62 | 1592 | 1561 | 318.9 |
| A | 0 | 23 | 36015 | 108.03 | 1592 | 1561 | 318.9 |
| A | 1 | 162 | 35833 | 107.45 | 1592 | 1561 | 318.9 |
| B | 4 | 239 | 1378768 | 4663.04 | 1568 | 1532 | 295.4 |
| B | 0 | 230 | 116481 | 389.19 | 1568 | 1532 | 295.4 |
| B | 5 | 32 | 64674 | 213.78 | 1568 | 1532 | 295.4 |
| C | 15 | 208 | 48104 | 130.21 | 1552 | 1559 | 357.5 |
| C | 13 | 61 | 11399 | 27.53 | 1552 | 1559 | 357.5 |
| C | 8 | 128 | 5722 | 11.65 | 1552 | 1559 | 357.5 |
| D | 8 | 195 | 309945 | 849.97 | 1525 | 1484 | 362.9 |
| D | 1 | 52 | 148320 | 404.61 | 1525 | 1484 | 362.9 |
| D | 2 | 234 | 69957 | 188.68 | 1525 | 1484 | 362.9 |
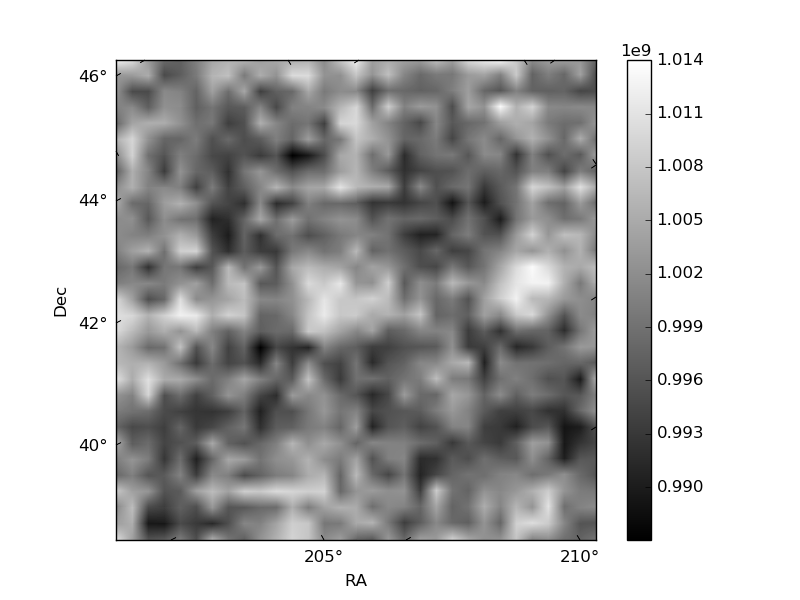
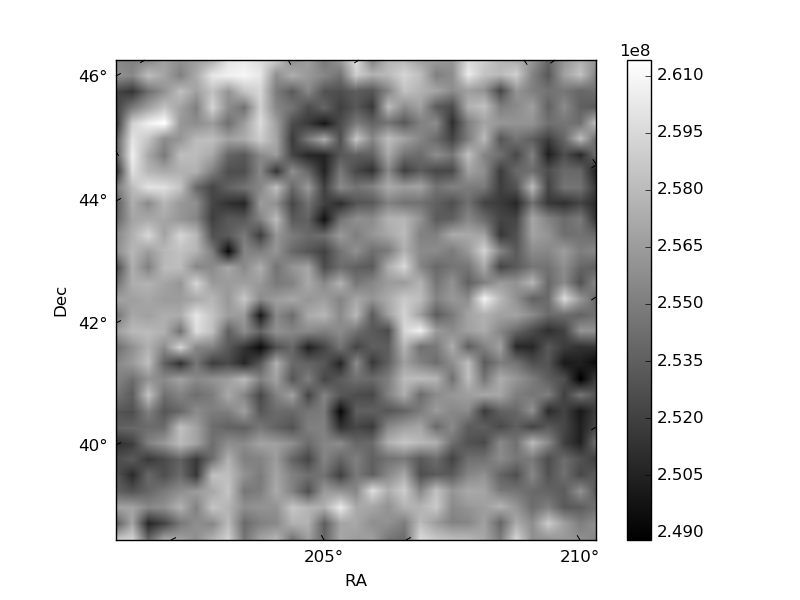
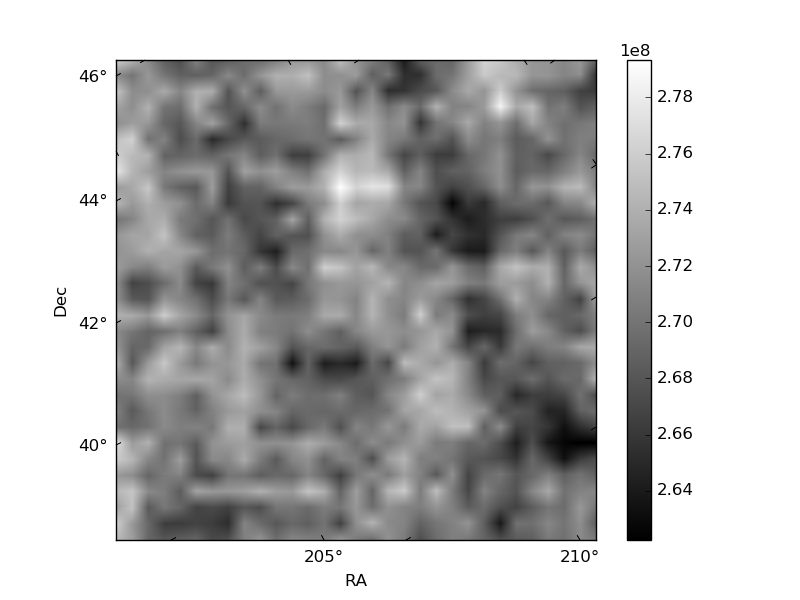
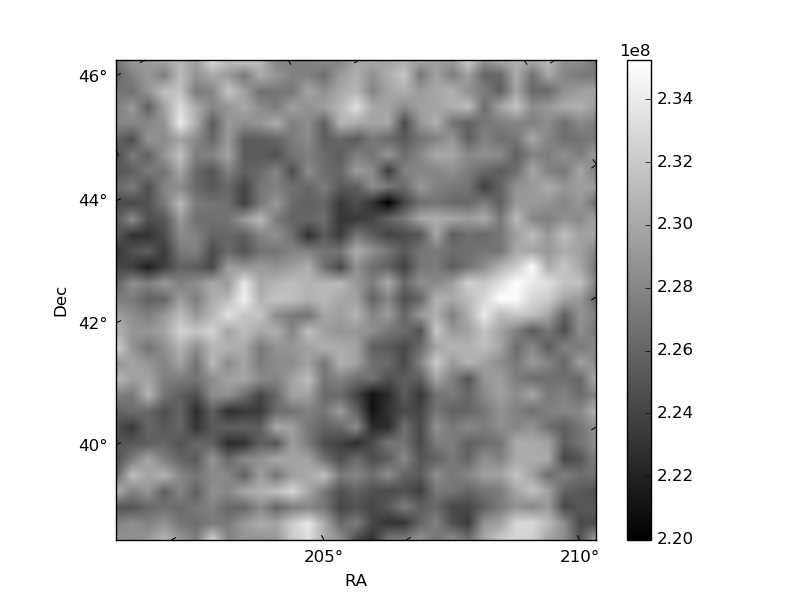
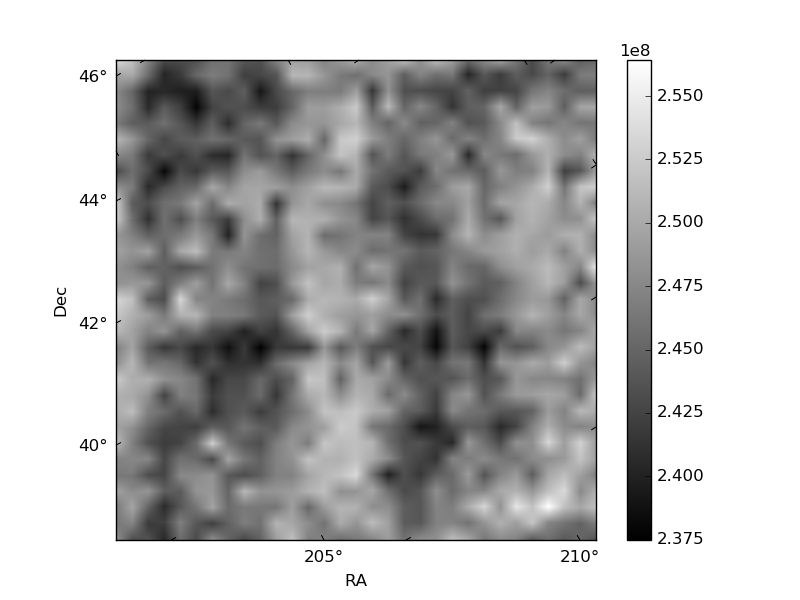
Histogram calculated using DETX and DETY for each event in the final _common_clean file
| Quadrant A | 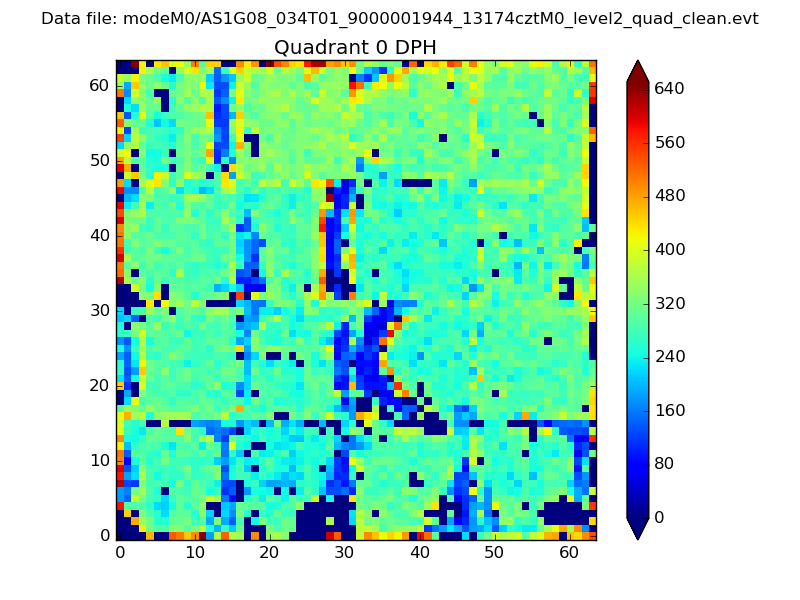 |
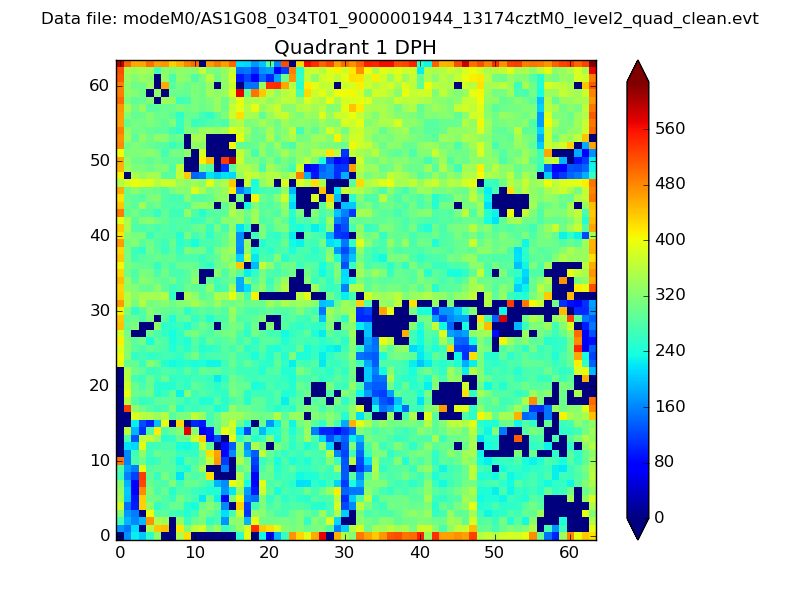 |
Quadrant B |
|---|---|---|---|
| Quadrant D | 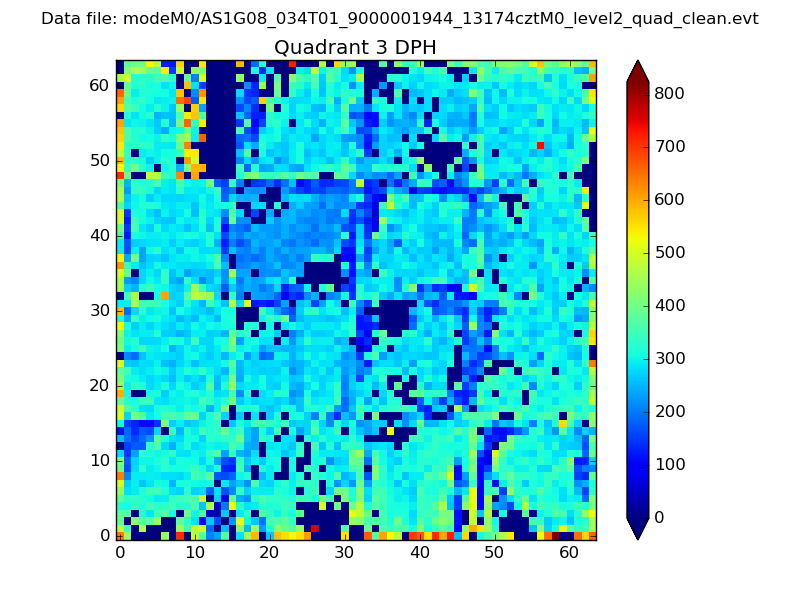 |
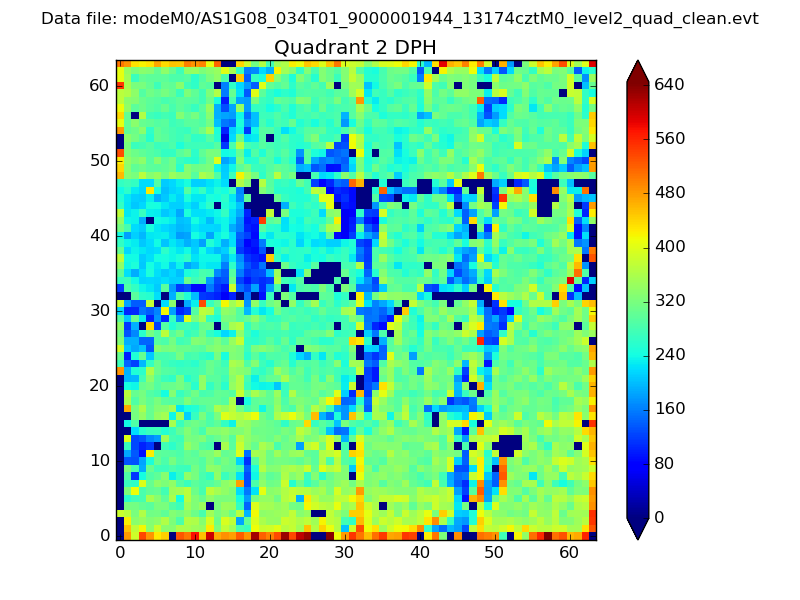 |
Quadrant C |
| Plot type | Count rate plots | Images |
|---|---|---|
| Comparison with Poisson distribution Blue bars denote a histogram of data divided into 1 sec bins. Red curve is a Poisson curve with rate = median count rate of data. |
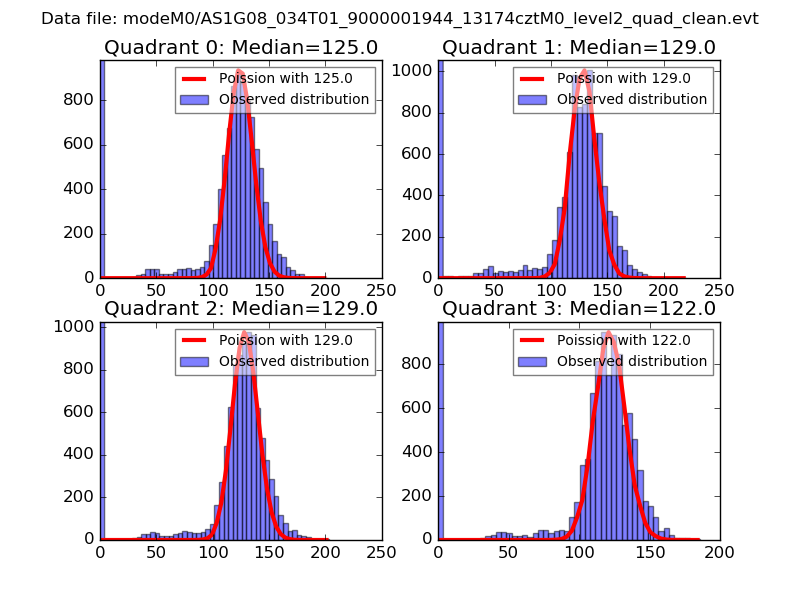 |
 |
| Quadrant-wise count rates Data is divided into 100 sec bins |
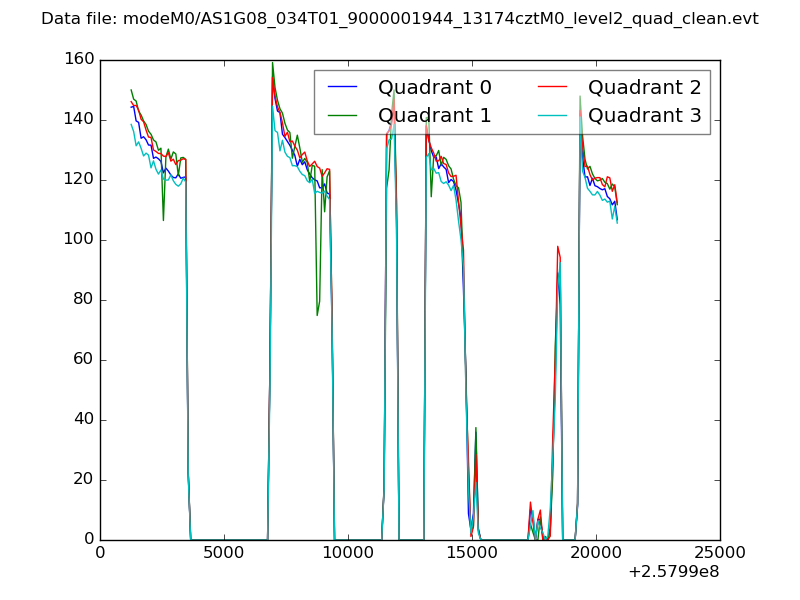 |
|
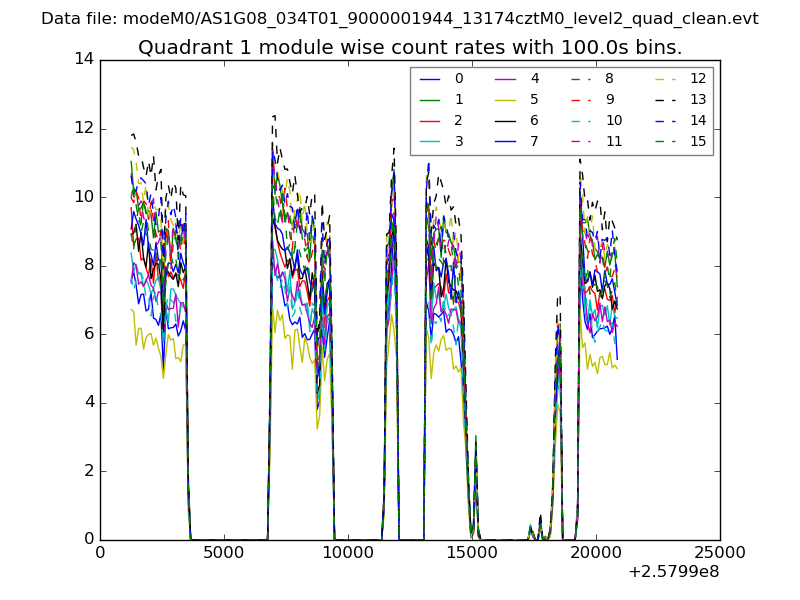
| Module-wise count rates for Quadrant A Data is divided into 100 sec bins |
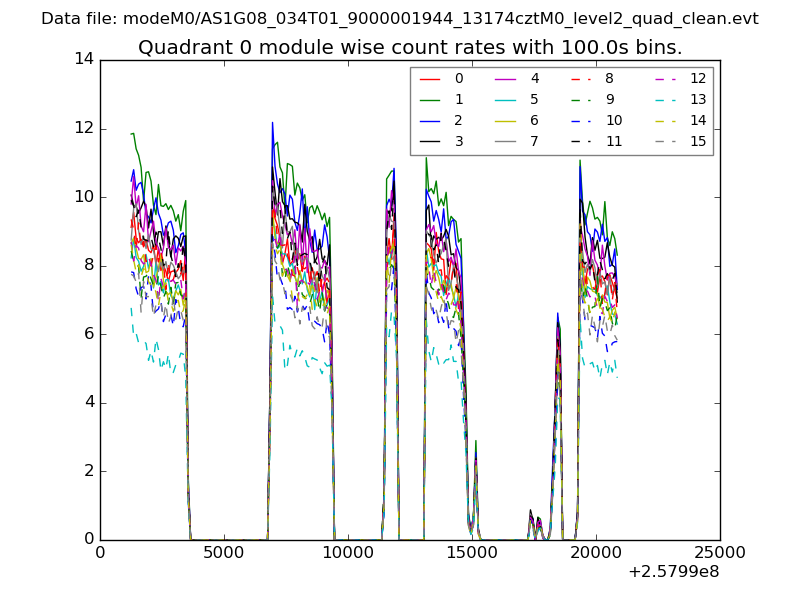 |
 |
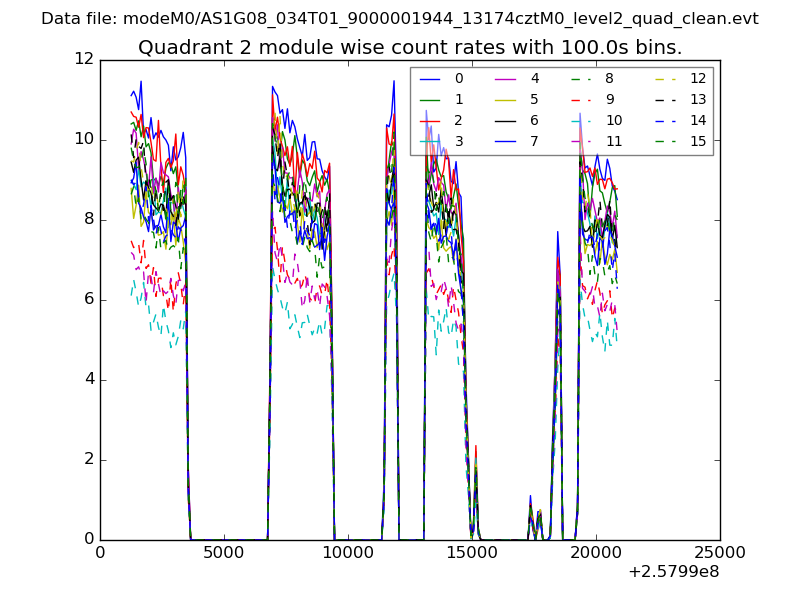
| Module-wise count rates for Quadrant B Data is divided into 100 sec bins |
 |
 |
| Module-wise count rates for Quadrant C Data is divided into 100 sec bins |
 |
 |
| Module-wise count rates for Quadrant D Data is divided into 100 sec bins |
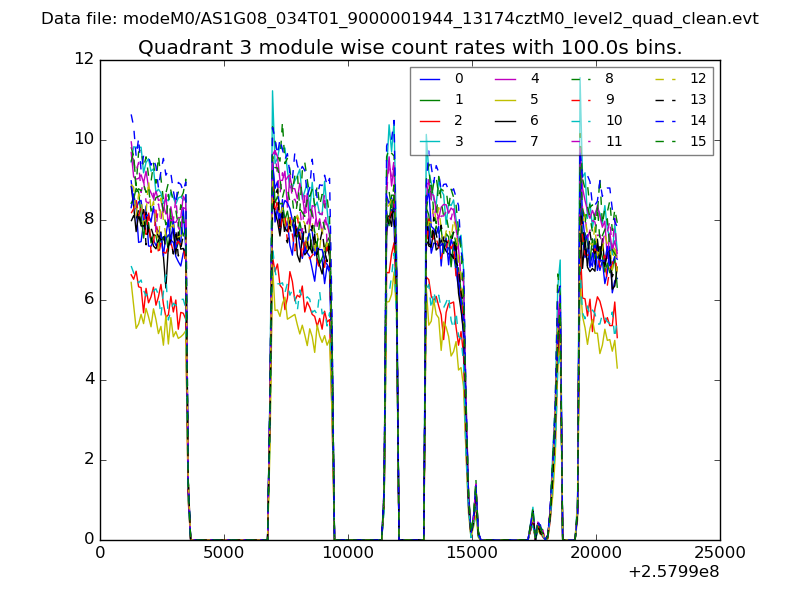 |
 |
| Parameter | Plot |
|---|---|
| CZT HV Monitor | 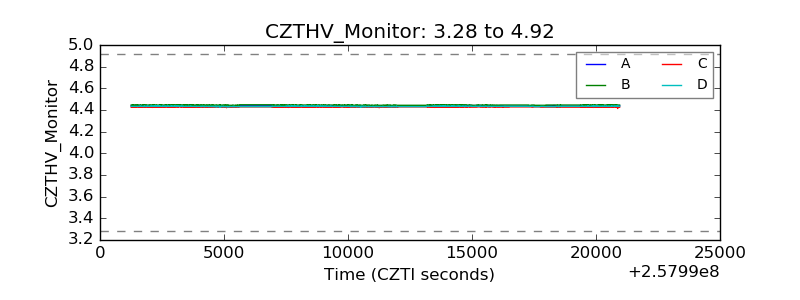 |
| D_VDD | 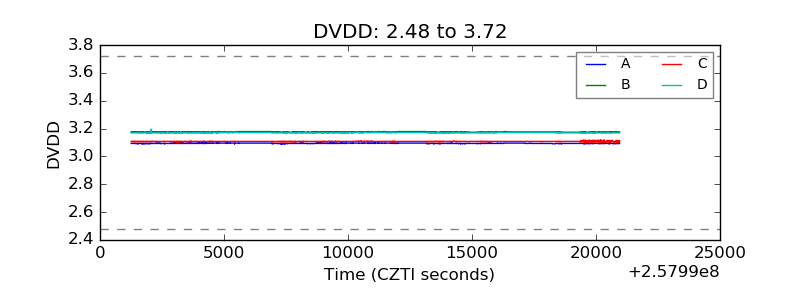 |
| Temperature 1 | 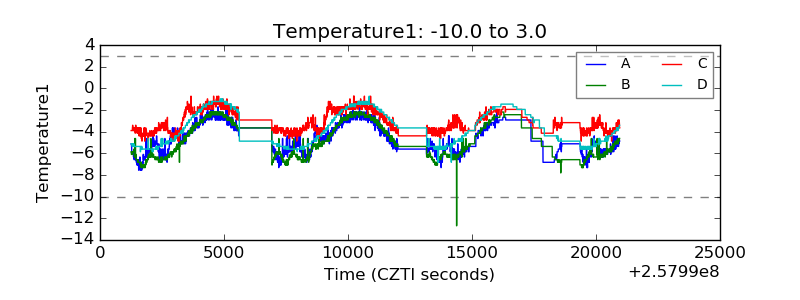 |
| Veto HV Monitor |  |
| Veto LLD | 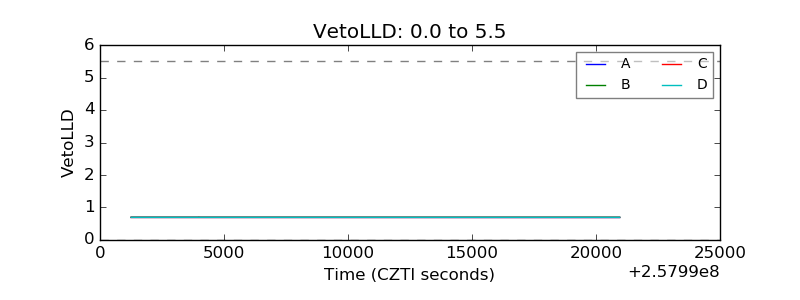 |
| Alpha Counter | 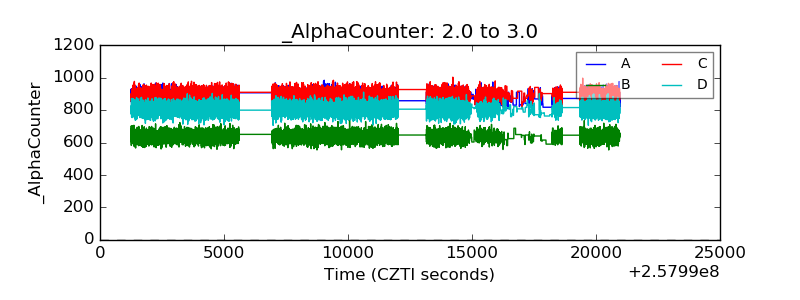 |
| _CPM_Rate | 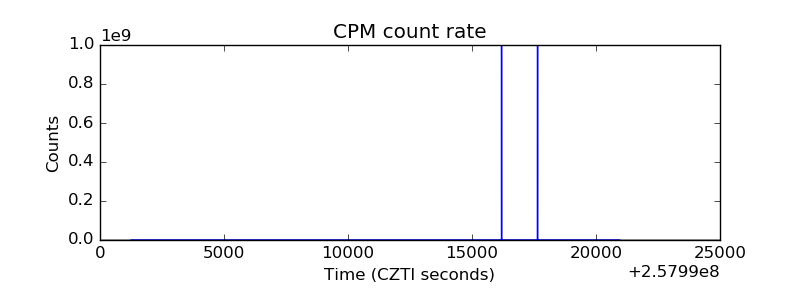 |
| CZT Counter | 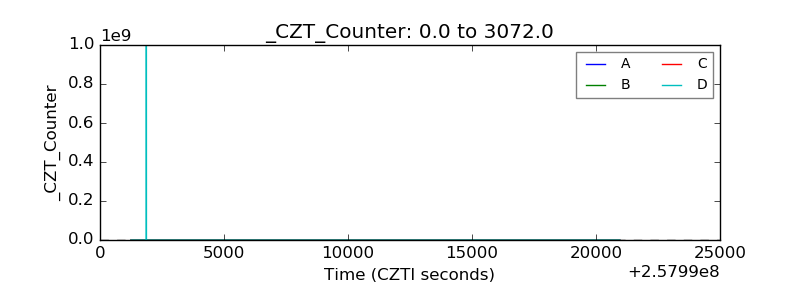 |
| +2.5 Volts monitor | 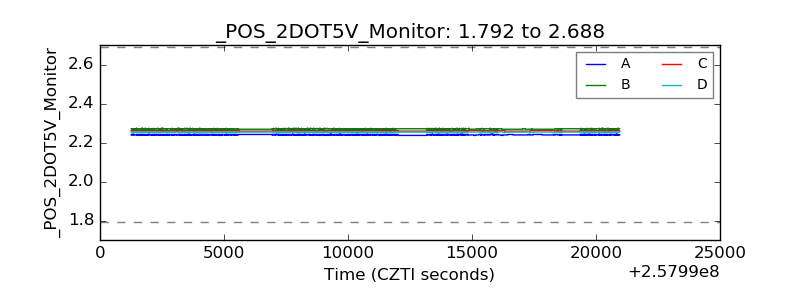 |
| +5 Volts monitor |  |
| _ROLL_ROT | 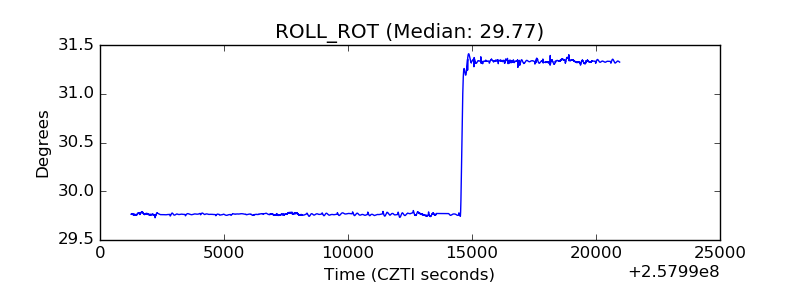 |
| _Roll_DEC | 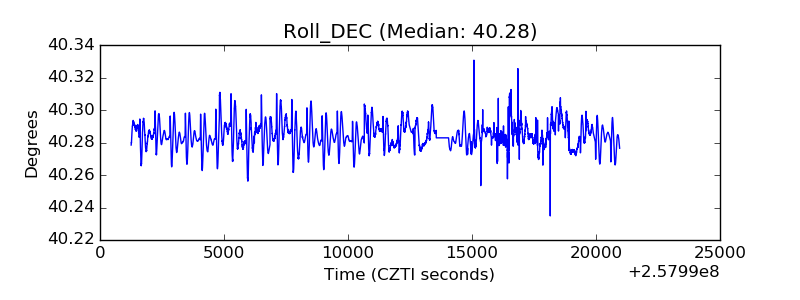 |
| _Roll_RA | 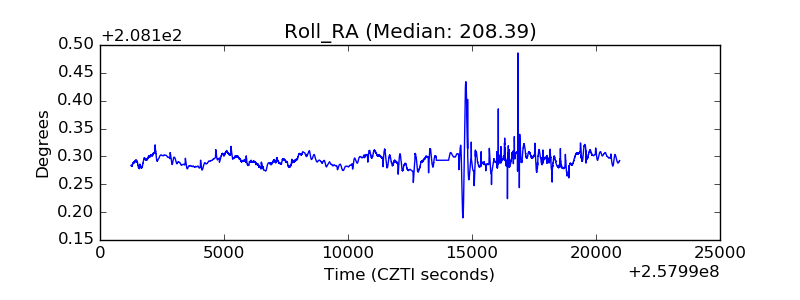 |
| Veto Counter | 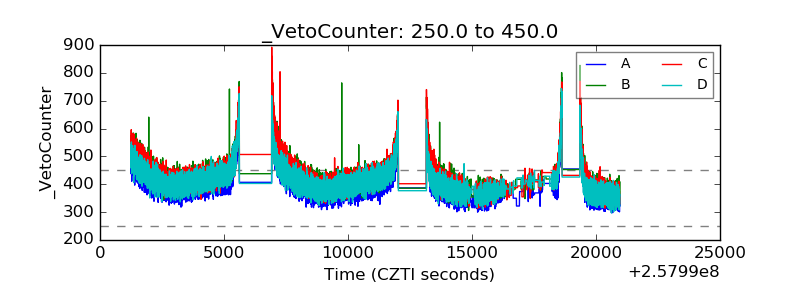 |