| Param | Original file | Final file |
|---|---|---|
| Filename | modeM0/AS1G08_034T01_9000001944_13176cztM0_level2.evt | modeM0/AS1G08_034T01_9000001944_13176cztM0_level2_quad_clean.evt |
| Size (bytes) | 13,639,680 | 2,805,120 |
| Size | 13.0 MB | 2.7 MB |
| Events in quadrant A | 132,824 | 23,512 |
| Events in quadrant B | 71,091 | 9,889 |
| Events in quadrant C | 123,635 | 16,651 |
| Events in quadrant D | 63,450 | 7,307 |
| Mode M0 | |||
|---|---|---|---|
| Quadrant | BADHDUFLAG | Total packets | Discarded packets |
| A | 0 | 7823 | 7264 |
| B | 0 | 9139 | 8838 |
| C | 0 | 7727 | 7162 |
| D | 0 | 8657 | 8383 |
| Mode SS | |||
|---|---|---|---|
| Quadrant | BADHDUFLAG | Total packets | Discarded packets |
| A | 0 | 273359709408 | 0 |
| B | 0 | -1 | -1 |
| C | 0 | -1 | -1 |
| D | 0 | -1 | -1 |
| Mode M9 | |||
|---|---|---|---|
| Quadrant | BADHDUFLAG | Total packets | Discarded packets |
| A | 0 | 13 | 0 |
| B | 0 | 13 | 0 |
| C | 0 | 13 | 0 |
| D | 0 | 13 | 0 |
| Quadrant | Total seconds | Saturated seconds | Saturation percentage |
|---|---|---|---|
| A | 280 | 1 | 0.357143% |
| B | 151 | 1 | 0.662252% |
| C | 283 | 1 | 0.353357% |
| D | 138 | 1 | 0.724638% |
Noise dominated data is calculated using 1-second bins in cleaned event files. If a bin has >2000 counts, and if more than 50% of those come from <1% of pixels, then it is considered to be noise-dominated and hence unusable.
| Quadrant | # 1 sec bins | Bins with >0 counts | Bins with >2000 counts | High rate bins dominated by noise | Noise dominated (total time) | Noise dominated (detector-on time) | Marked lightcurve |
|---|---|---|---|---|---|---|---|
| A | 7621 | 559 | 0 | 0 | 0.00% | 0.00% | 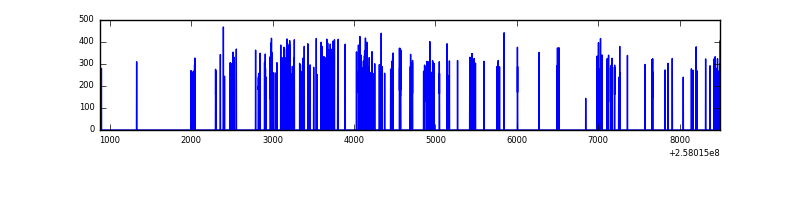 |
| B | 7619 | 301 | 0 | 0 | 0.00% | 0.00% | 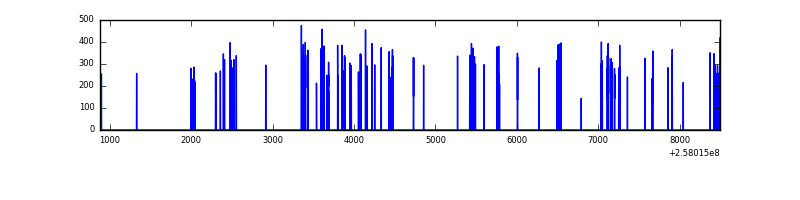 |
| C | 7596 | 565 | 0 | 0 | 0.00% | 0.00% | 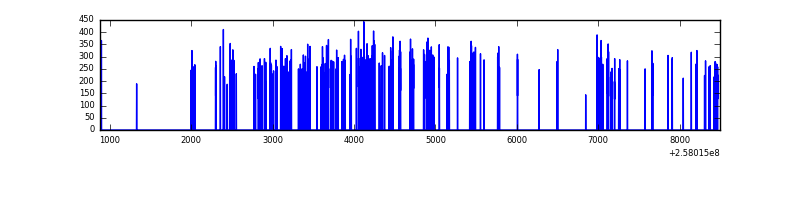 |
| D | 7085 | 275 | 0 | 0 | 0.00% | 0.00% | 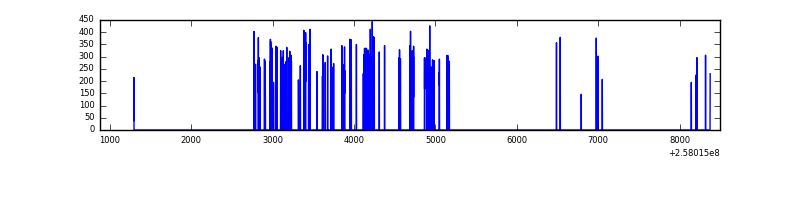 |
Top three noisy pixels from each quadrant. If the there are fewer than three noisy pixels in the level2.evt file, extra rows are filled as -1
| Pixel properties | Quadrant properties | ||||||
|---|---|---|---|---|---|---|---|
| Quadrant | DetID | PixID | Counts | Sigma | Mean | Median | Sigma |
| A | 12 | 189 | 6072 | 700.06 | 32 | 31 | 8.6 |
| A | 1 | 162 | 820 | 91.43 | 32 | 31 | 8.6 |
| A | 15 | 239 | 712 | 78.92 | 32 | 31 | 8.6 |
| B | 4 | 239 | 2054 | 384.3 | 17 | 16 | 5.3 |
| B | 0 | 219 | 433 | 78.63 | 17 | 16 | 5.3 |
| B | 12 | 111 | 392 | 70.9 | 17 | 16 | 5.3 |
| C | 13 | 61 | 220 | 20.54 | 31 | 31 | 9.2 |
| C | 15 | 208 | 132 | 10.98 | 31 | 31 | 9.2 |
| C | 8 | 128 | 125 | 10.21 | 31 | 31 | 9.2 |
| D | 1 | 52 | 3822 | 701.07 | 15 | 14 | 5.4 |
| D | 10 | 157 | 1155 | 210.06 | 15 | 14 | 5.4 |
| D | 2 | 234 | 662 | 119.3 | 15 | 14 | 5.4 |
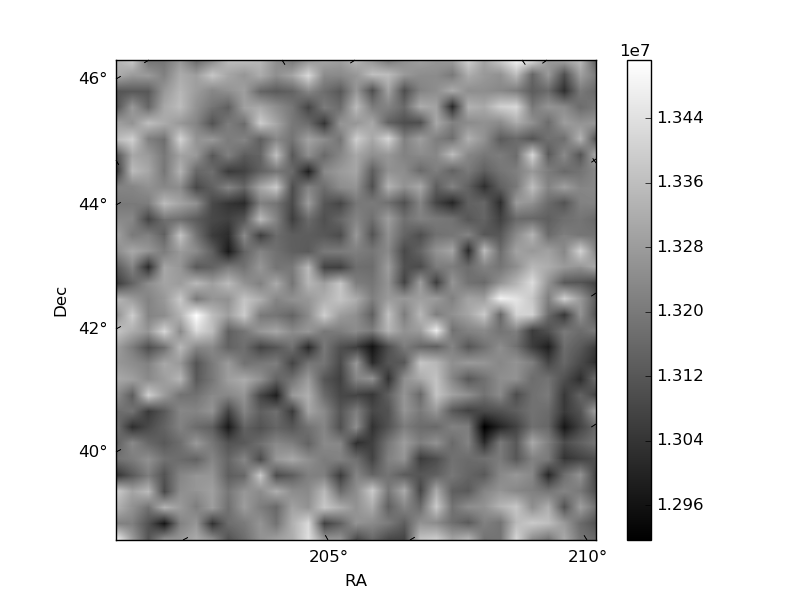
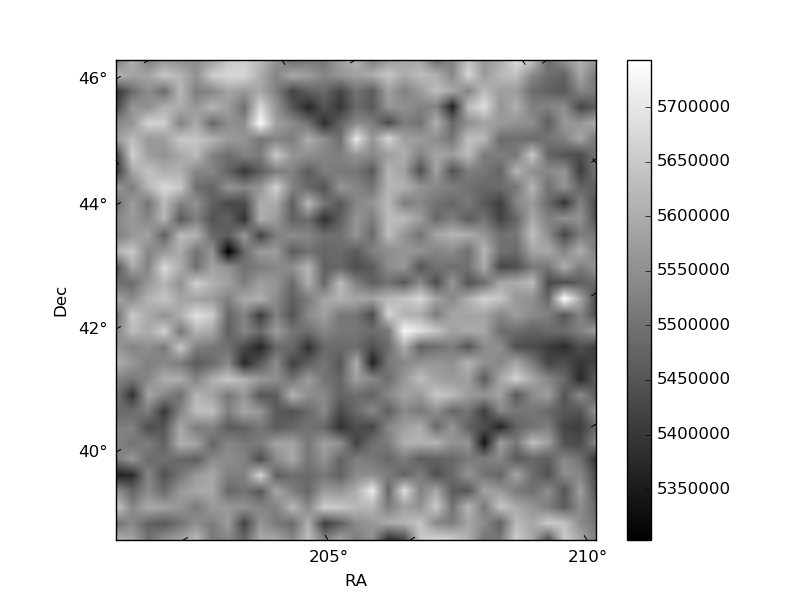
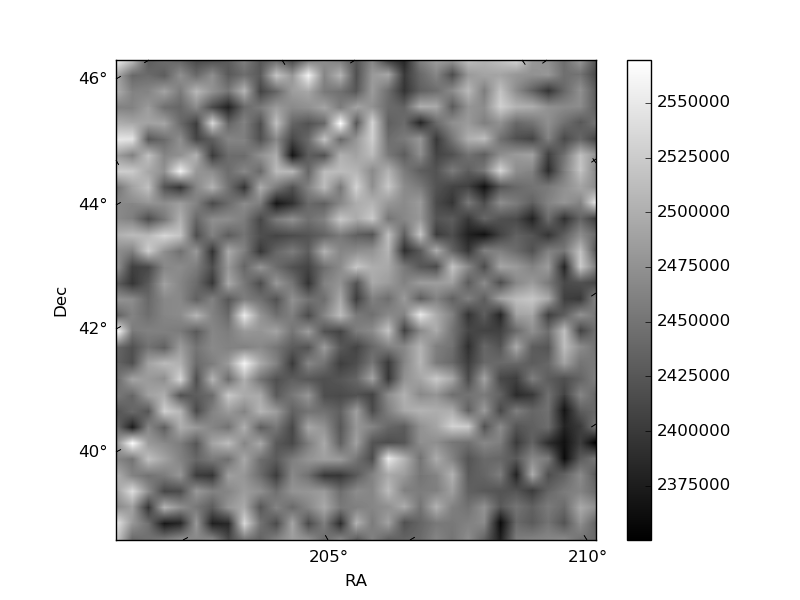
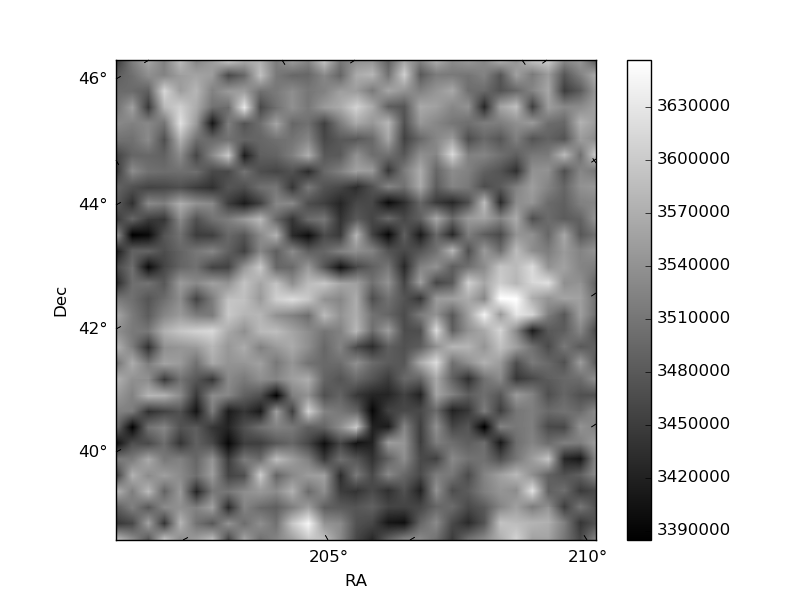
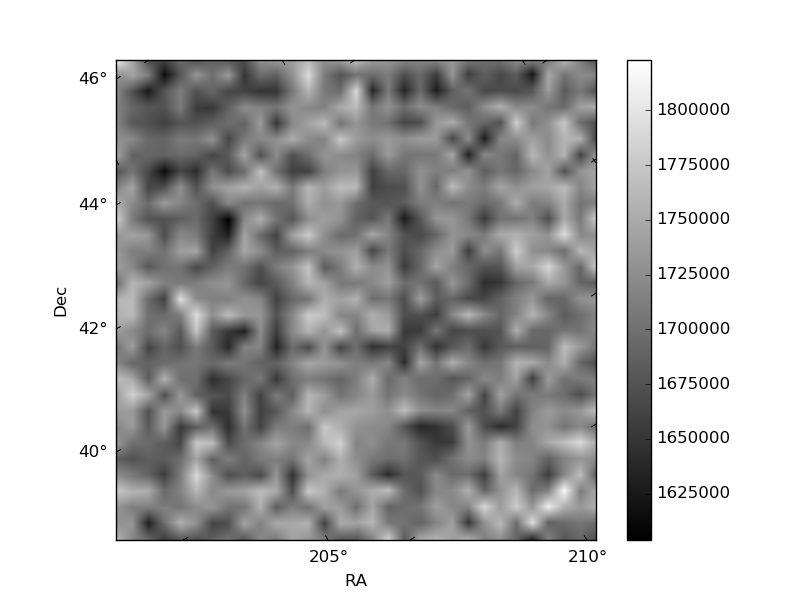
Histogram calculated using DETX and DETY for each event in the final _common_clean file
| Quadrant A | 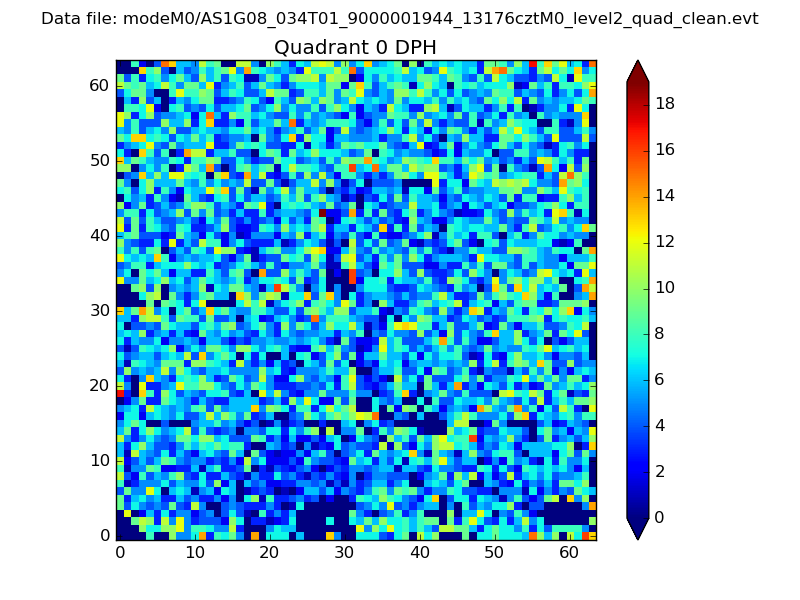 |
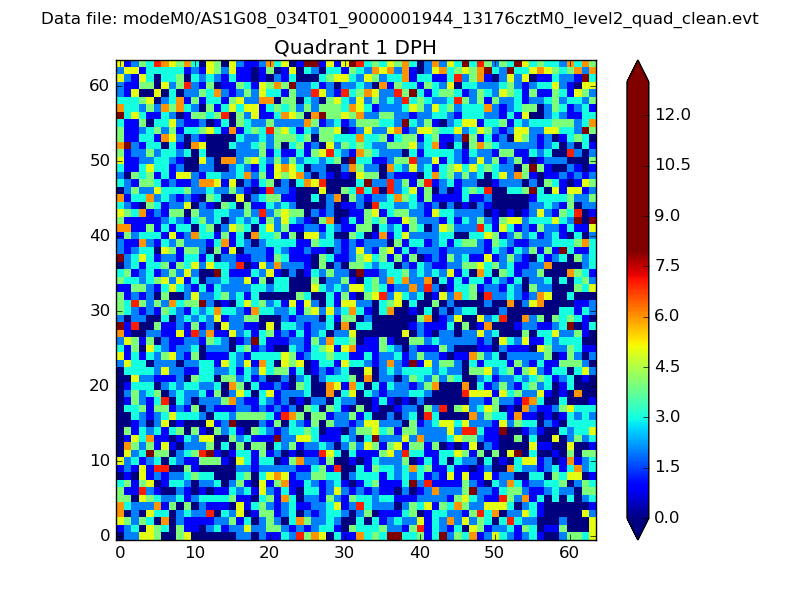 |
Quadrant B |
|---|---|---|---|
| Quadrant D | 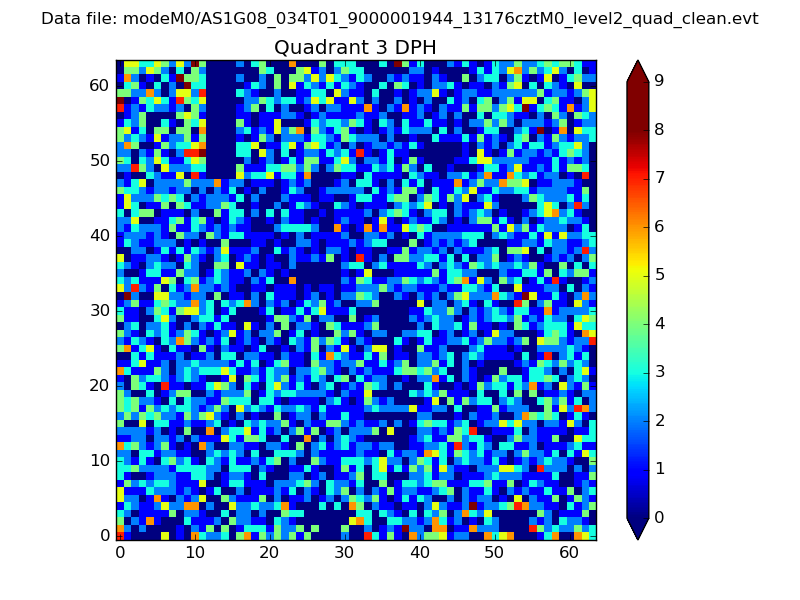 |
 |
Quadrant C |
| Plot type | Count rate plots | Images |
|---|---|---|
| Comparison with Poisson distribution Blue bars denote a histogram of data divided into 1 sec bins. Red curve is a Poisson curve with rate = median count rate of data. |
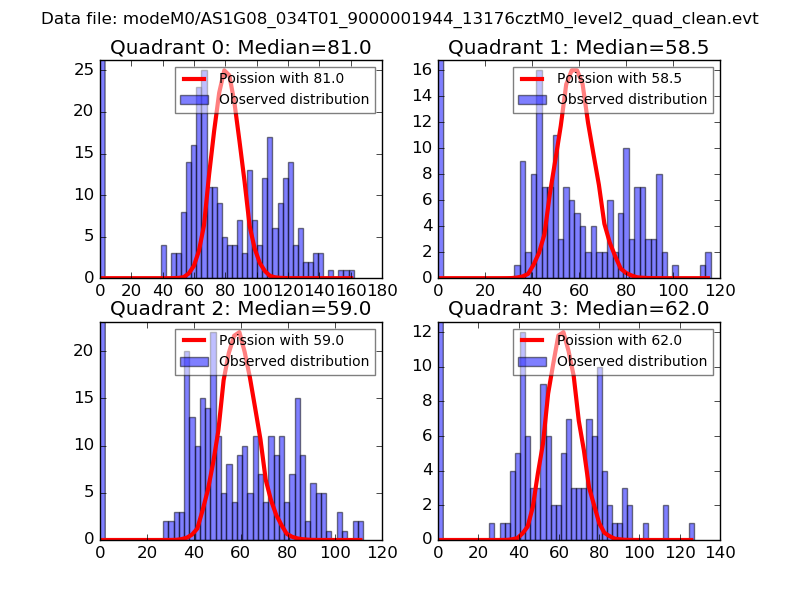 |
 |
| Quadrant-wise count rates Data is divided into 100 sec bins |
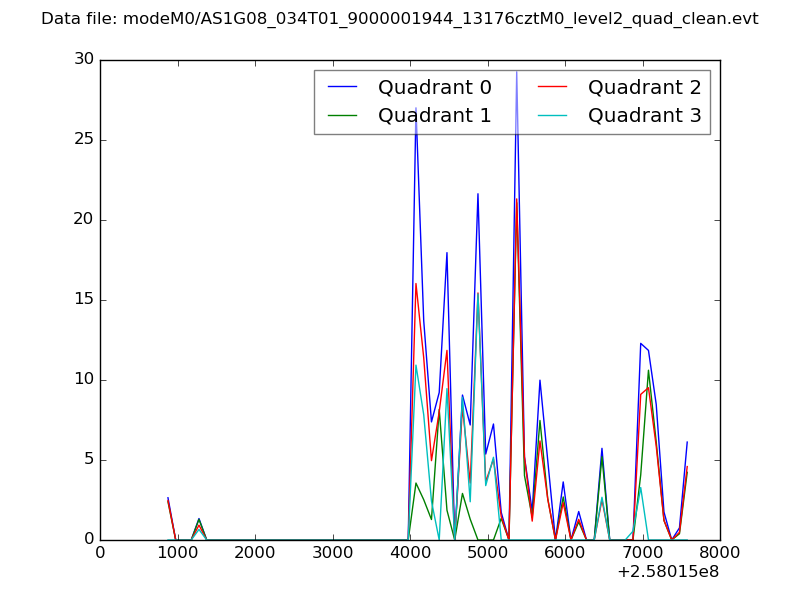 |
|
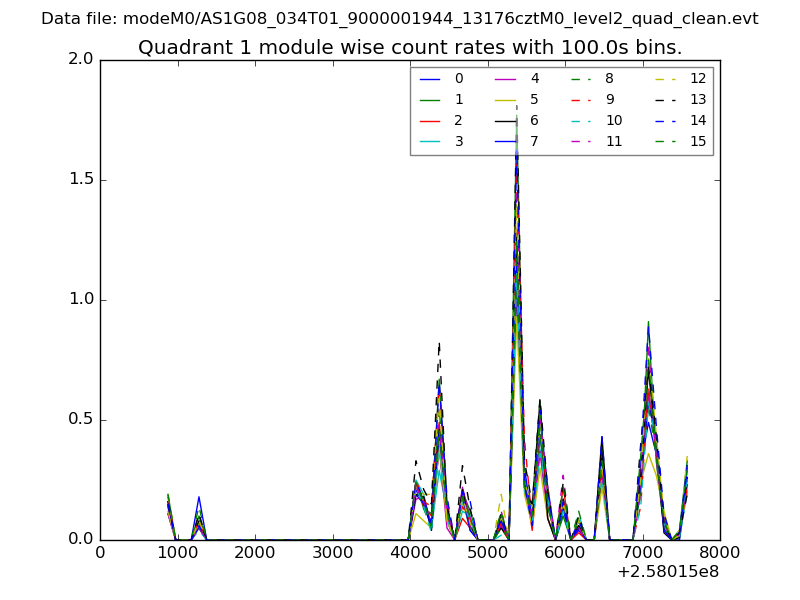
| Module-wise count rates for Quadrant A Data is divided into 100 sec bins |
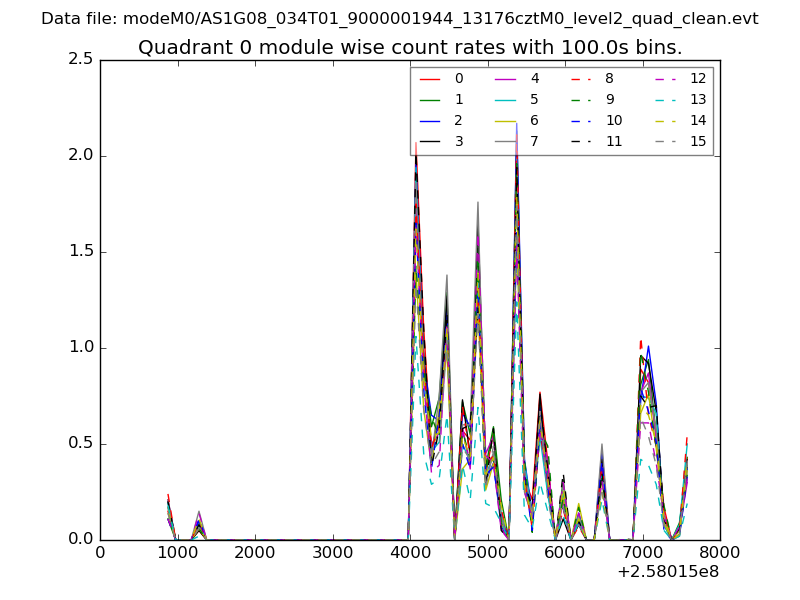 |
 |
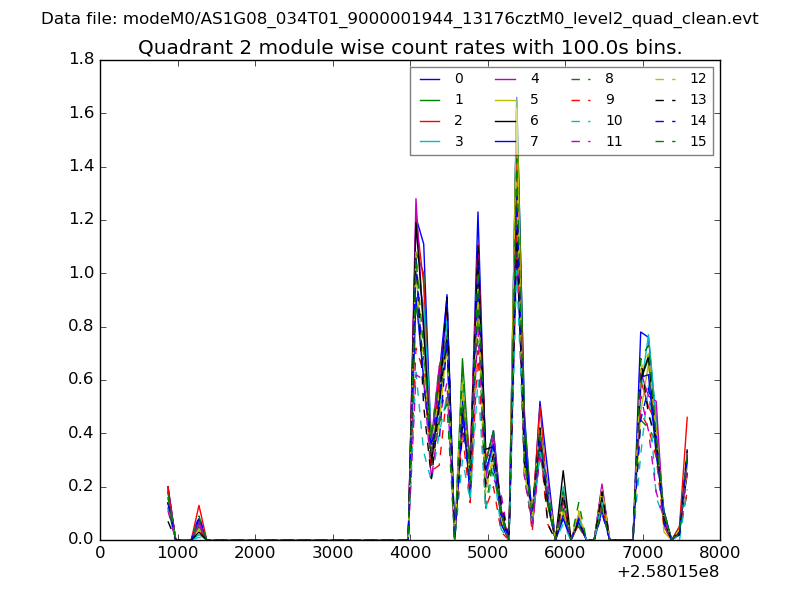
| Module-wise count rates for Quadrant B Data is divided into 100 sec bins |
 |
 |
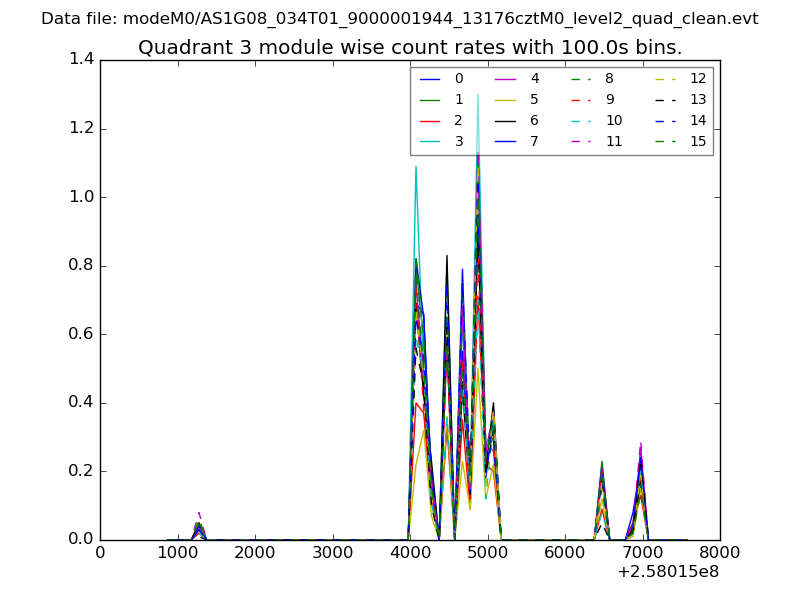
| Module-wise count rates for Quadrant C Data is divided into 100 sec bins |
 |
 |
| Module-wise count rates for Quadrant D Data is divided into 100 sec bins |
 |
 |
| Parameter | Plot |
|---|---|
| CZT HV Monitor | 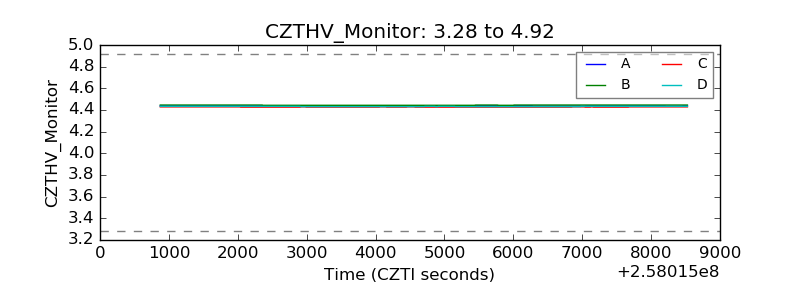 |
| D_VDD | 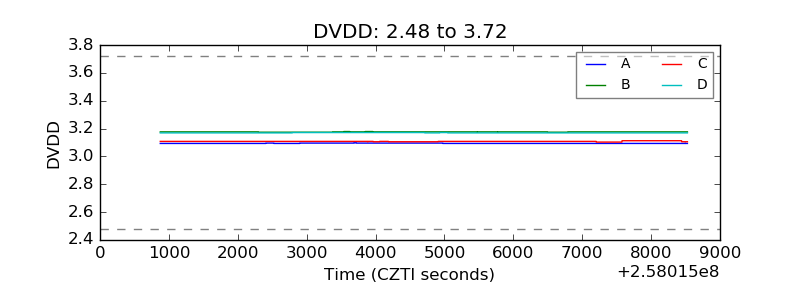 |
| Temperature 1 | 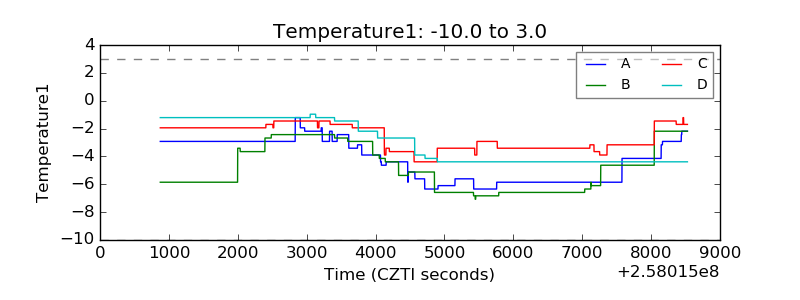 |
| Veto HV Monitor | 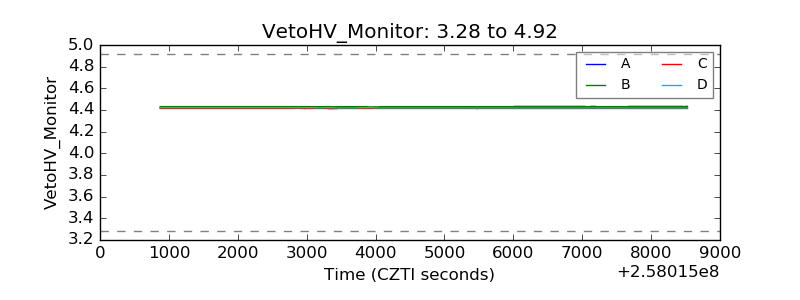 |
| Veto LLD | 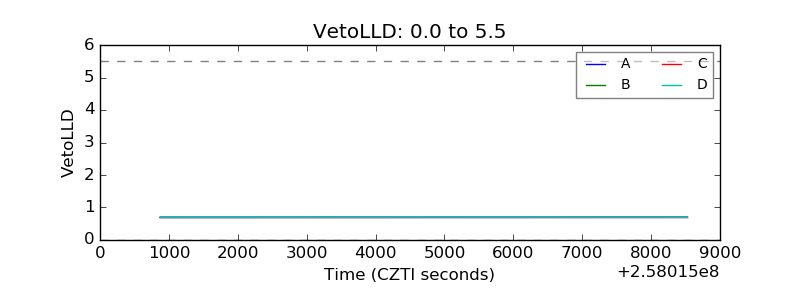 |
| Alpha Counter | 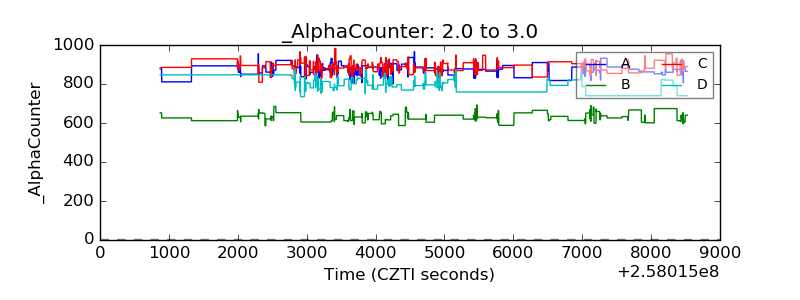 |
| _CPM_Rate | 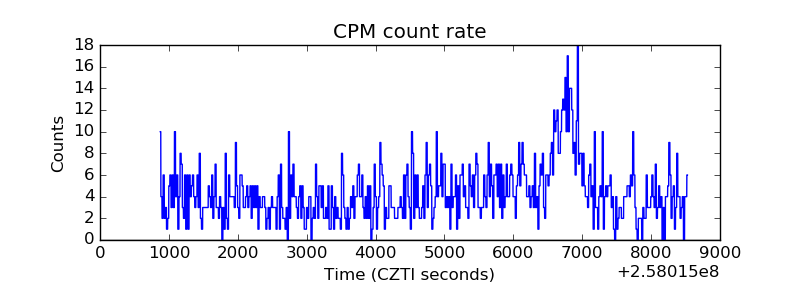 |
| CZT Counter | 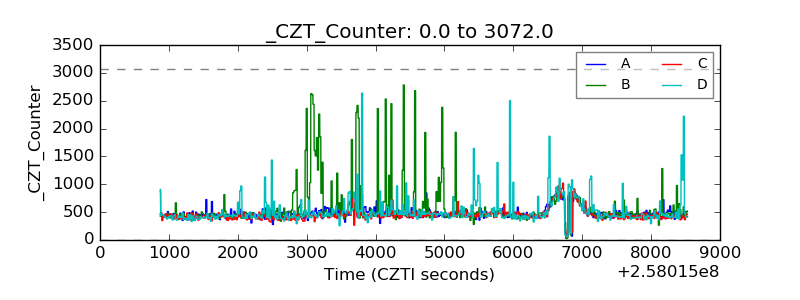 |
| +2.5 Volts monitor | 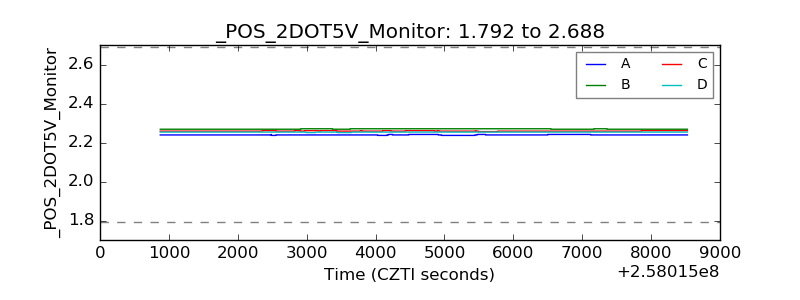 |
| +5 Volts monitor | 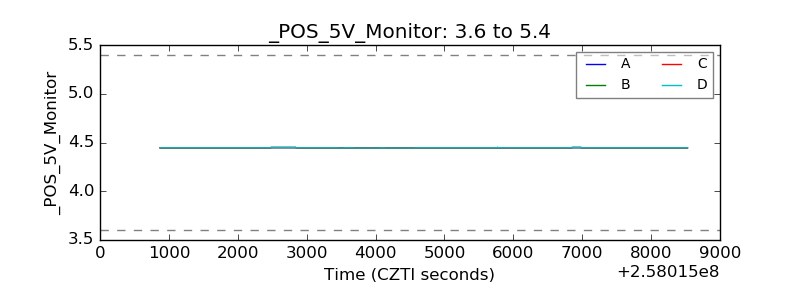 |
| _ROLL_ROT | 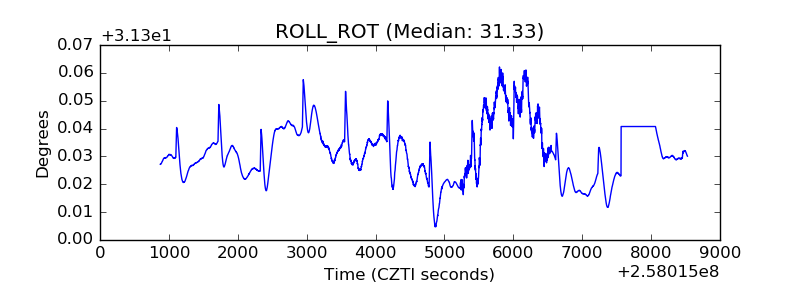 |
| _Roll_DEC | 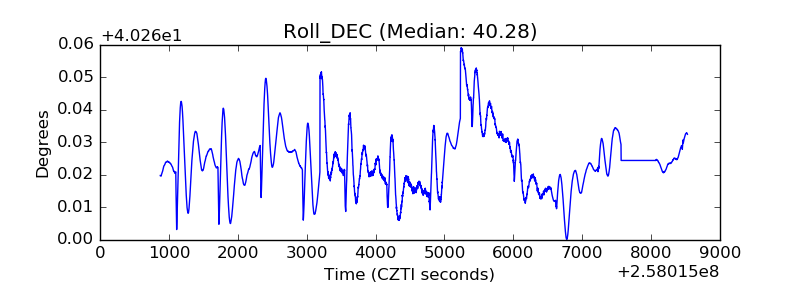 |
| _Roll_RA | 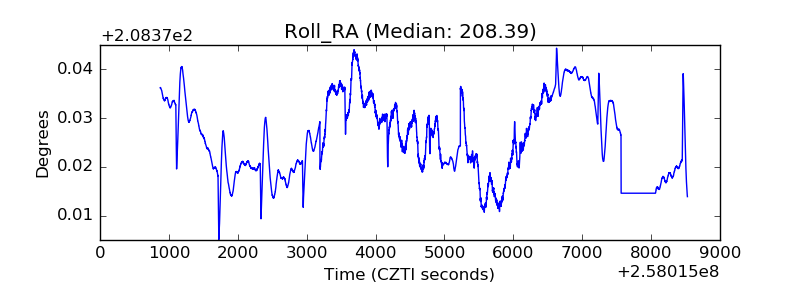 |
| Veto Counter | 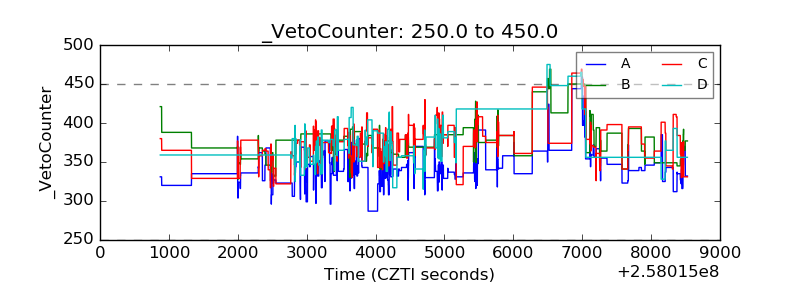 |