| Param | Original file | Final file |
|---|---|---|
| Filename | modeM0/AS1G08_034T01_9000001944_13177cztM0_level2.evt | modeM0/AS1G08_034T01_9000001944_13177cztM0_level2_quad_clean.evt |
| Size (bytes) | 1,798,934,400 | 294,949,440 |
| Size | 1.7 GB | 281.3 MB |
| Events in quadrant A | 12,629,323 | 1,793,406 |
| Events in quadrant B | 15,254,267 | 1,817,162 |
| Events in quadrant C | 11,512,262 | 1,835,813 |
| Events in quadrant D | 13,349,200 | 1,719,219 |
| Mode M0 | |||
|---|---|---|---|
| Quadrant | BADHDUFLAG | Total packets | Discarded packets |
| A | 0 | 54330 | 6 |
| B | 0 | 62439 | 4 |
| C | 0 | 52520 | 4 |
| D | 0 | 57515 | 4 |
| Mode SS | |||
|---|---|---|---|
| Quadrant | BADHDUFLAG | Total packets | Discarded packets |
| A | 0 | 522 | 0 |
| B | 0 | 522 | 0 |
| C | 0 | 522 | 0 |
| D | 0 | 522 | 0 |
| Mode M9 | |||
|---|---|---|---|
| Quadrant | BADHDUFLAG | Total packets | Discarded packets |
| A | 0 | 35 | 0 |
| B | 0 | 35 | 0 |
| C | 0 | 35 | 0 |
| D | 0 | 35 | 0 |
| Quadrant | Total seconds | Saturated seconds | Saturation percentage |
|---|---|---|---|
| A | 25692 | 277 | 1.078157% |
| B | 25692 | 1160 | 4.515024% |
| C | 25692 | 157 | 0.611085% |
| D | 25692 | 496 | 1.930562% |
Noise dominated data is calculated using 1-second bins in cleaned event files. If a bin has >2000 counts, and if more than 50% of those come from <1% of pixels, then it is considered to be noise-dominated and hence unusable.
| Quadrant | # 1 sec bins | Bins with >0 counts | Bins with >2000 counts | High rate bins dominated by noise | Noise dominated (total time) | Noise dominated (detector-on time) | Marked lightcurve |
|---|---|---|---|---|---|---|---|
| A | 38473 | 25698 | 6 | 6 | 0.02% | 0.02% | 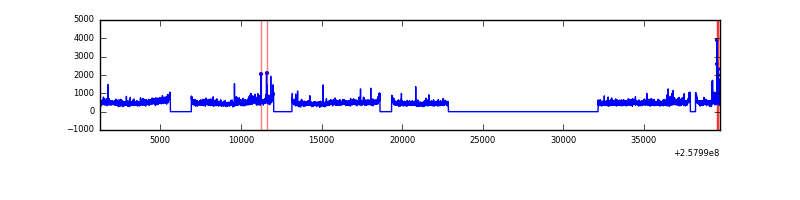 |
| B | 38473 | 25698 | 604 | 604 | 1.57% | 2.35% | 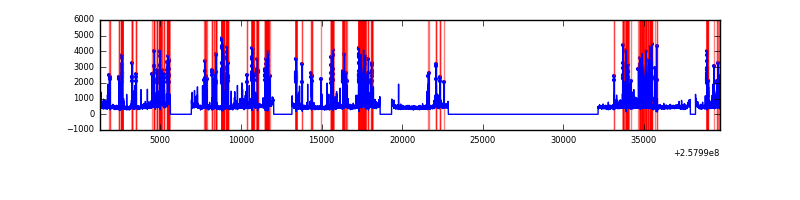 |
| C | 38473 | 25698 | 6 | 6 | 0.02% | 0.02% | 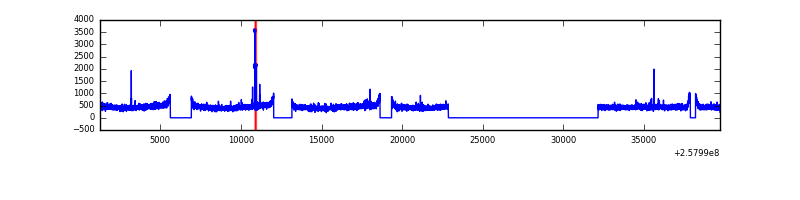 |
| D | 38473 | 25698 | 218 | 218 | 0.57% | 0.85% | 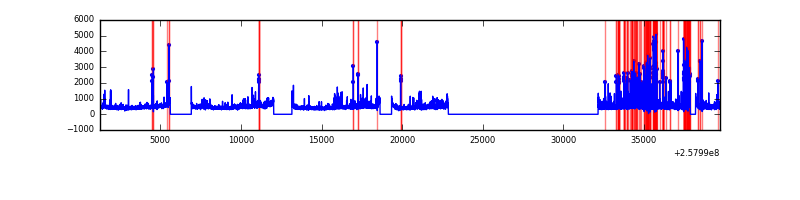 |
Top three noisy pixels from each quadrant. If the there are fewer than three noisy pixels in the level2.evt file, extra rows are filled as -1
| Pixel properties | Quadrant properties | ||||||
|---|---|---|---|---|---|---|---|
| Quadrant | DetID | PixID | Counts | Sigma | Mean | Median | Sigma |
| A | 12 | 189 | 727088 | 1183.82 | 3024 | 2959 | 611.7 |
| A | 1 | 162 | 81702 | 128.73 | 3024 | 2959 | 611.7 |
| A | 0 | 23 | 56155 | 86.97 | 3024 | 2959 | 611.7 |
| B | 4 | 239 | 2611182 | 4636.75 | 2983 | 2907 | 562.5 |
| B | 0 | 230 | 257825 | 453.17 | 2983 | 2907 | 562.5 |
| B | 5 | 32 | 161056 | 281.14 | 2983 | 2907 | 562.5 |
| C | 15 | 208 | 67390 | 95.8 | 2929 | 2940 | 672.7 |
| C | 13 | 61 | 21511 | 27.61 | 2929 | 2940 | 672.7 |
| C | 8 | 128 | 20812 | 26.57 | 2929 | 2940 | 672.7 |
| D | 1 | 52 | 1633393 | 2354.59 | 2892 | 2807 | 692.5 |
| D | 8 | 195 | 332749 | 476.44 | 2892 | 2807 | 692.5 |
| D | 10 | 157 | 180761 | 256.97 | 2892 | 2807 | 692.5 |
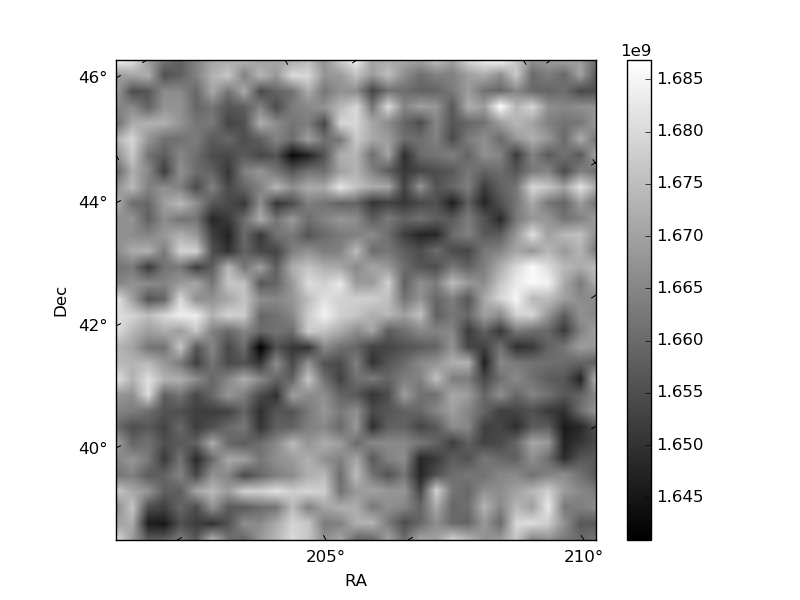
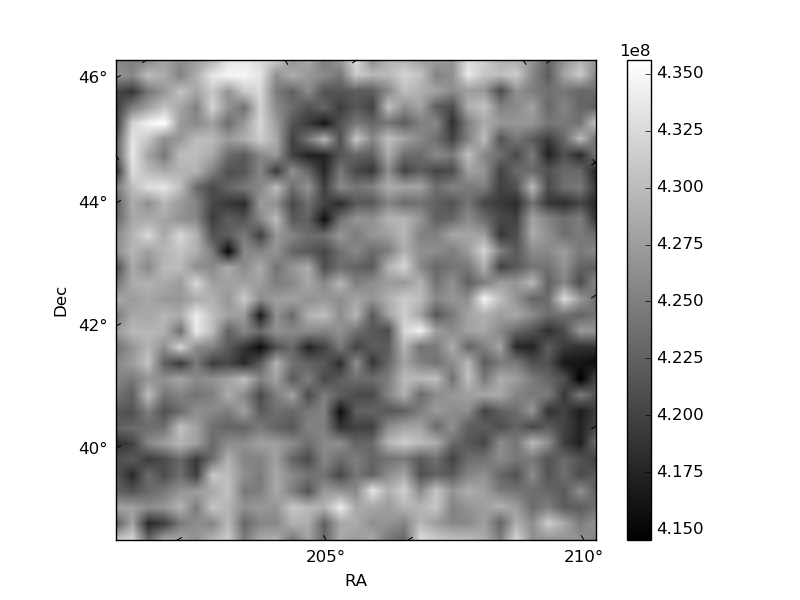
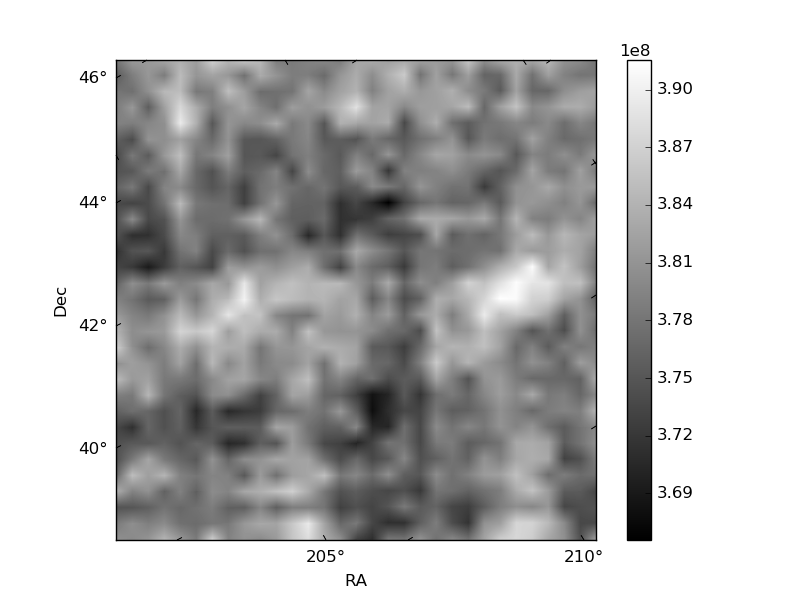
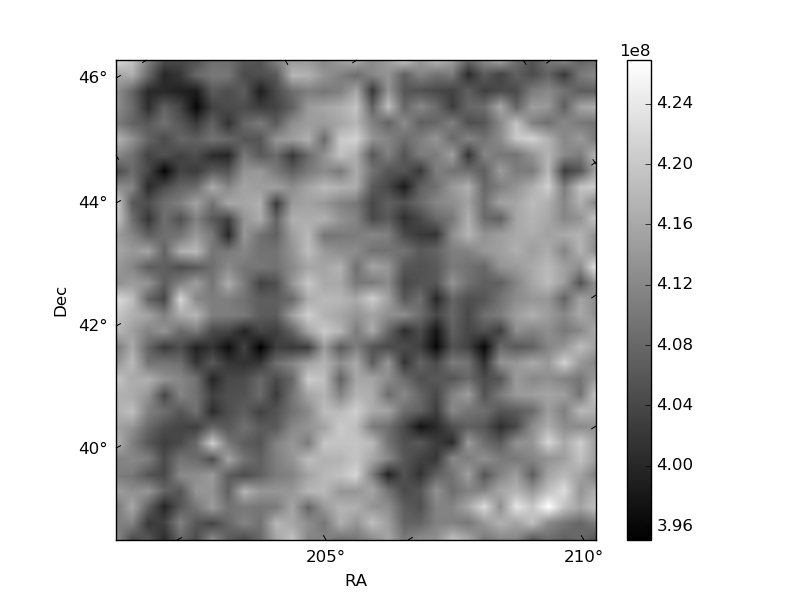
Histogram calculated using DETX and DETY for each event in the final _common_clean file
| Quadrant A | 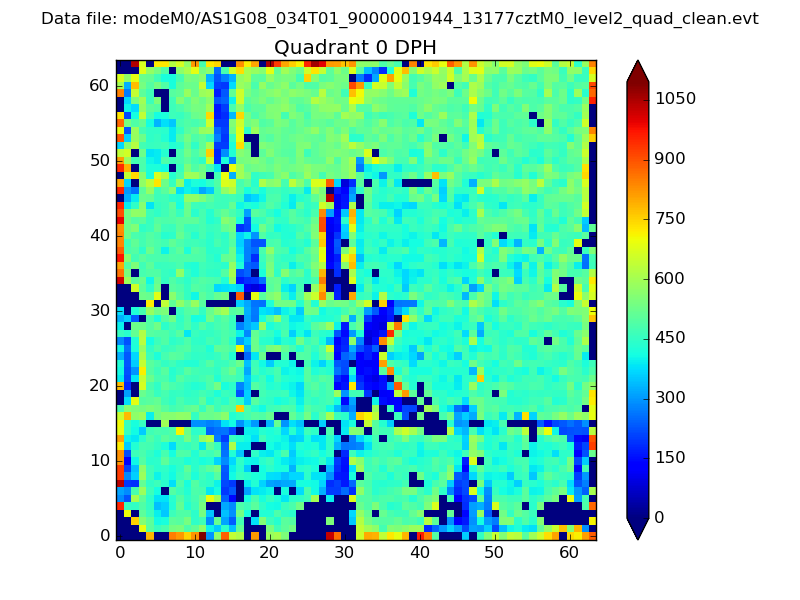 |
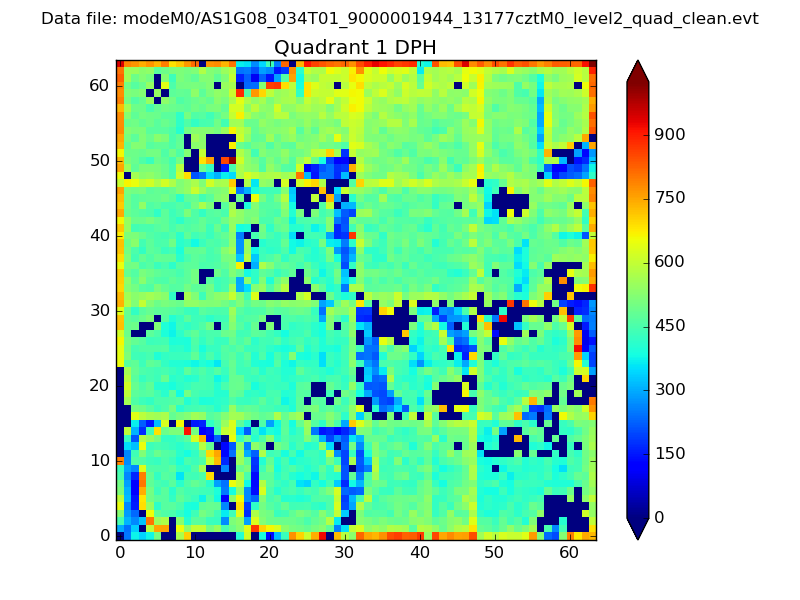 |
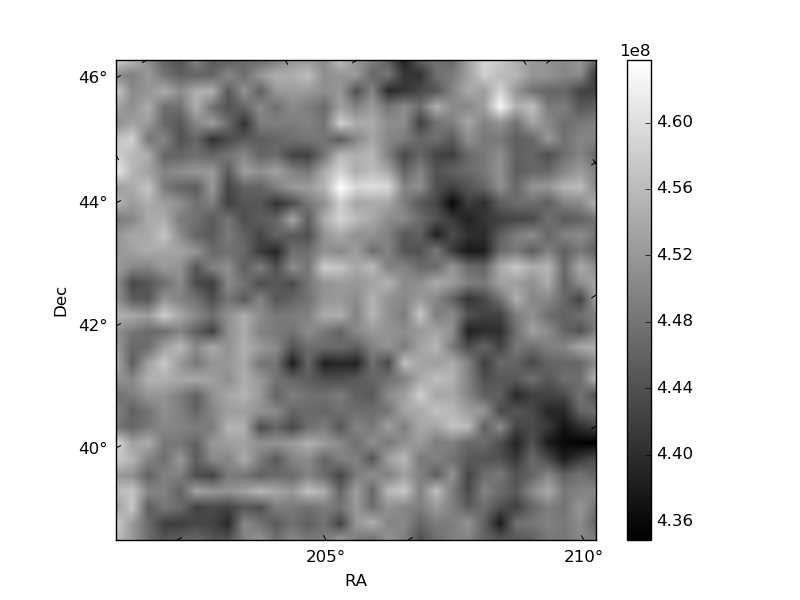
Quadrant B |
|---|---|---|---|
| Quadrant D | 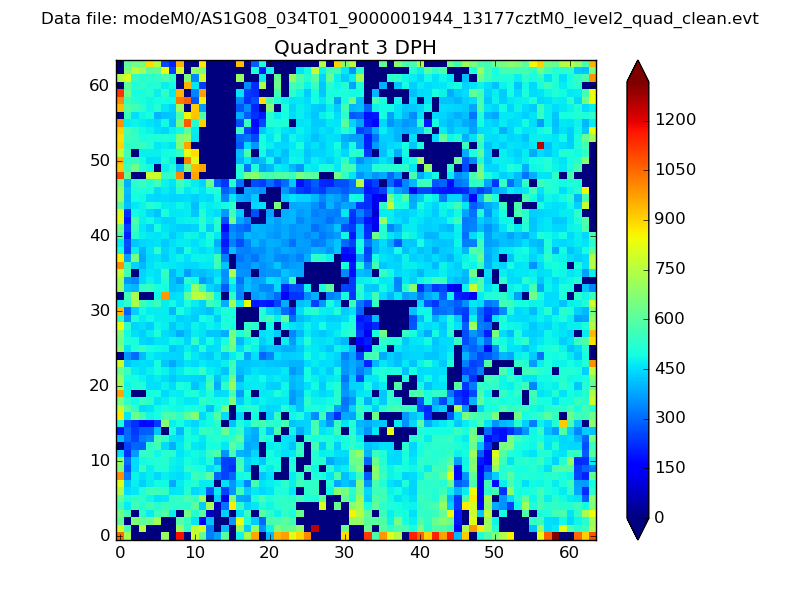 |
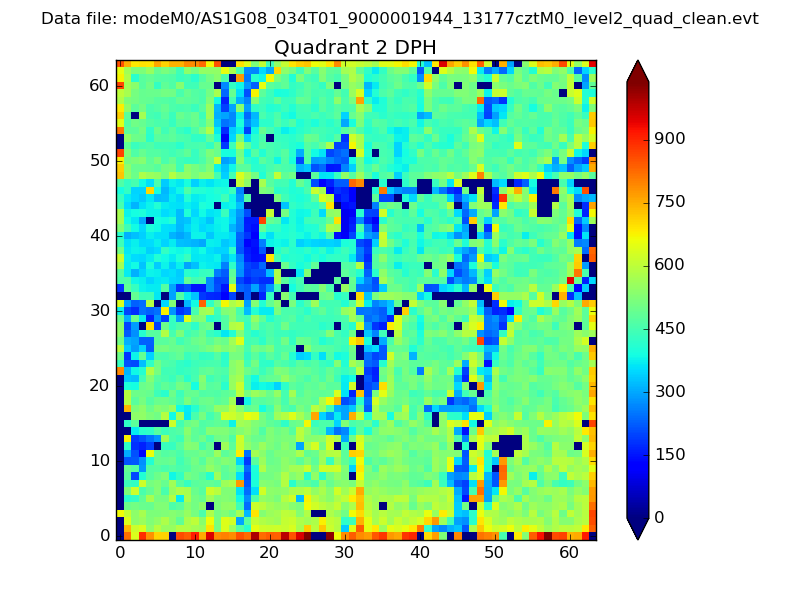 |
Quadrant C |
| Plot type | Count rate plots | Images |
|---|---|---|
| Comparison with Poisson distribution Blue bars denote a histogram of data divided into 1 sec bins. Red curve is a Poisson curve with rate = median count rate of data. |
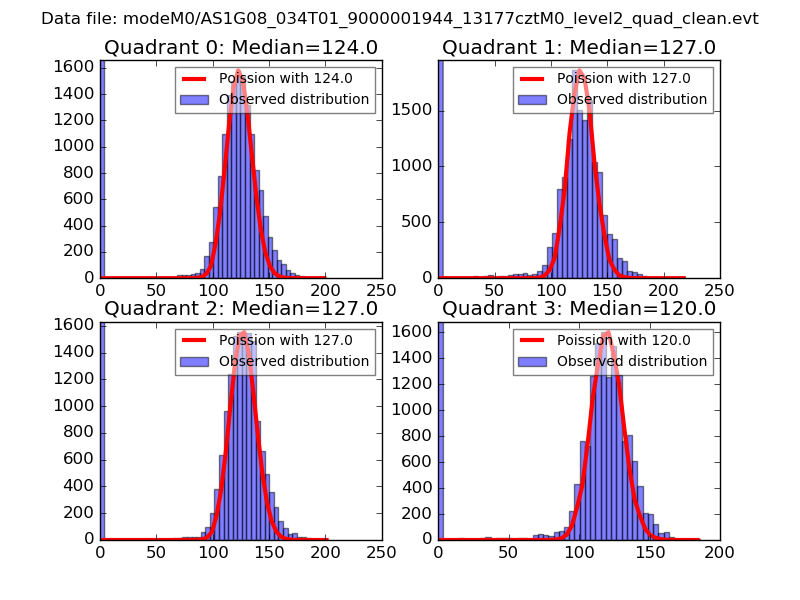 |
 |
| Quadrant-wise count rates Data is divided into 100 sec bins |
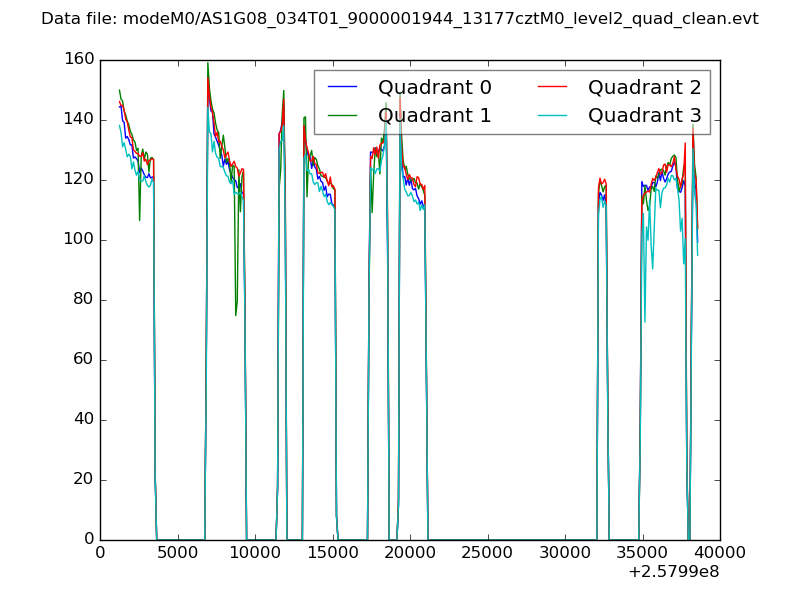 |
|
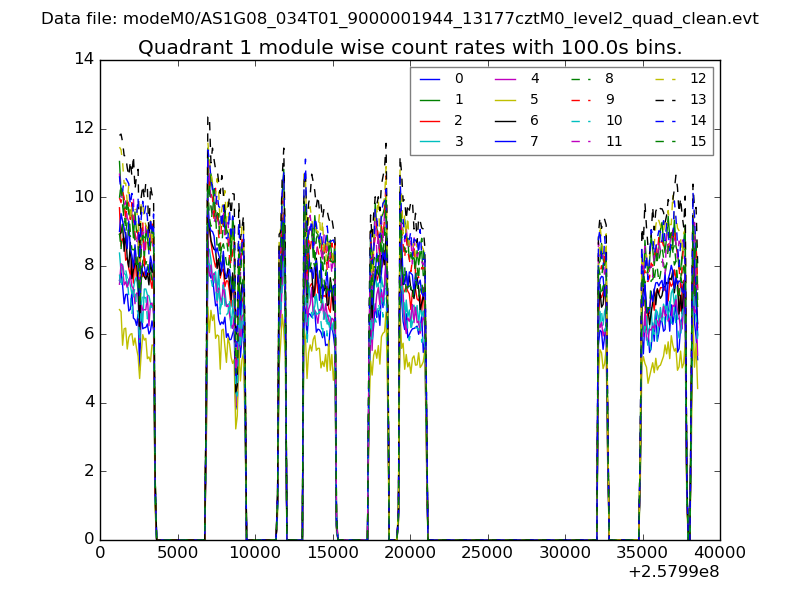
| Module-wise count rates for Quadrant A Data is divided into 100 sec bins |
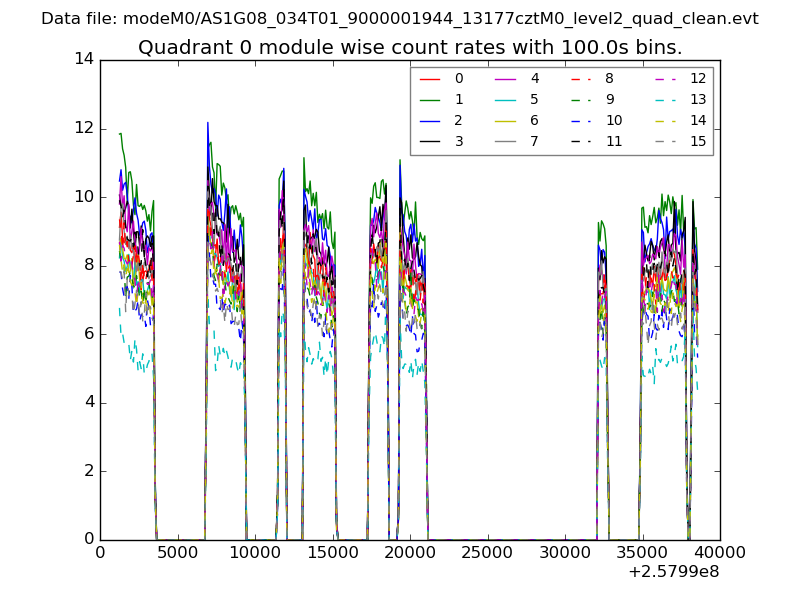 |
 |
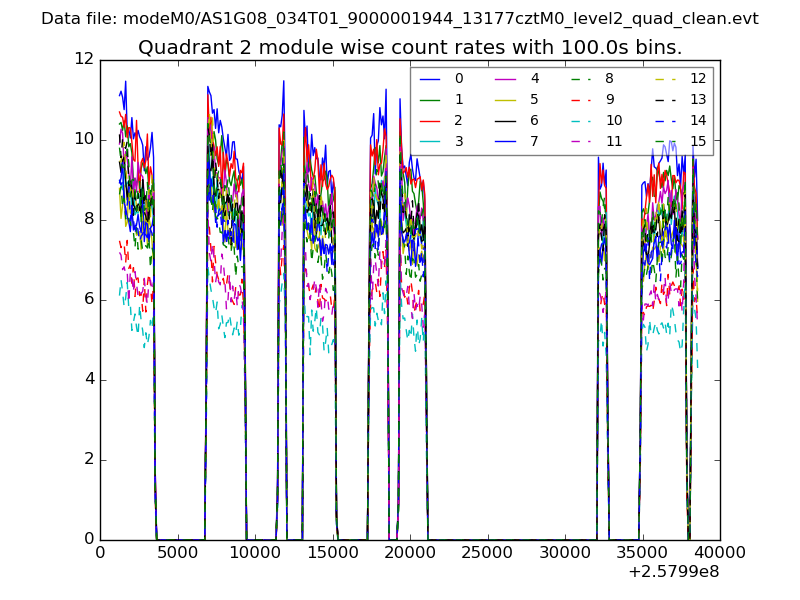
| Module-wise count rates for Quadrant B Data is divided into 100 sec bins |
 |
 |
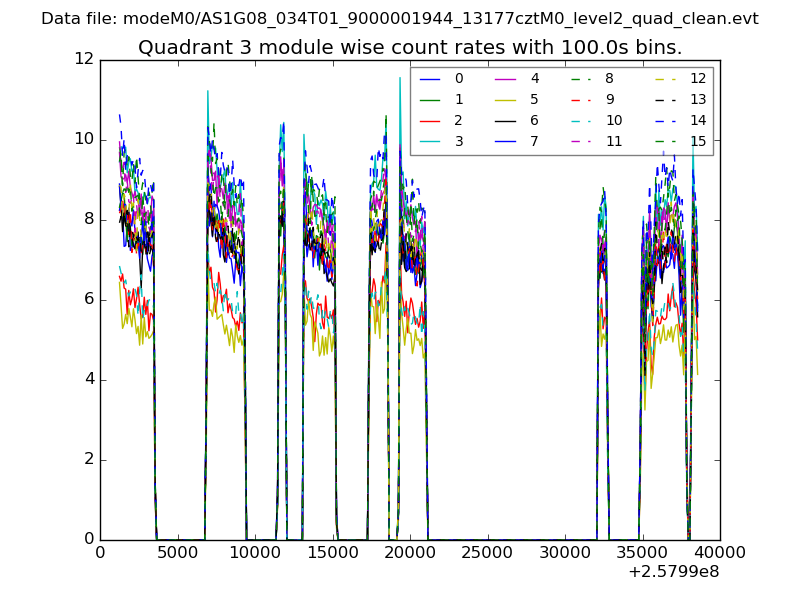
| Module-wise count rates for Quadrant C Data is divided into 100 sec bins |
 |
 |
| Module-wise count rates for Quadrant D Data is divided into 100 sec bins |
 |
 |
| Parameter | Plot |
|---|---|
| CZT HV Monitor | 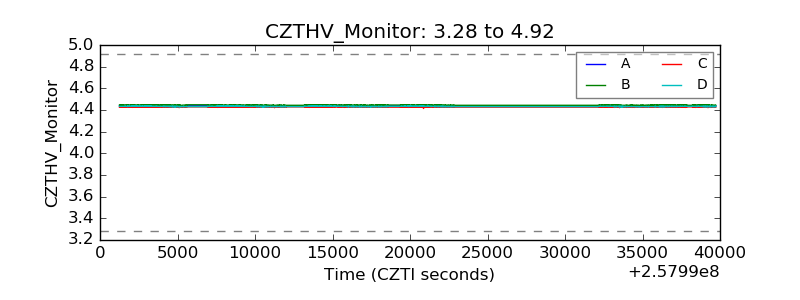 |
| D_VDD | 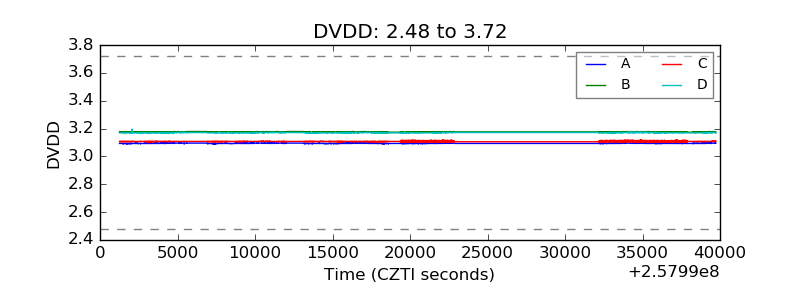 |
| Temperature 1 | 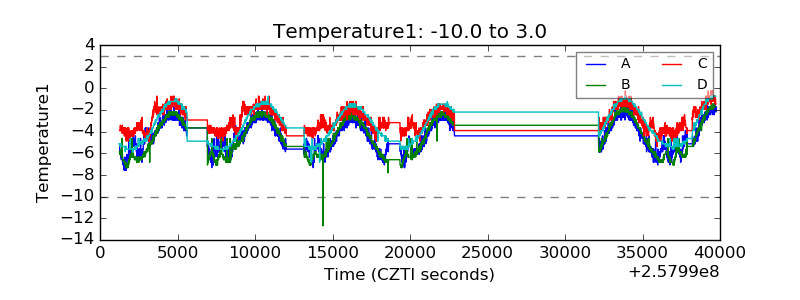 |
| Veto HV Monitor |  |
| Veto LLD | 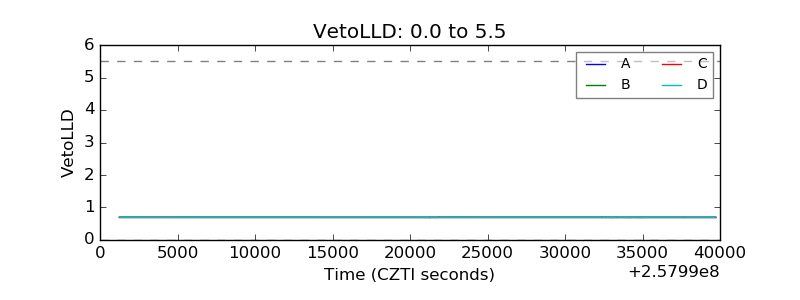 |
| Alpha Counter | 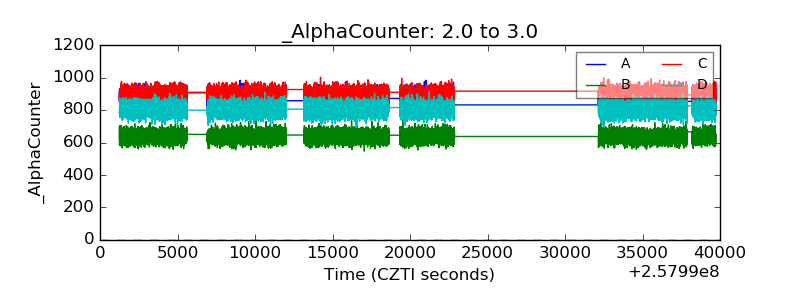 |
| _CPM_Rate |  |
| CZT Counter | 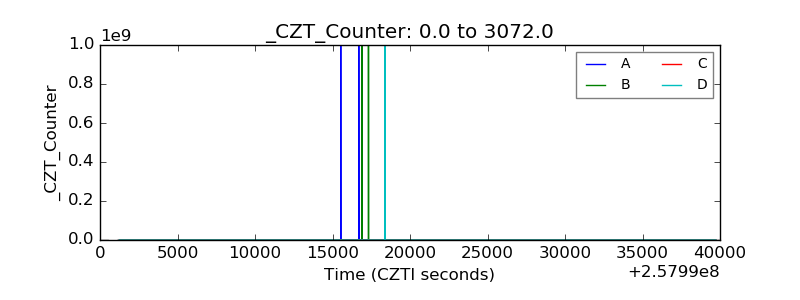 |
| +2.5 Volts monitor | 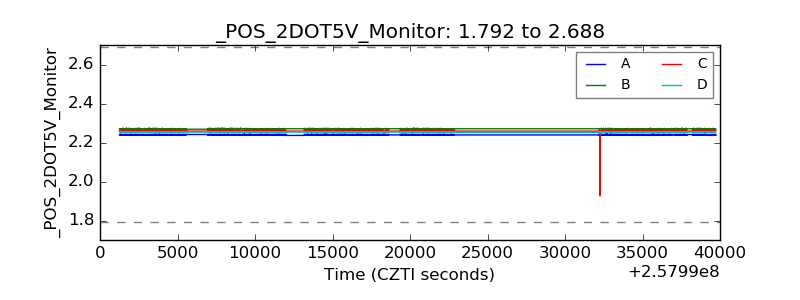 |
| +5 Volts monitor |  |
| _ROLL_ROT | 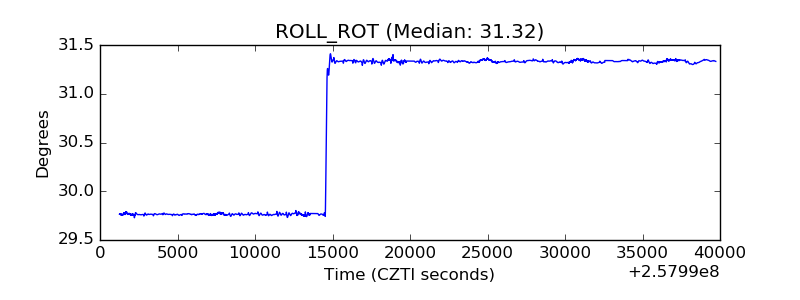 |
| _Roll_DEC | 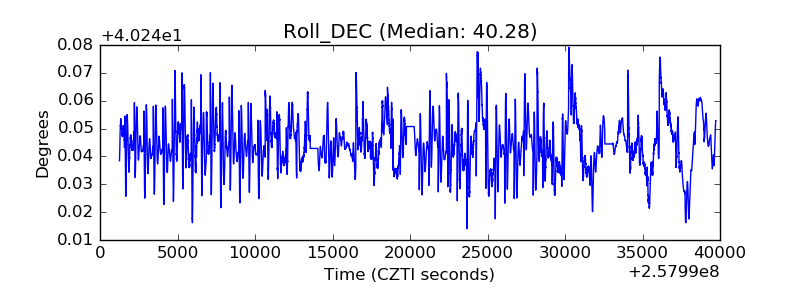 |
| _Roll_RA | 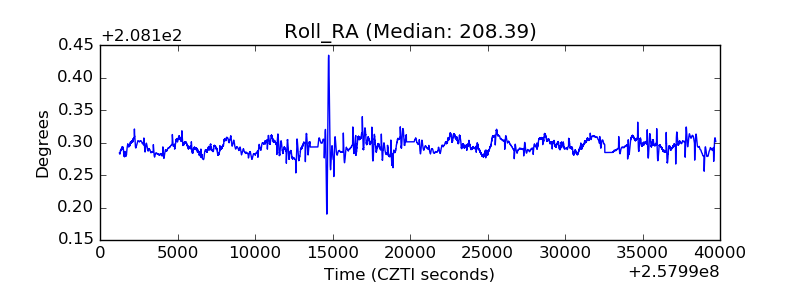 |
| Veto Counter | 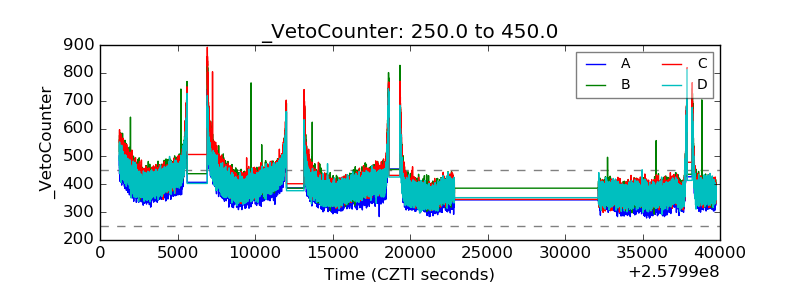 |