| Param | Original file | Final file |
|---|---|---|
| Filename | modeM0/AS1G08_034T01_9000001944_13179cztM0_level2.evt | modeM0/AS1G08_034T01_9000001944_13179cztM0_level2_quad_clean.evt |
| Size (bytes) | 320,051,520 | 35,352,000 |
| Size | 305.2 MB | 33.7 MB |
| Events in quadrant A | 2,835,820 | 196,321 |
| Events in quadrant B | 2,314,626 | 206,644 |
| Events in quadrant C | 1,741,122 | 206,761 |
| Events in quadrant D | 2,539,154 | 188,609 |
| Mode M0 | |||
|---|---|---|---|
| Quadrant | BADHDUFLAG | Total packets | Discarded packets |
| A | 0 | 10935 | 1 |
| B | 0 | 9379 | 1 |
| C | 0 | 7946 | 1 |
| D | 0 | 10132 | 1 |
| Mode SS | |||
|---|---|---|---|
| Quadrant | BADHDUFLAG | Total packets | Discarded packets |
| A | 0 | 76 | 0 |
| B | 0 | 76 | 0 |
| C | 0 | 76 | 0 |
| D | 0 | 76 | 0 |
| Mode M9 | |||
|---|---|---|---|
| Quadrant | BADHDUFLAG | Total packets | Discarded packets |
| A | 0 | 4 | 0 |
| B | 0 | 4 | 0 |
| C | 0 | 4 | 0 |
| D | 0 | 4 | 0 |
| Quadrant | Total seconds | Saturated seconds | Saturation percentage |
|---|---|---|---|
| A | 3850 | 312 | 8.103896% |
| B | 3850 | 232 | 6.025974% |
| C | 3850 | 92 | 2.389610% |
| D | 3850 | 209 | 5.428571% |
Noise dominated data is calculated using 1-second bins in cleaned event files. If a bin has >2000 counts, and if more than 50% of those come from <1% of pixels, then it is considered to be noise-dominated and hence unusable.
| Quadrant | # 1 sec bins | Bins with >0 counts | Bins with >2000 counts | High rate bins dominated by noise | Noise dominated (total time) | Noise dominated (detector-on time) | Marked lightcurve |
|---|---|---|---|---|---|---|---|
| A | 4176 | 3852 | 143 | 143 | 3.42% | 3.71% | 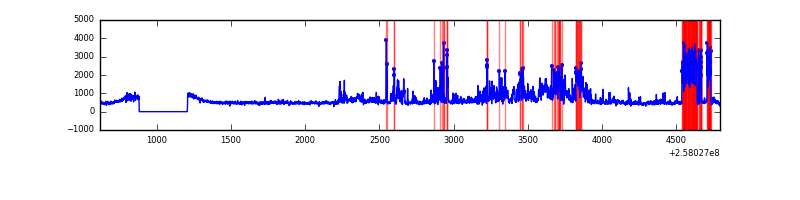 |
| B | 4176 | 3852 | 69 | 69 | 1.65% | 1.79% | 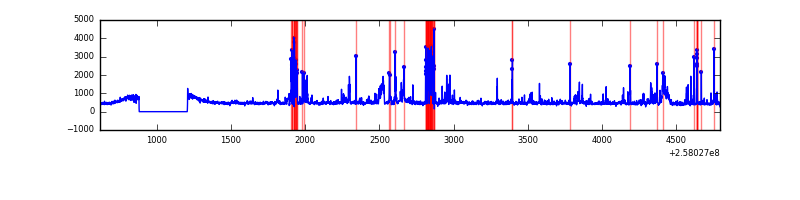 |
| C | 4176 | 3852 | 0 | 0 | 0.00% | 0.00% | 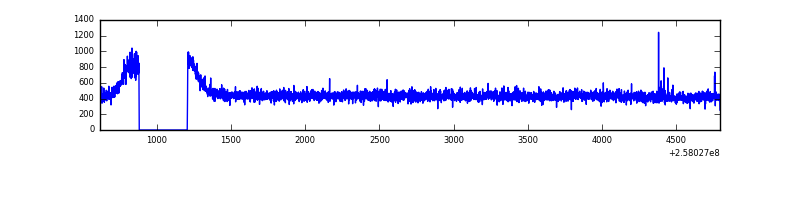 |
| D | 4176 | 3852 | 90 | 90 | 2.16% | 2.34% | 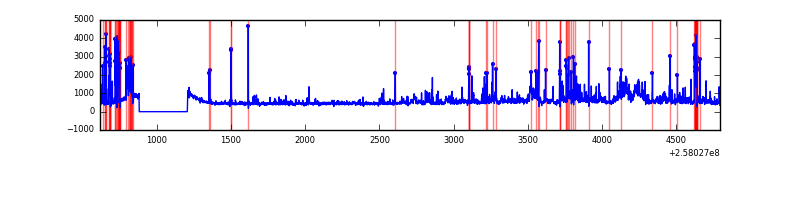 |
Top three noisy pixels from each quadrant. If the there are fewer than three noisy pixels in the level2.evt file, extra rows are filled as -1
| Pixel properties | Quadrant properties | ||||||
|---|---|---|---|---|---|---|---|
| Quadrant | DetID | PixID | Counts | Sigma | Mean | Median | Sigma |
| A | 12 | 189 | 425959 | 4471.89 | 455 | 443 | 95.2 |
| A | 0 | 23 | 274245 | 2877.48 | 455 | 443 | 95.2 |
| A | 12 | 173 | 176089 | 1845.92 | 455 | 443 | 95.2 |
| B | 4 | 239 | 377973 | 4235.77 | 451 | 439 | 89.1 |
| B | 3 | 64 | 43074 | 478.35 | 451 | 439 | 89.1 |
| B | 0 | 230 | 33010 | 365.43 | 451 | 439 | 89.1 |
| C | 15 | 208 | 5166 | 45.03 | 445 | 445 | 104.8 |
| C | 13 | 61 | 3358 | 27.78 | 445 | 445 | 104.8 |
| C | 3 | 202 | 1104 | 6.29 | 445 | 445 | 104.8 |
| D | 1 | 52 | 401646 | 3751.06 | 436 | 422 | 107.0 |
| D | 13 | 122 | 179981 | 1678.7 | 436 | 422 | 107.0 |
| D | 10 | 157 | 134641 | 1254.82 | 436 | 422 | 107.0 |
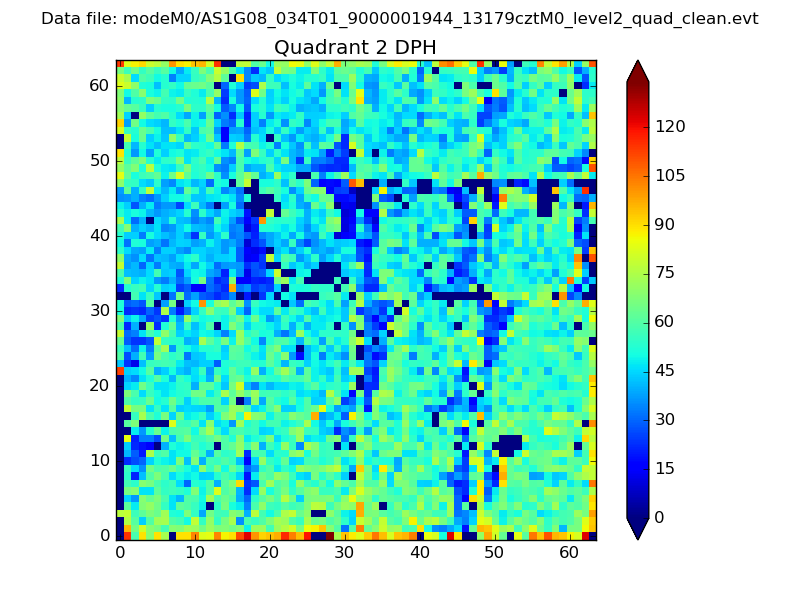
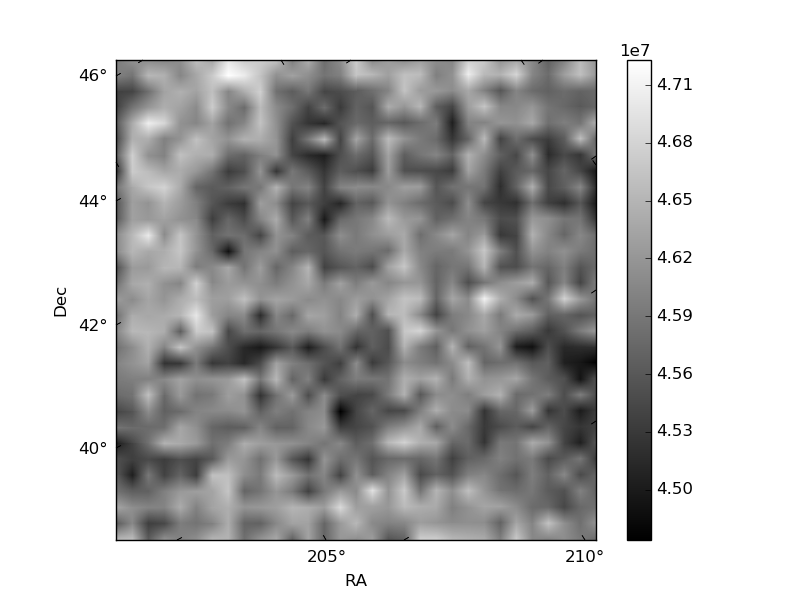
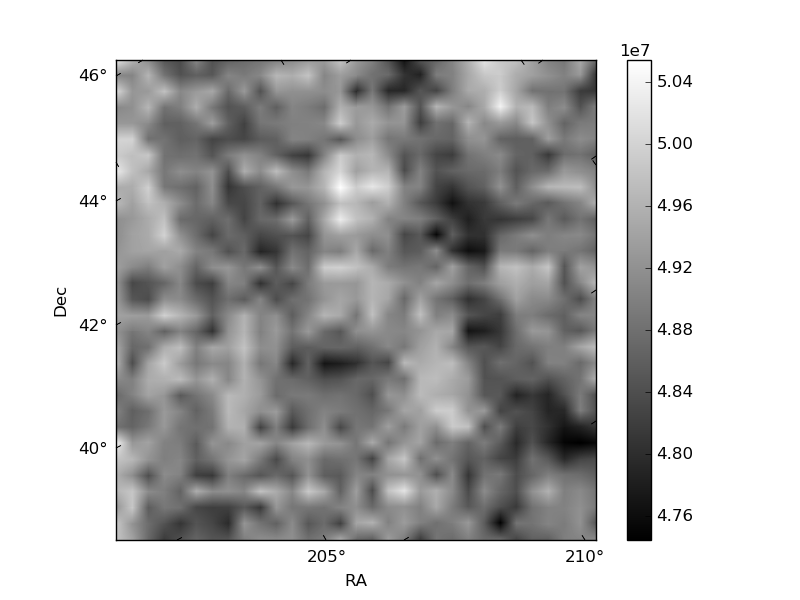
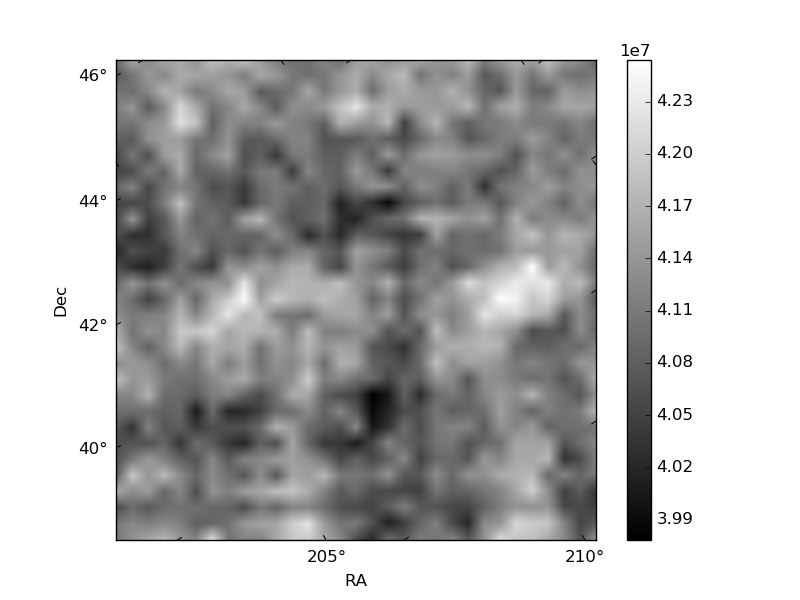
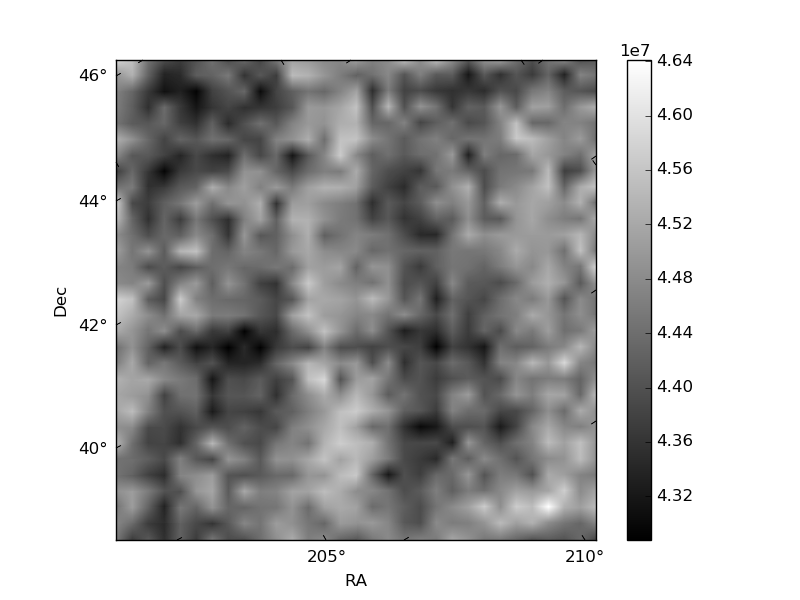
Histogram calculated using DETX and DETY for each event in the final _common_clean file
| Quadrant A |  |
 |
Quadrant B |
|---|---|---|---|
| Quadrant D | 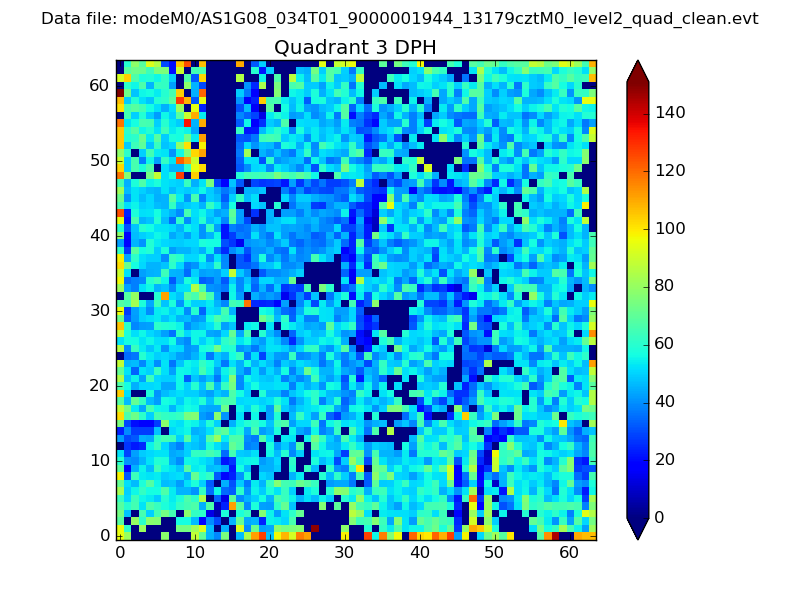 |
 |
Quadrant C |
| Plot type | Count rate plots | Images |
|---|---|---|
| Comparison with Poisson distribution Blue bars denote a histogram of data divided into 1 sec bins. Red curve is a Poisson curve with rate = median count rate of data. |
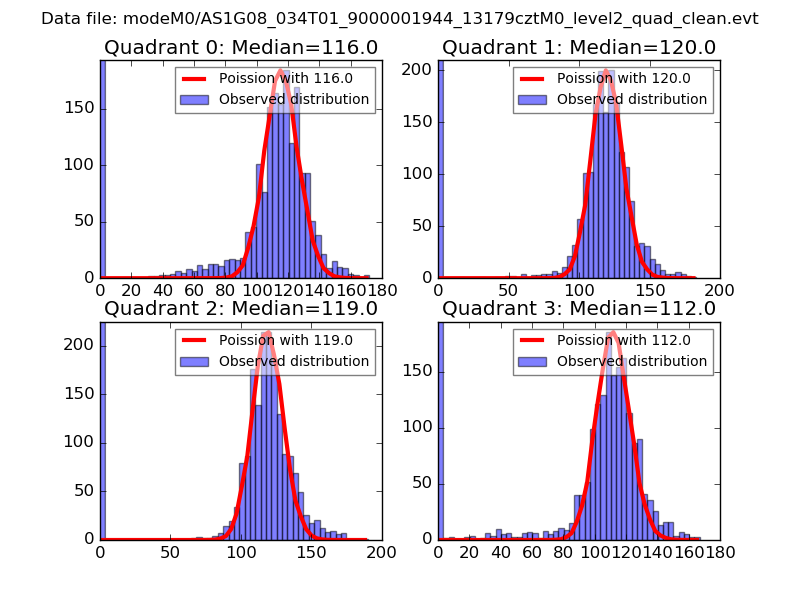 |
 |
| Quadrant-wise count rates Data is divided into 100 sec bins |
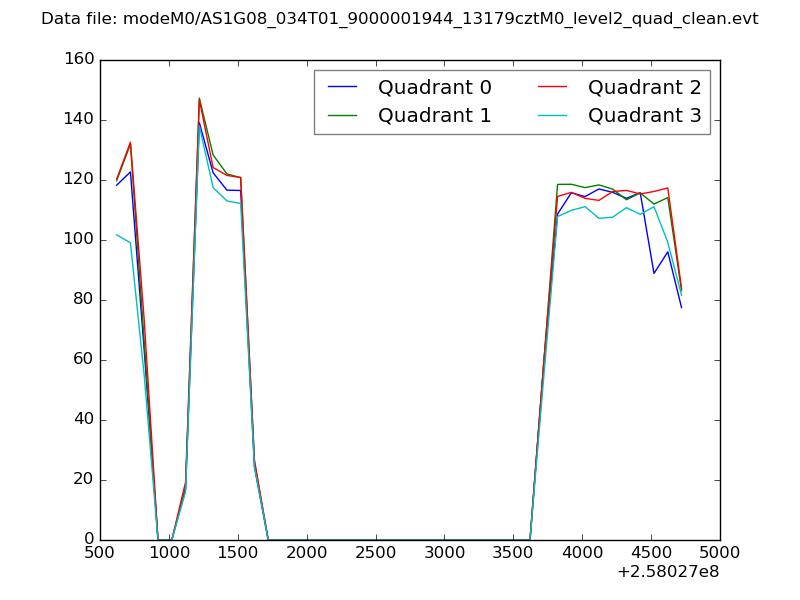 |
|
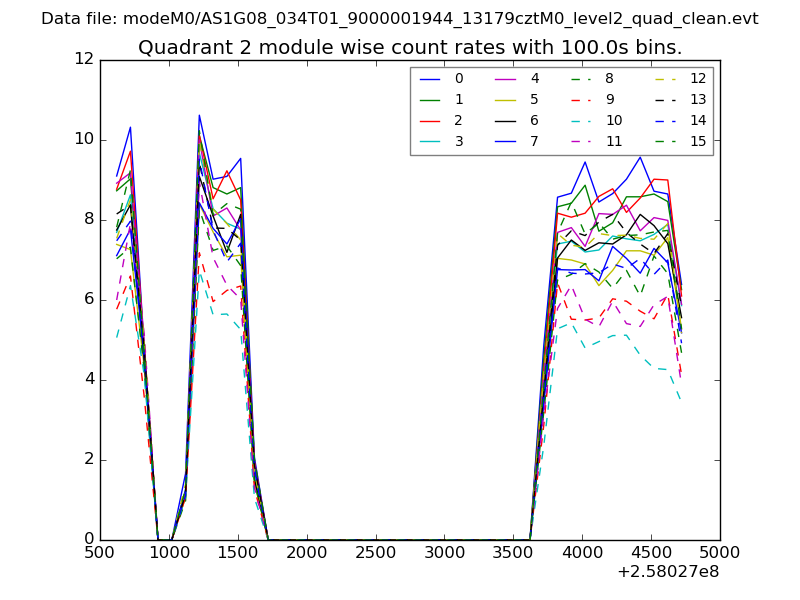
| Module-wise count rates for Quadrant A Data is divided into 100 sec bins |
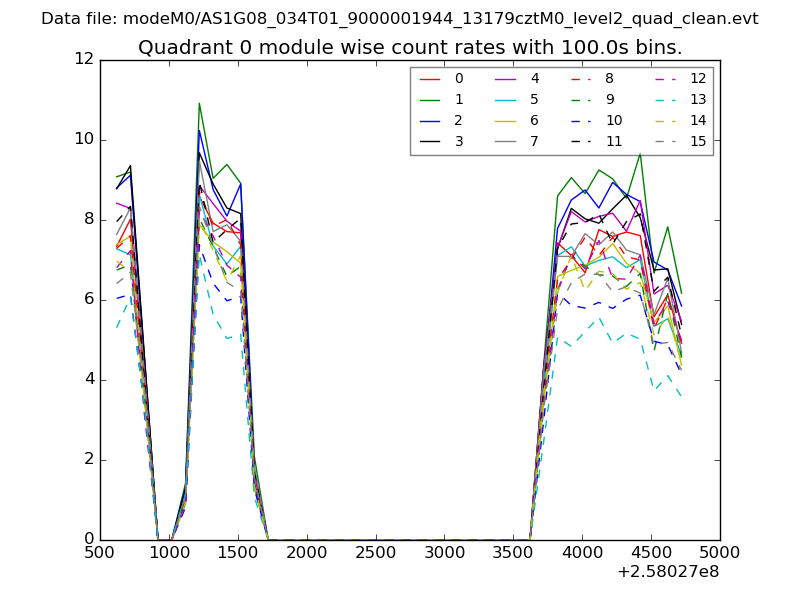 |
 |
| Module-wise count rates for Quadrant B Data is divided into 100 sec bins |
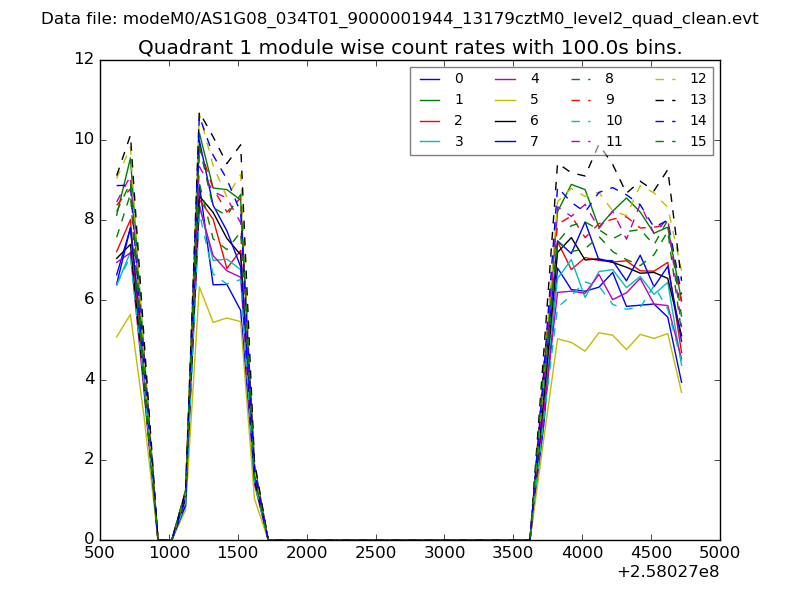 |
 |
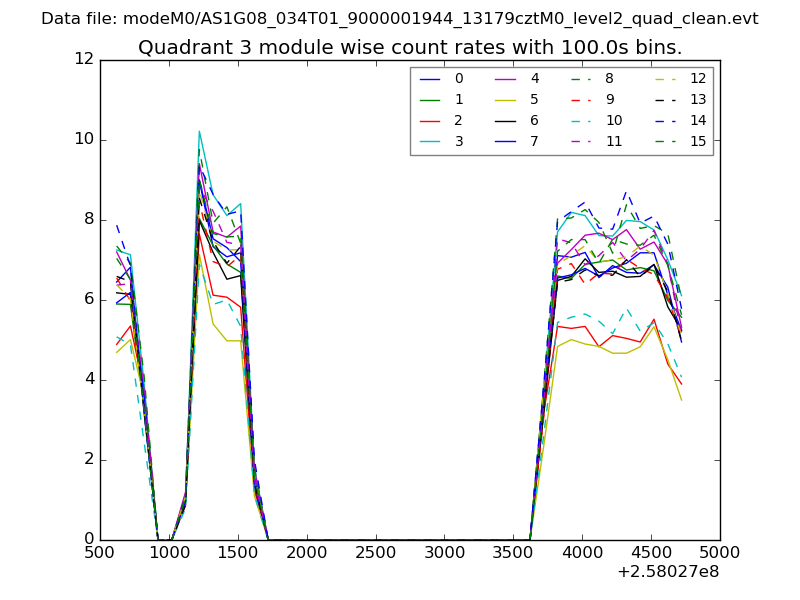
| Module-wise count rates for Quadrant C Data is divided into 100 sec bins |
 |
 |
| Module-wise count rates for Quadrant D Data is divided into 100 sec bins |
 |
 |
| Parameter | Plot |
|---|---|
| CZT HV Monitor | 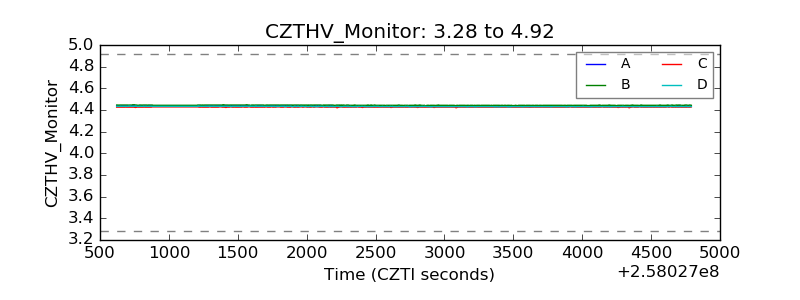 |
| D_VDD | 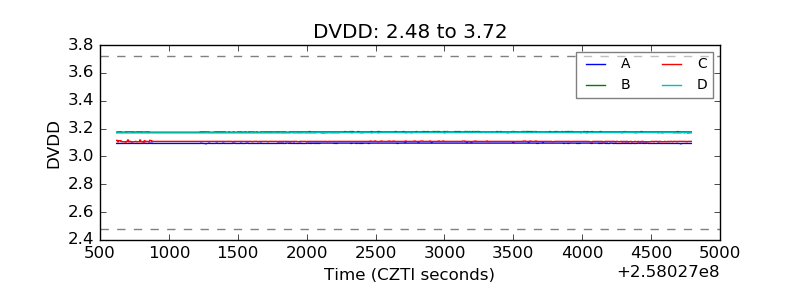 |
| Temperature 1 | 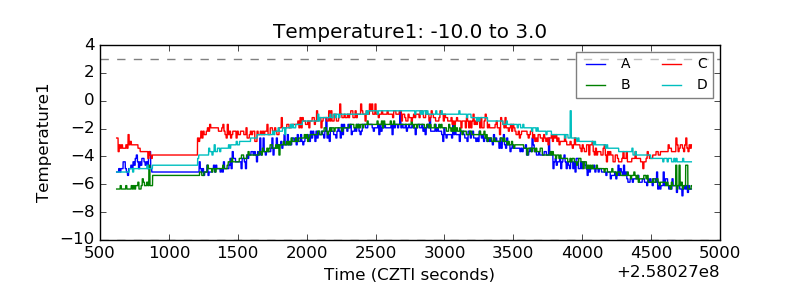 |
| Veto HV Monitor |  |
| Veto LLD | 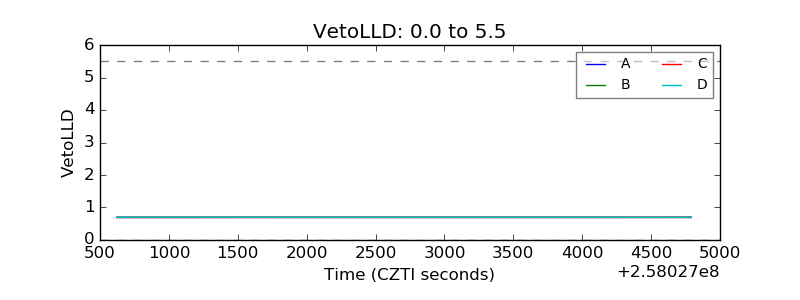 |
| Alpha Counter | 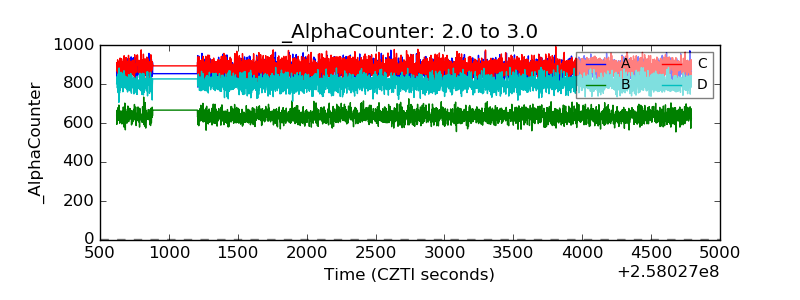 |
| _CPM_Rate |  |
| CZT Counter | 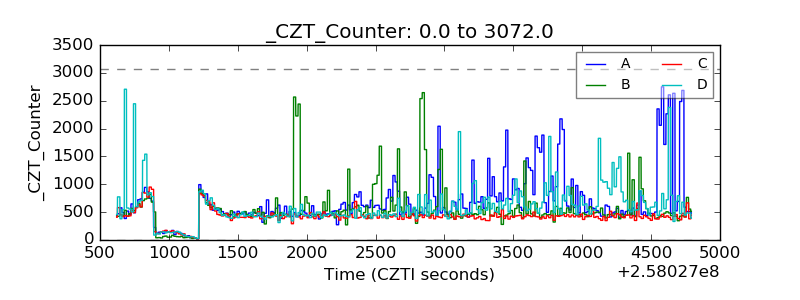 |
| +2.5 Volts monitor | 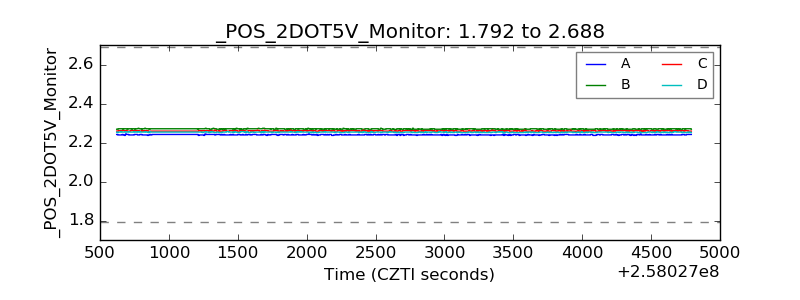 |
| +5 Volts monitor | 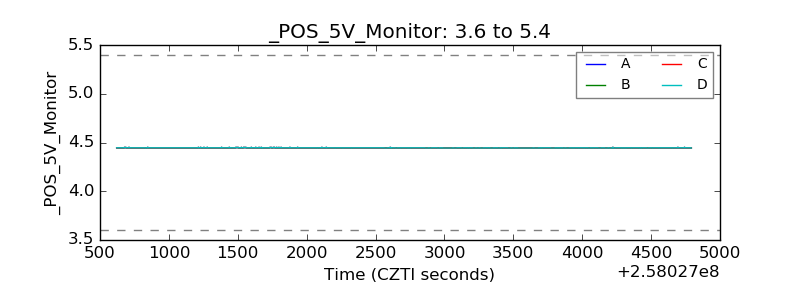 |
| _ROLL_ROT |  |
| _Roll_DEC |  |
| _Roll_RA | 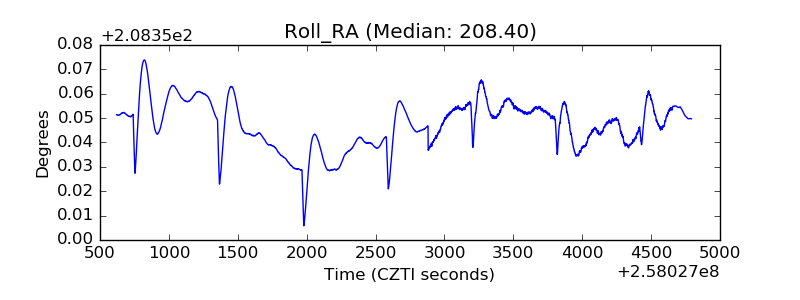 |
| Veto Counter | 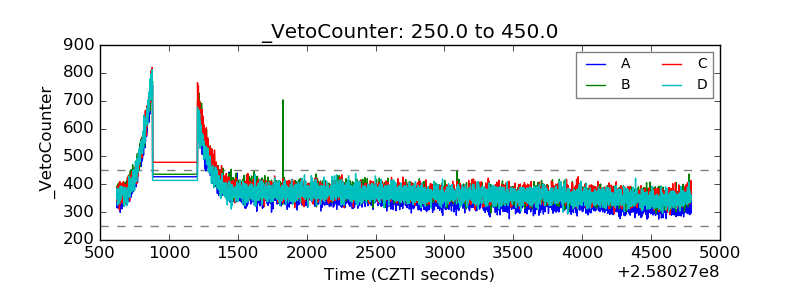 |