| Param | Original file | Final file |
|---|---|---|
| Filename | modeM0/AS1G08_034T01_9000001944_13180cztM0_level2.evt | modeM0/AS1G08_034T01_9000001944_13180cztM0_level2_quad_clean.evt |
| Size (bytes) | 61,145,280 | 11,528,640 |
| Size | 58.3 MB | 11.0 MB |
| Events in quadrant A | 593,850 | 70,983 |
| Events in quadrant B | 402,669 | 75,909 |
| Events in quadrant C | 278,318 | 76,632 |
| Events in quadrant D | 529,007 | 71,311 |
| Mode M0 | |||
|---|---|---|---|
| Quadrant | BADHDUFLAG | Total packets | Discarded packets |
| A | 0 | 2201 | 0 |
| B | 0 | 1653 | 0 |
| C | 0 | 1335 | 0 |
| D | 0 | 2007 | 0 |
| Mode SS | |||
|---|---|---|---|
| Quadrant | BADHDUFLAG | Total packets | Discarded packets |
| A | 0 | 12 | 0 |
| B | 0 | 12 | 0 |
| C | 0 | 12 | 0 |
| D | 0 | 12 | 0 |
| Quadrant | Total seconds | Saturated seconds | Saturation percentage |
|---|---|---|---|
| A | 662 | 114 | 17.220544% |
| B | 662 | 15 | 2.265861% |
| C | 662 | 0 | 0.000000% |
| D | 662 | 25 | 3.776435% |
Noise dominated data is calculated using 1-second bins in cleaned event files. If a bin has >2000 counts, and if more than 50% of those come from <1% of pixels, then it is considered to be noise-dominated and hence unusable.
| Quadrant | # 1 sec bins | Bins with >0 counts | Bins with >2000 counts | High rate bins dominated by noise | Noise dominated (total time) | Noise dominated (detector-on time) | Marked lightcurve |
|---|---|---|---|---|---|---|---|
| A | 663 | 663 | 94 | 94 | 14.18% | 14.18% | 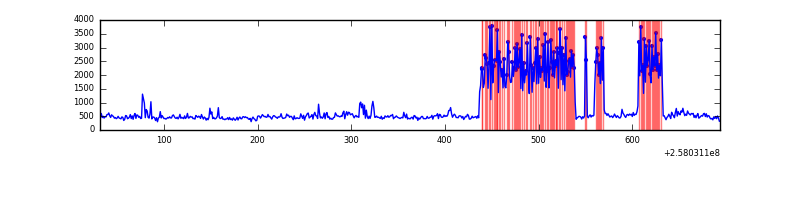 |
| B | 663 | 663 | 11 | 11 | 1.66% | 1.66% | 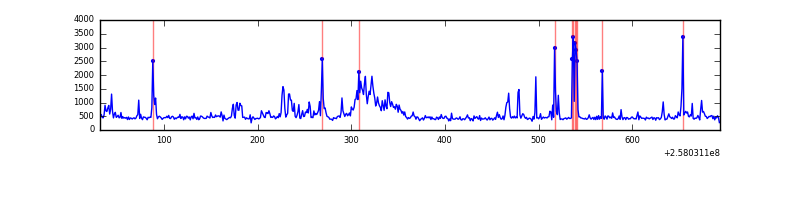 |
| C | 663 | 663 | 0 | 0 | 0.00% | 0.00% | 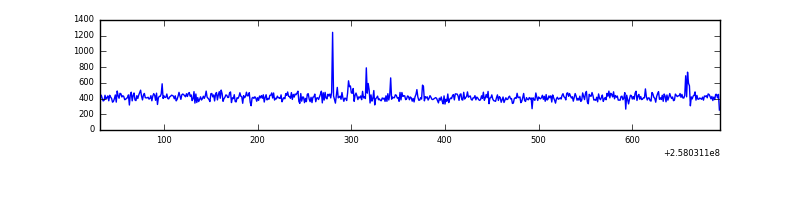 |
| D | 663 | 663 | 20 | 20 | 3.02% | 3.02% | 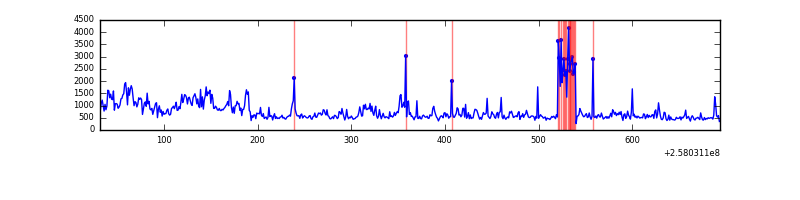 |
Top three noisy pixels from each quadrant. If the there are fewer than three noisy pixels in the level2.evt file, extra rows are filled as -1
| Pixel properties | Quadrant properties | ||||||
|---|---|---|---|---|---|---|---|
| Quadrant | DetID | PixID | Counts | Sigma | Mean | Median | Sigma |
| A | 0 | 23 | 271944 | 16969.21 | 66 | 64 | 16.0 |
| A | 12 | 189 | 40868 | 2546.75 | 66 | 64 | 16.0 |
| A | 0 | 226 | 18017 | 1120.52 | 66 | 64 | 16.0 |
| B | 4 | 239 | 91389 | 5754.4 | 69 | 67 | 15.9 |
| B | 3 | 64 | 19244 | 1208.39 | 69 | 67 | 15.9 |
| B | 5 | 32 | 6067 | 378.07 | 69 | 67 | 15.9 |
| C | 15 | 208 | 4615 | 250.06 | 70 | 70 | 18.2 |
| C | 13 | 61 | 492 | 23.22 | 70 | 70 | 18.2 |
| C | 3 | 202 | 163 | 5.12 | 70 | 70 | 18.2 |
| D | 13 | 122 | 158471 | 8592.41 | 67 | 65 | 18.4 |
| D | 10 | 157 | 60844 | 3296.83 | 67 | 65 | 18.4 |
| D | 1 | 52 | 32231 | 1744.78 | 67 | 65 | 18.4 |
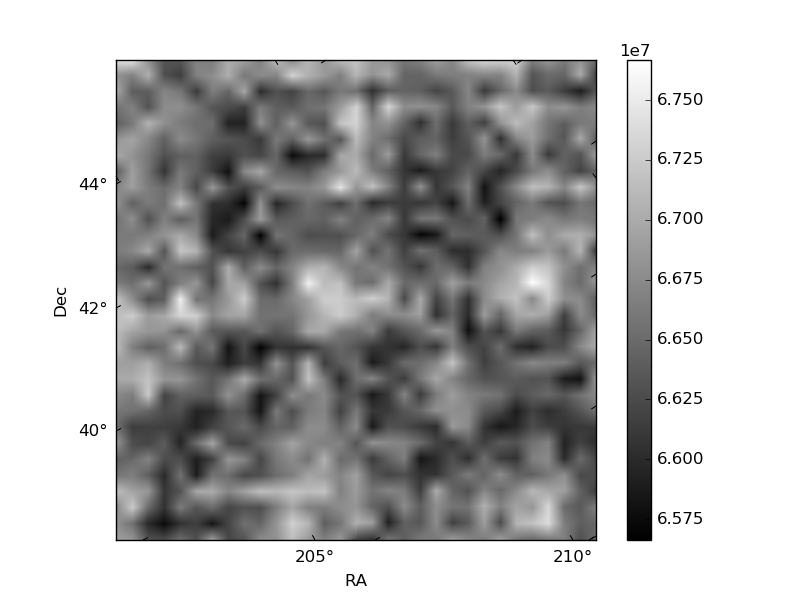
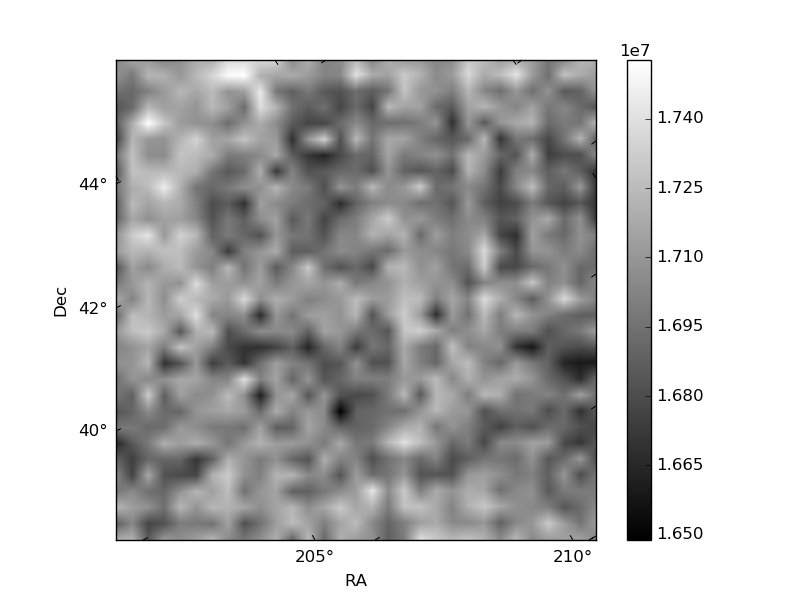
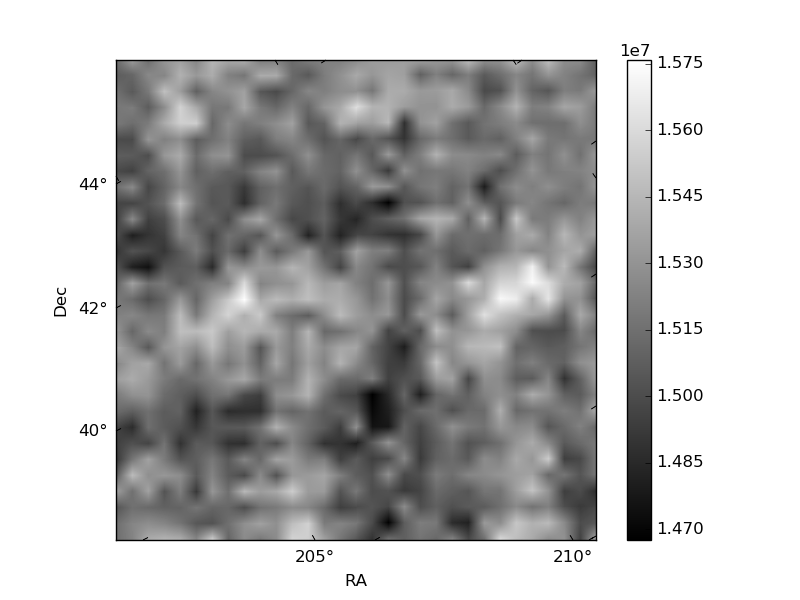
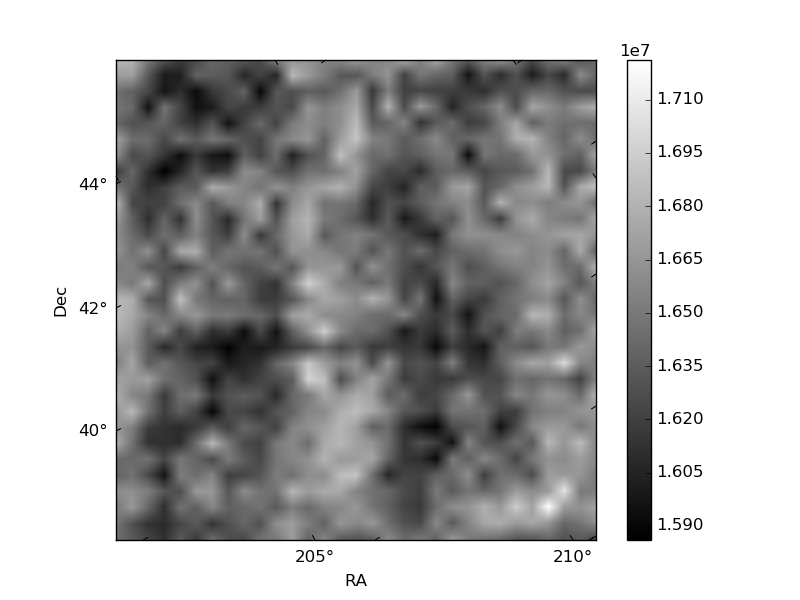
Histogram calculated using DETX and DETY for each event in the final _common_clean file
| Quadrant A | 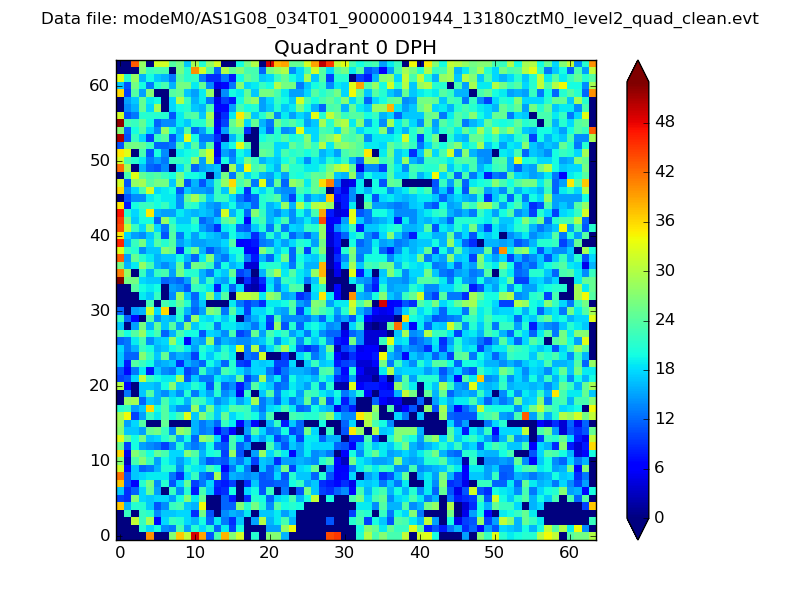 |
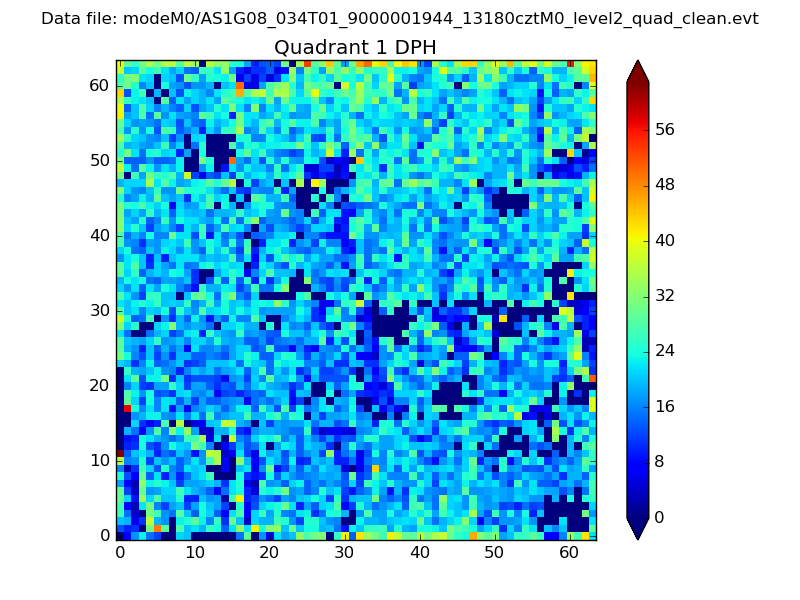 |
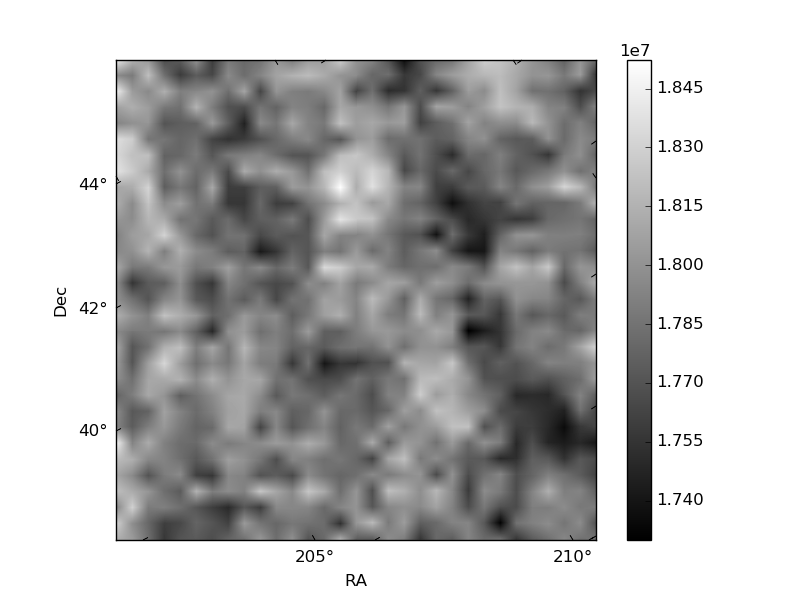
Quadrant B |
|---|---|---|---|
| Quadrant D | 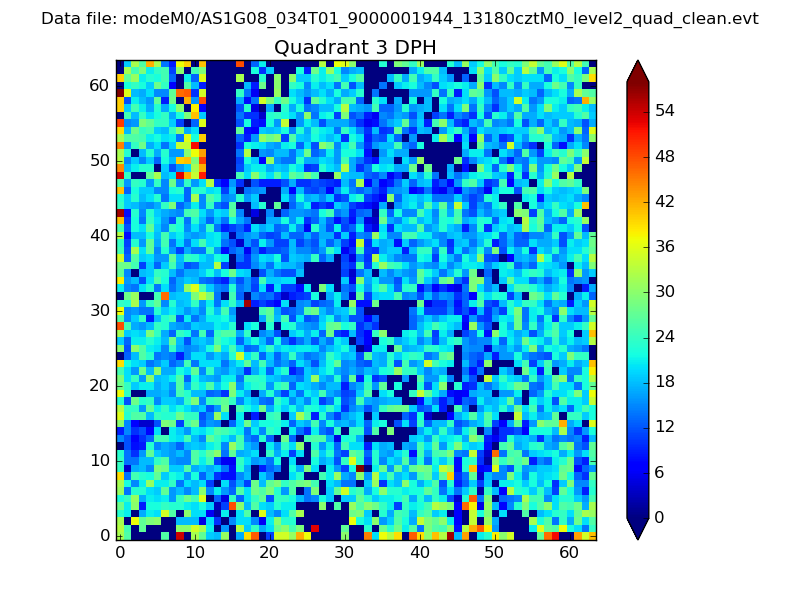 |
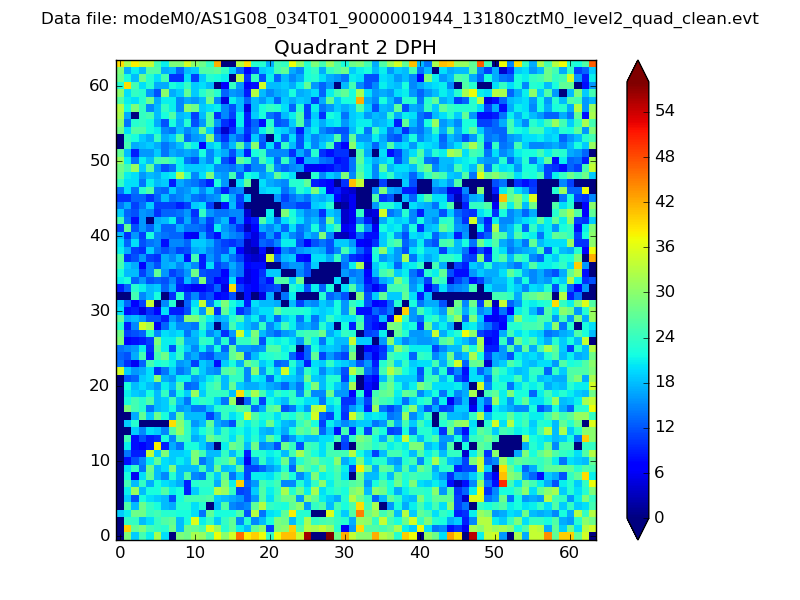 |
Quadrant C |
| Plot type | Count rate plots | Images |
|---|---|---|
| Comparison with Poisson distribution Blue bars denote a histogram of data divided into 1 sec bins. Red curve is a Poisson curve with rate = median count rate of data. |
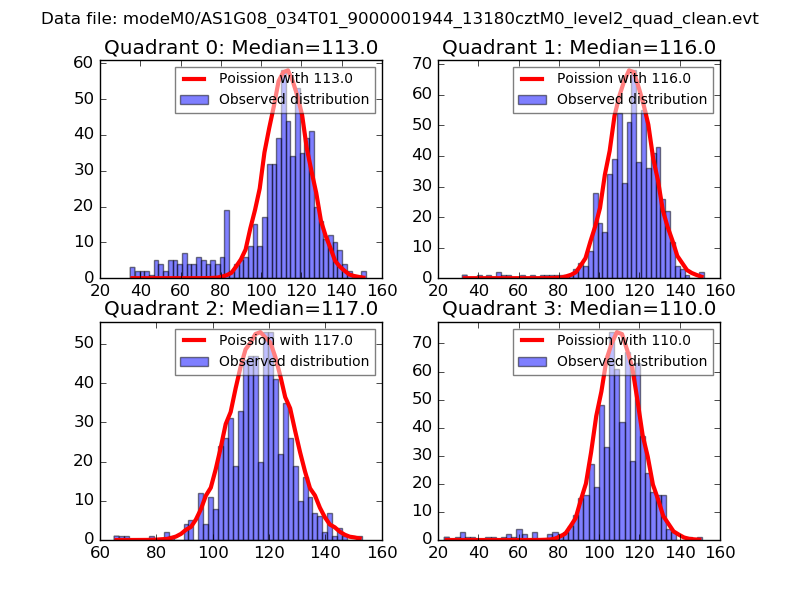 |
 |
| Quadrant-wise count rates Data is divided into 100 sec bins |
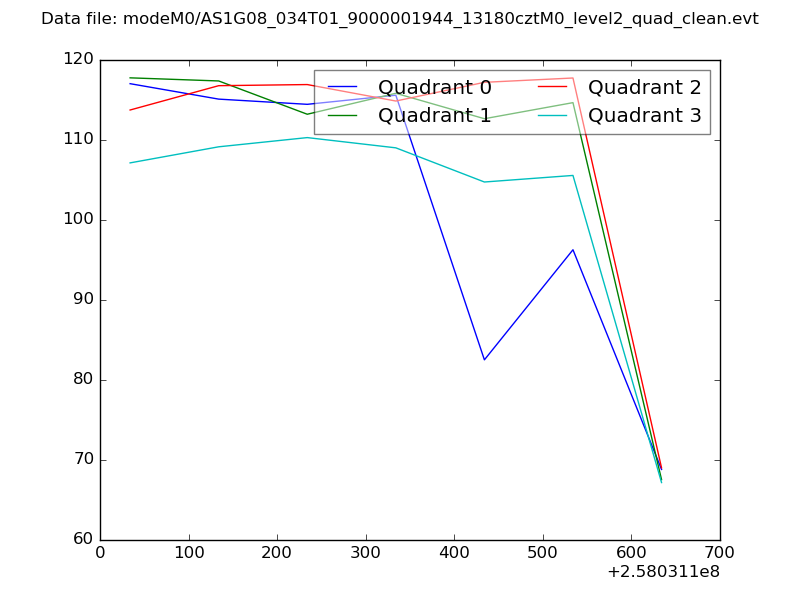 |
|
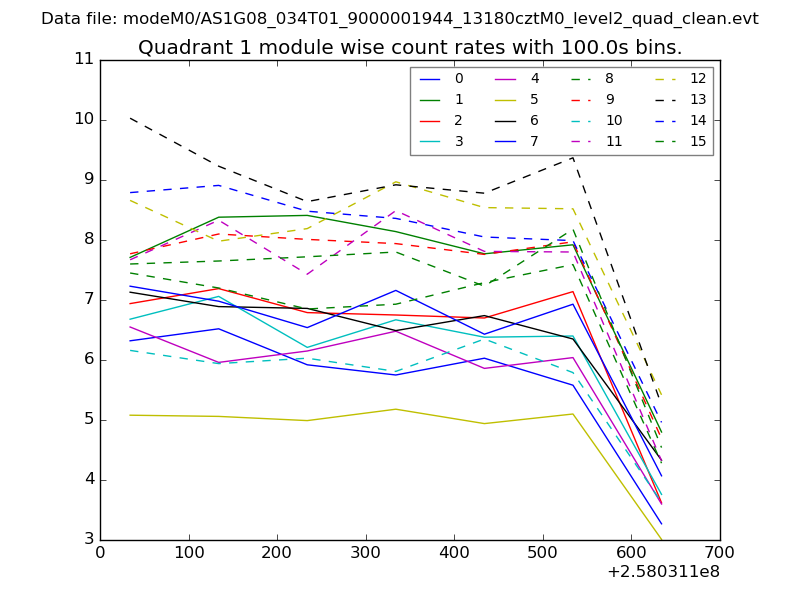
| Module-wise count rates for Quadrant A Data is divided into 100 sec bins |
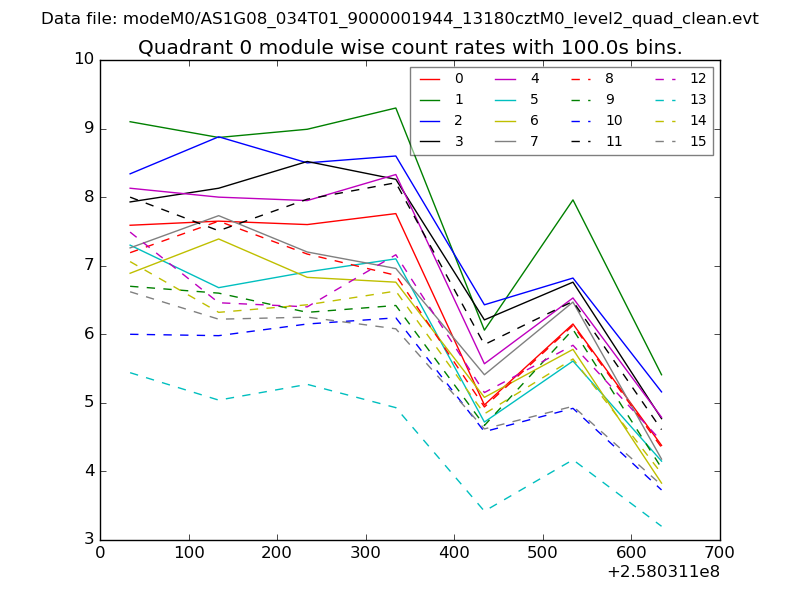 |
 |
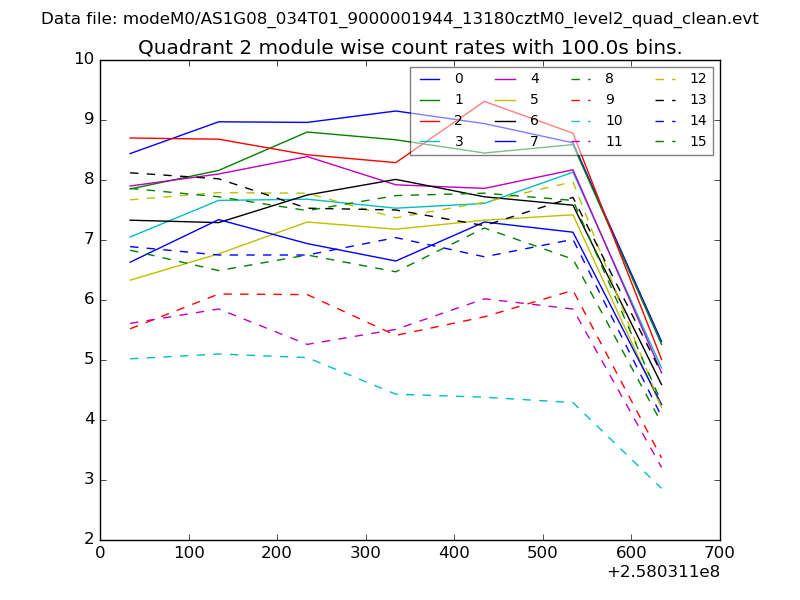
| Module-wise count rates for Quadrant B Data is divided into 100 sec bins |
 |
 |
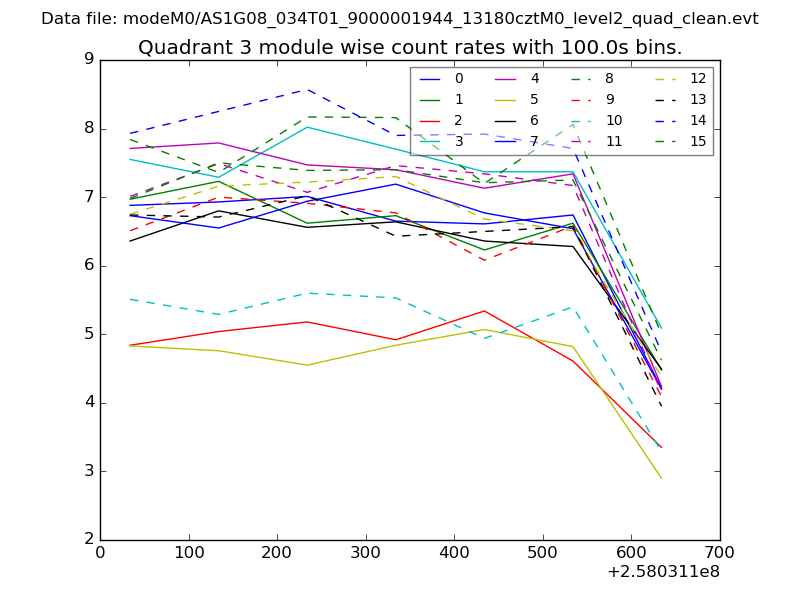
| Module-wise count rates for Quadrant C Data is divided into 100 sec bins |
 |
 |
| Module-wise count rates for Quadrant D Data is divided into 100 sec bins |
 |
 |
| Parameter | Plot |
|---|---|
| CZT HV Monitor | 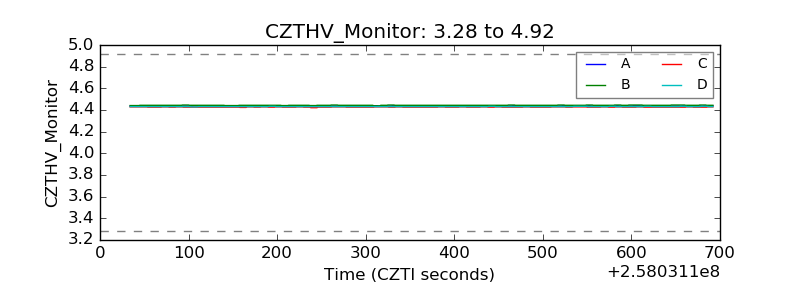 |
| D_VDD | 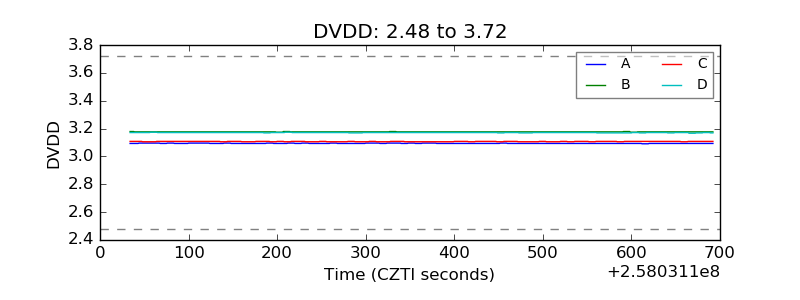 |
| Temperature 1 | 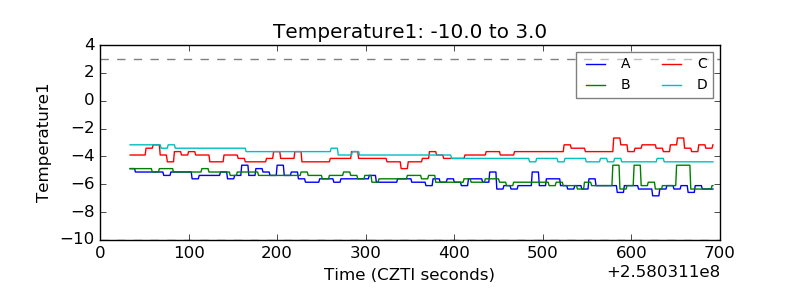 |
| Veto HV Monitor | 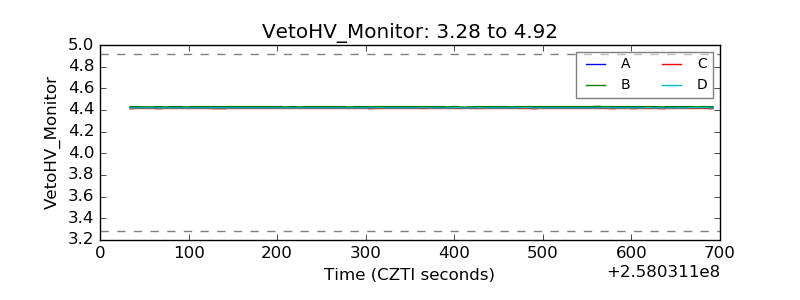 |
| Veto LLD | 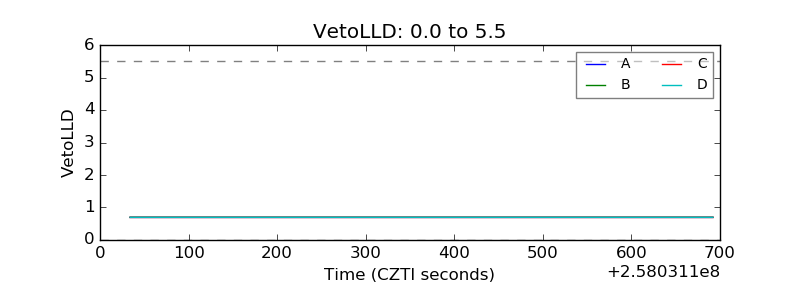 |
| Alpha Counter | 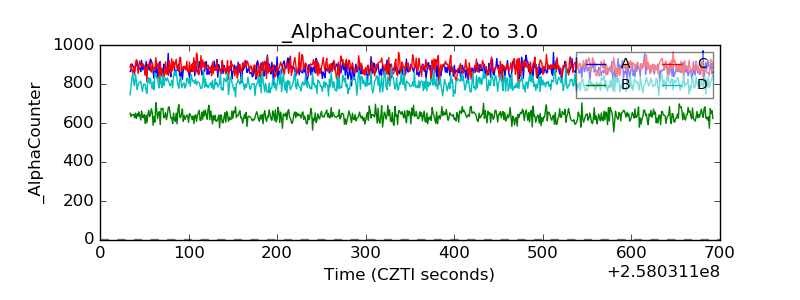 |
| _CPM_Rate | 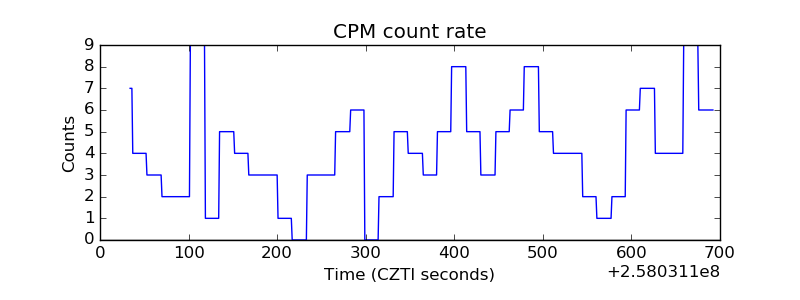 |
| CZT Counter | 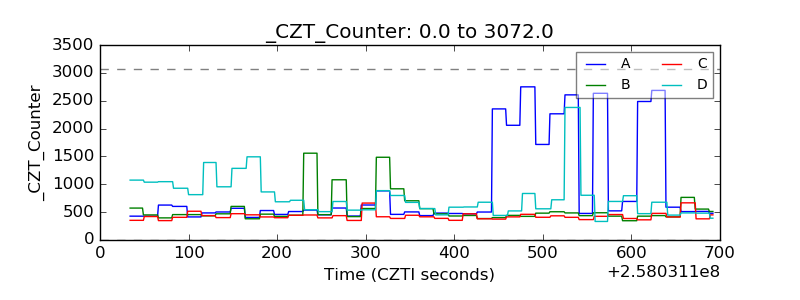 |
| +2.5 Volts monitor |  |
| +5 Volts monitor |  |
| _ROLL_ROT |  |
| _Roll_DEC | 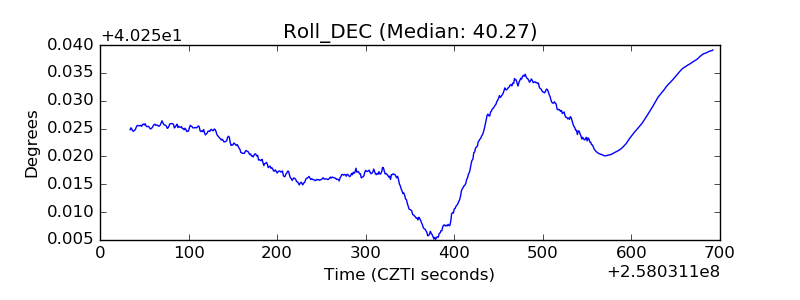 |
| _Roll_RA | 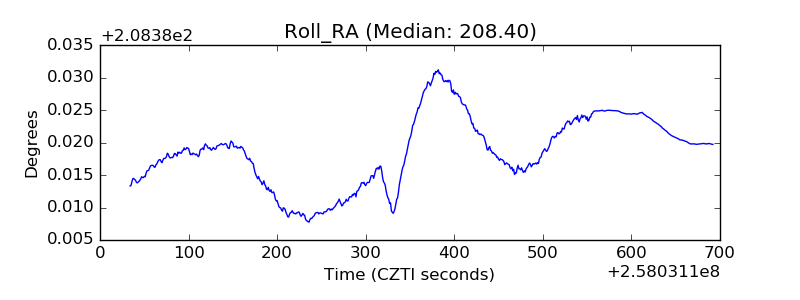 |
| Veto Counter | 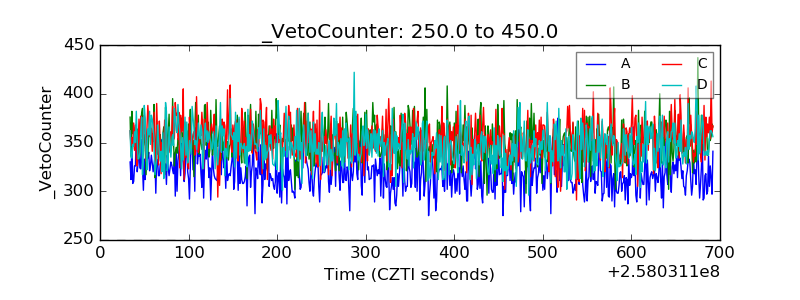 |