| Param | Original file | Final file |
|---|---|---|
| Filename | modeM0/AS1G08_034T01_9000001944_13181cztM0_level2.evt | modeM0/AS1G08_034T01_9000001944_13181cztM0_level2_quad_clean.evt |
| Size (bytes) | 1,505,459,520 | 241,539,840 |
| Size | 1.4 GB | 230.4 MB |
| Events in quadrant A | 10,914,124 | 1,467,502 |
| Events in quadrant B | 12,035,305 | 1,497,475 |
| Events in quadrant C | 9,318,268 | 1,506,488 |
| Events in quadrant D | 11,919,094 | 1,410,520 |
| Mode M0 | |||
|---|---|---|---|
| Quadrant | BADHDUFLAG | Total packets | Discarded packets |
| A | 0 | 46016 | 4 |
| B | 0 | 49477 | 4 |
| C | 0 | 42559 | 4 |
| D | 0 | 49659 | 4 |
| Mode SS | |||
|---|---|---|---|
| Quadrant | BADHDUFLAG | Total packets | Discarded packets |
| A | 0 | 420 | 0 |
| B | 0 | 420 | 0 |
| C | 0 | 420 | 0 |
| D | 0 | 420 | 0 |
| Mode M9 | |||
|---|---|---|---|
| Quadrant | BADHDUFLAG | Total packets | Discarded packets |
| A | 0 | 7 | 0 |
| B | 0 | 7 | 0 |
| C | 0 | 7 | 0 |
| D | 0 | 7 | 0 |
| Quadrant | Total seconds | Saturated seconds | Saturation percentage |
|---|---|---|---|
| A | 20804 | 688 | 3.307056% |
| B | 20804 | 1082 | 5.200923% |
| C | 20804 | 336 | 1.615074% |
| D | 20804 | 783 | 3.763699% |
Noise dominated data is calculated using 1-second bins in cleaned event files. If a bin has >2000 counts, and if more than 50% of those come from <1% of pixels, then it is considered to be noise-dominated and hence unusable.
| Quadrant | # 1 sec bins | Bins with >0 counts | Bins with >2000 counts | High rate bins dominated by noise | Noise dominated (total time) | Noise dominated (detector-on time) | Marked lightcurve |
|---|---|---|---|---|---|---|---|
| A | 21531 | 20810 | 143 | 143 | 0.66% | 0.69% | 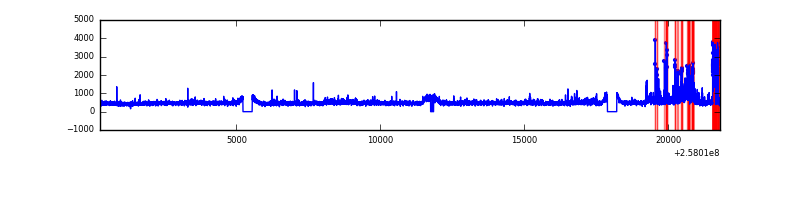 |
| B | 21531 | 20810 | 401 | 401 | 1.86% | 1.93% | 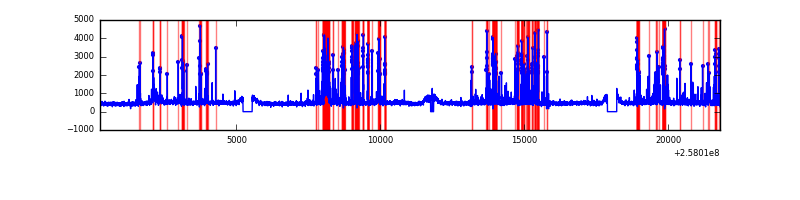 |
| C | 21531 | 20810 | 1 | 1 | 0.00% | 0.00% | 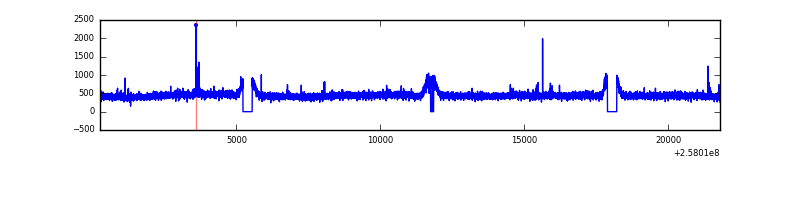 |
| D | 21531 | 20810 | 285 | 285 | 1.32% | 1.37% | 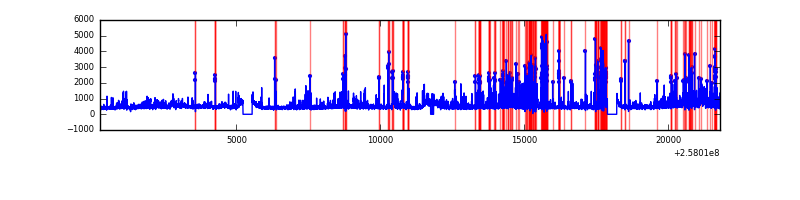 |
Top three noisy pixels from each quadrant. If the there are fewer than three noisy pixels in the level2.evt file, extra rows are filled as -1
| Pixel properties | Quadrant properties | ||||||
|---|---|---|---|---|---|---|---|
| Quadrant | DetID | PixID | Counts | Sigma | Mean | Median | Sigma |
| A | 12 | 189 | 761659 | 1535.22 | 2426 | 2369 | 494.6 |
| A | 0 | 23 | 300068 | 601.92 | 2426 | 2369 | 494.6 |
| A | 12 | 173 | 178401 | 355.92 | 2426 | 2369 | 494.6 |
| B | 4 | 239 | 1910368 | 4171.6 | 2405 | 2344 | 457.4 |
| B | 3 | 64 | 193791 | 418.57 | 2405 | 2344 | 457.4 |
| B | 0 | 230 | 134385 | 288.69 | 2405 | 2344 | 457.4 |
| C | 15 | 208 | 36948 | 63.02 | 2371 | 2376 | 548.6 |
| C | 8 | 128 | 22768 | 37.17 | 2371 | 2376 | 548.6 |
| C | 13 | 61 | 17344 | 27.28 | 2371 | 2376 | 548.6 |
| D | 1 | 52 | 2176542 | 3856.6 | 2337 | 2270 | 563.8 |
| D | 10 | 157 | 333579 | 587.66 | 2337 | 2270 | 563.8 |
| D | 13 | 122 | 181554 | 318.0 | 2337 | 2270 | 563.8 |
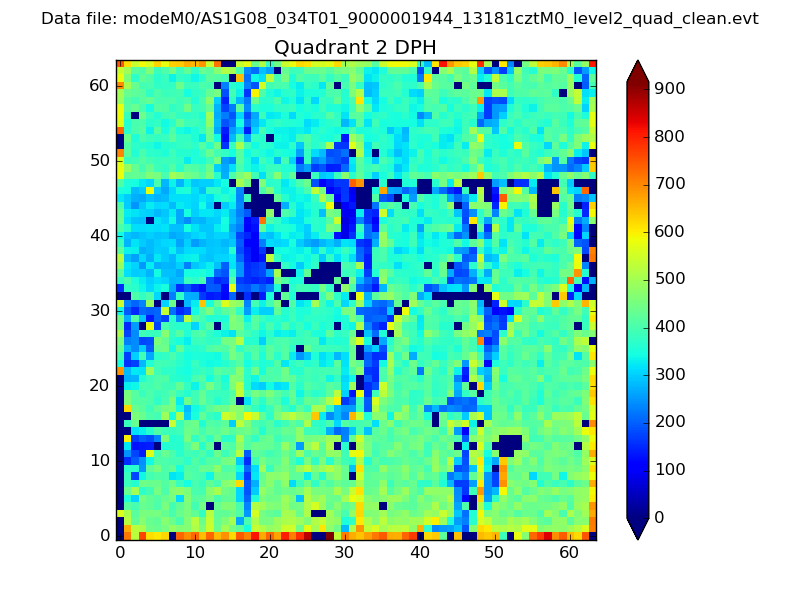
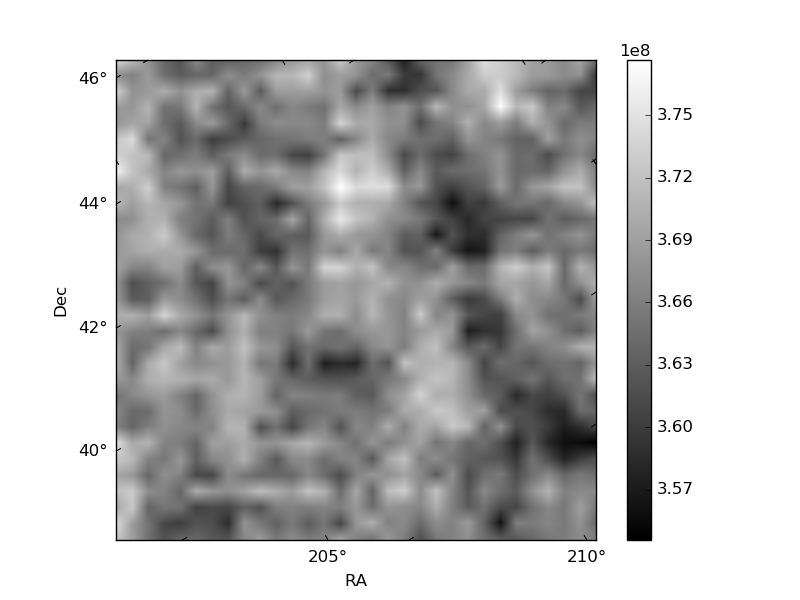
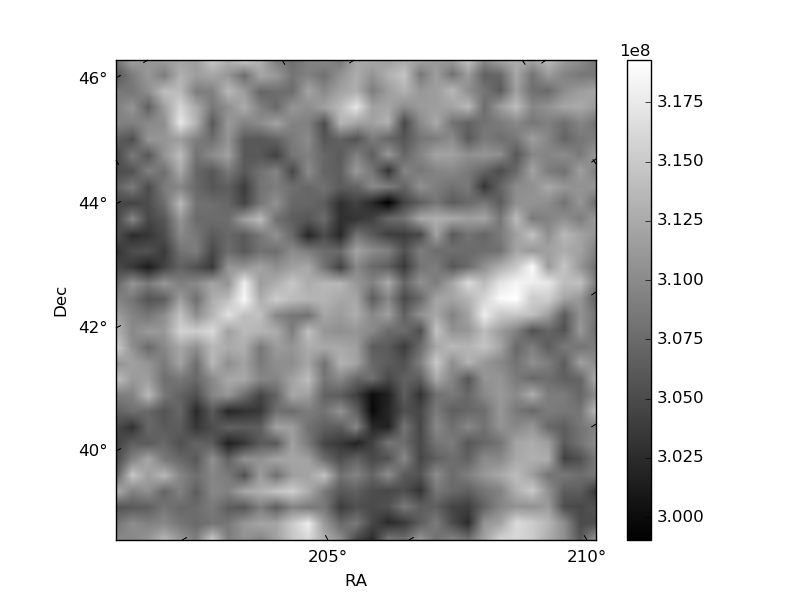
Histogram calculated using DETX and DETY for each event in the final _common_clean file
| Quadrant A | 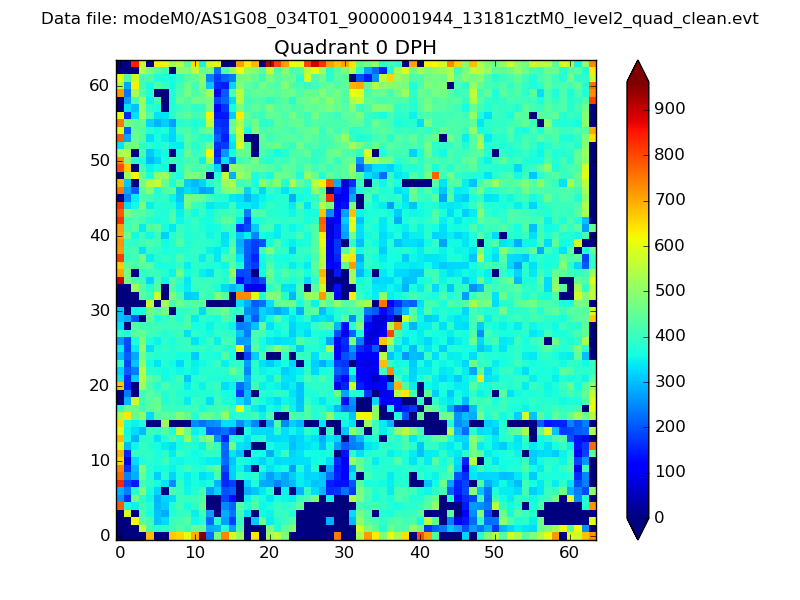 |
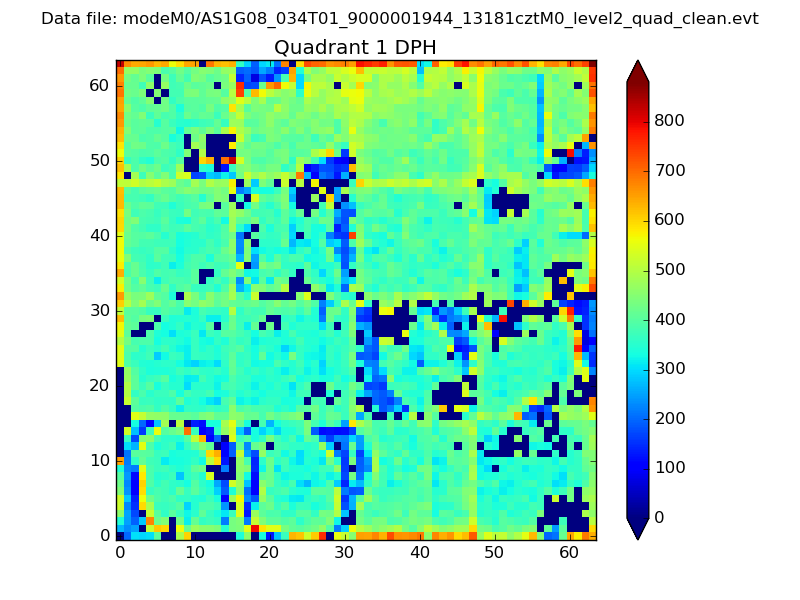 |
Quadrant B |
|---|---|---|---|
| Quadrant D | 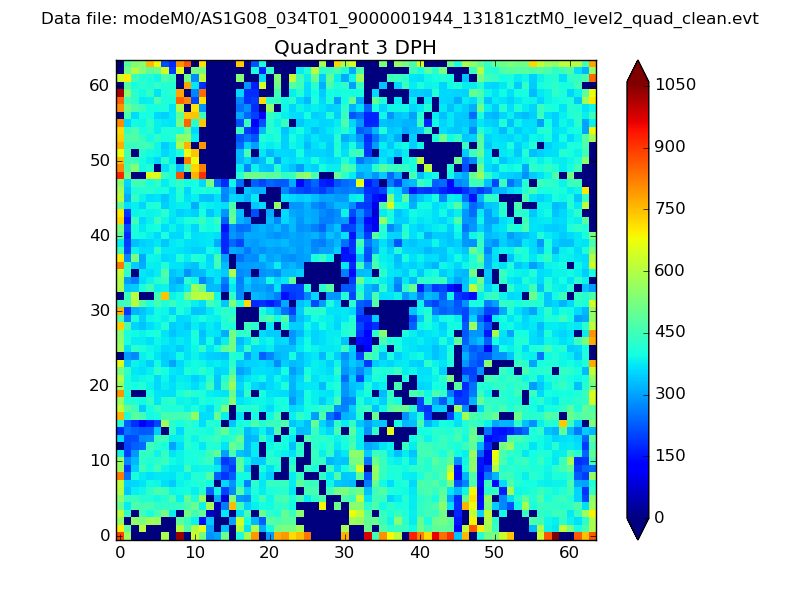 |
 |
Quadrant C |
| Plot type | Count rate plots | Images |
|---|---|---|
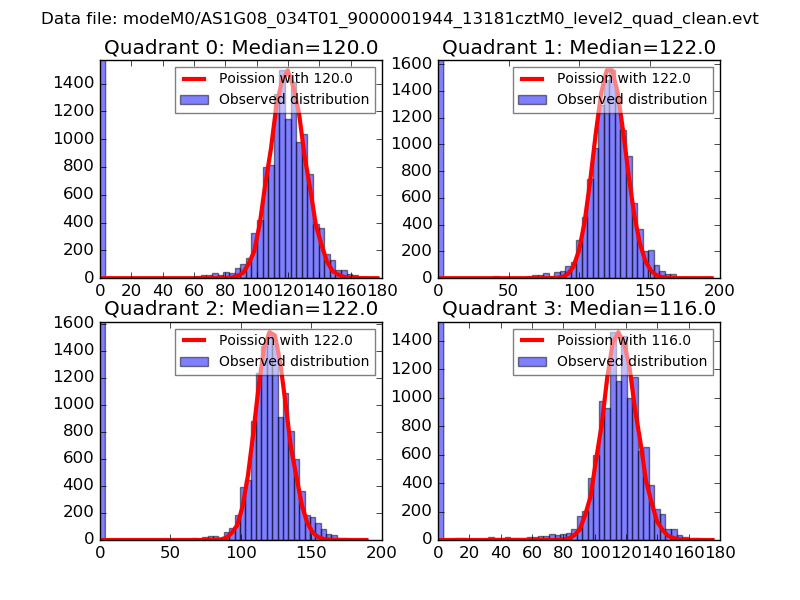
| Comparison with Poisson distribution Blue bars denote a histogram of data divided into 1 sec bins. Red curve is a Poisson curve with rate = median count rate of data. |
 |
 |
| Quadrant-wise count rates Data is divided into 100 sec bins |
 |
|
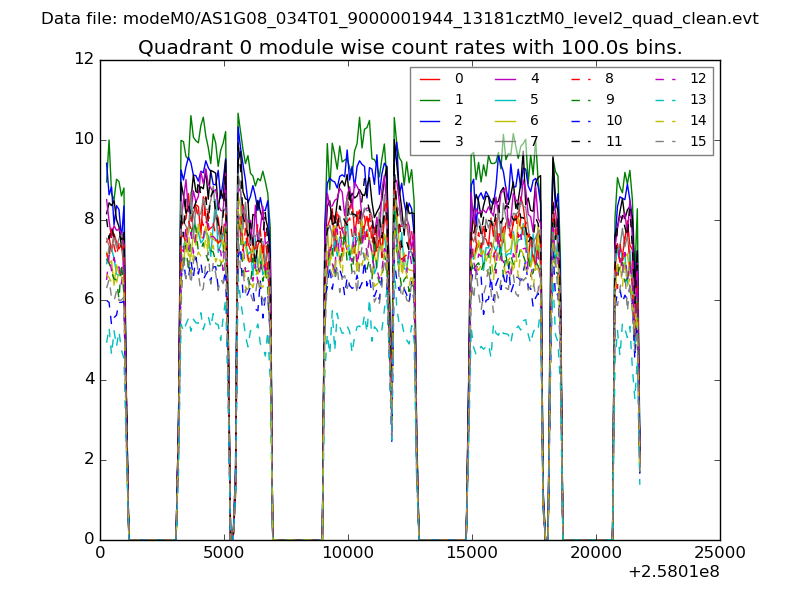
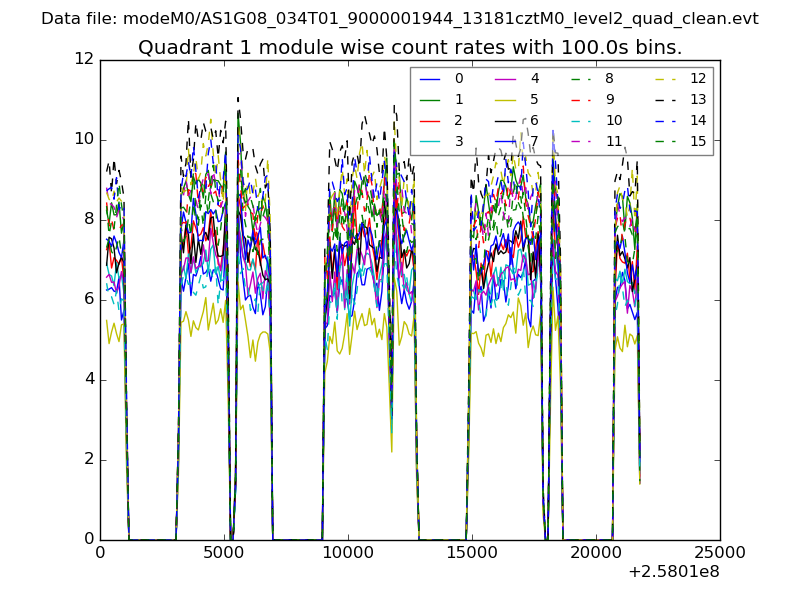
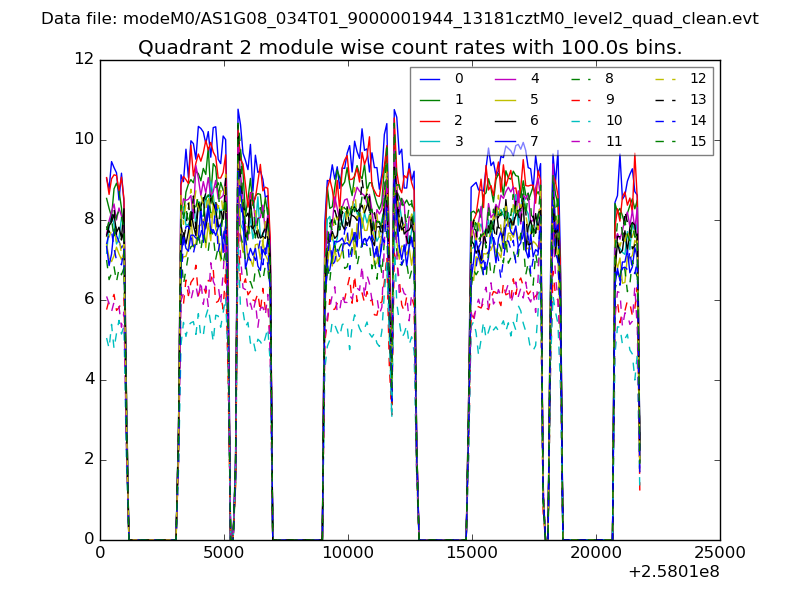
| Module-wise count rates for Quadrant A Data is divided into 100 sec bins |
 |
 |
| Module-wise count rates for Quadrant B Data is divided into 100 sec bins |
 |
 |
| Module-wise count rates for Quadrant C Data is divided into 100 sec bins |
 |
 |
| Module-wise count rates for Quadrant D Data is divided into 100 sec bins |
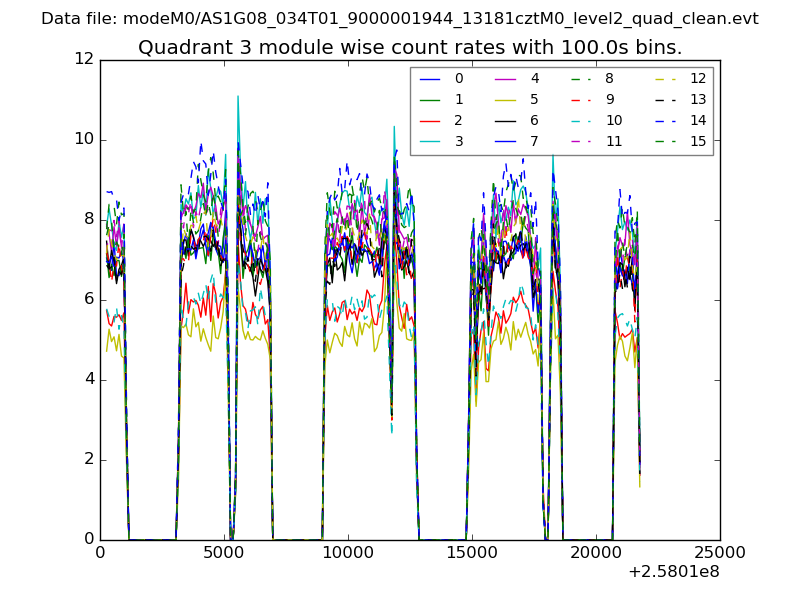 |
 |
| Parameter | Plot |
|---|---|
| CZT HV Monitor | 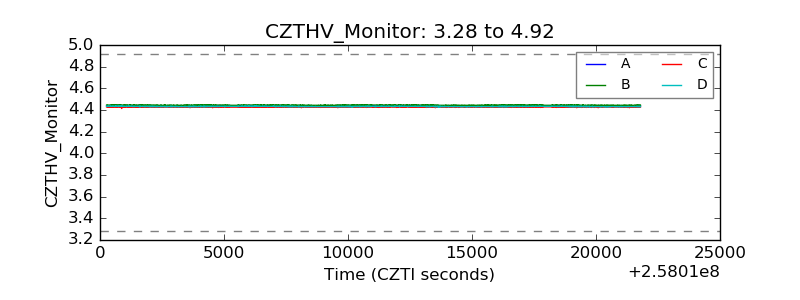 |
| D_VDD |  |
| Temperature 1 | 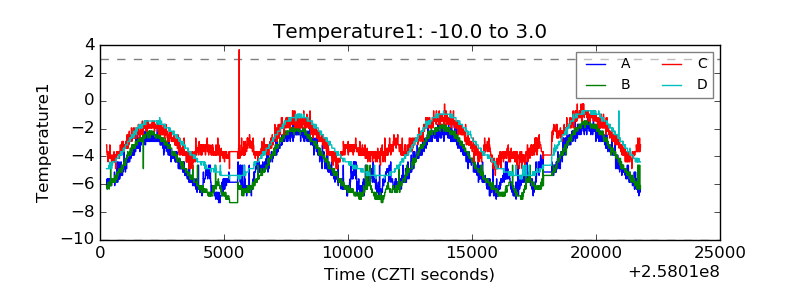 |
| Veto HV Monitor | 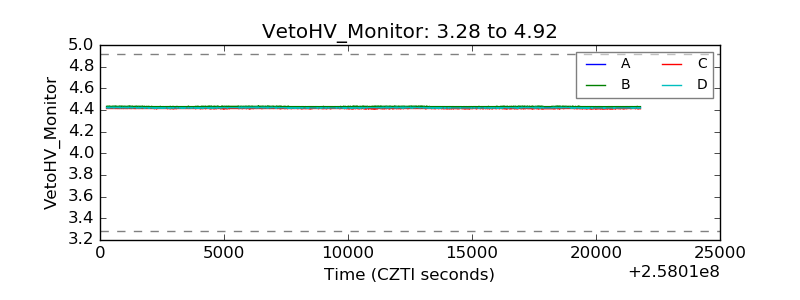 |
| Veto LLD | 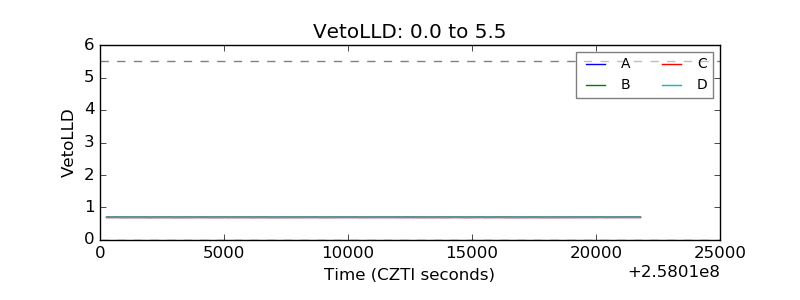 |
| Alpha Counter |  |
| _CPM_Rate | 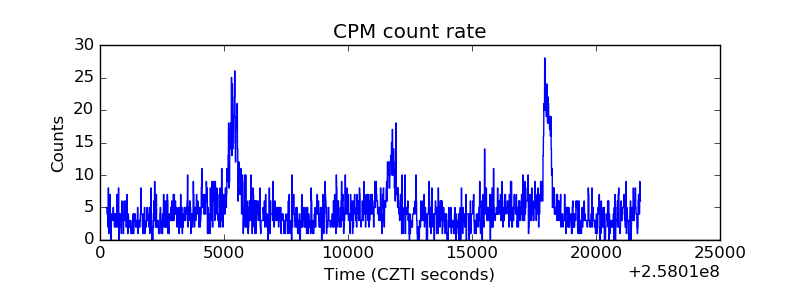 |
| CZT Counter | 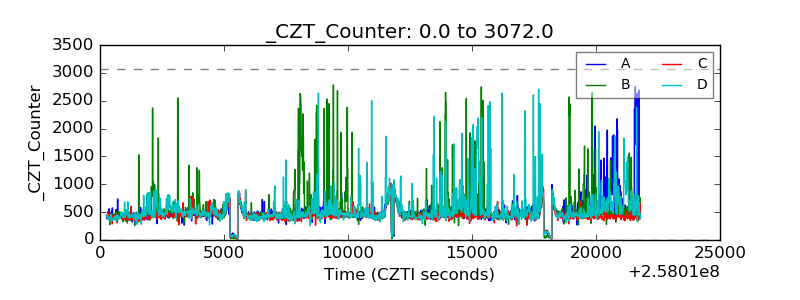 |
| +2.5 Volts monitor |  |
| +5 Volts monitor |  |
| _ROLL_ROT | 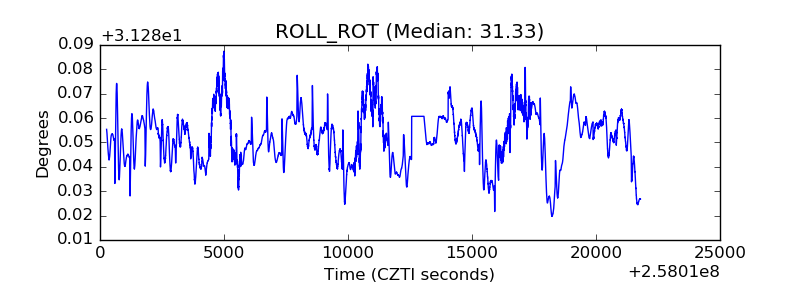 |
| _Roll_DEC | 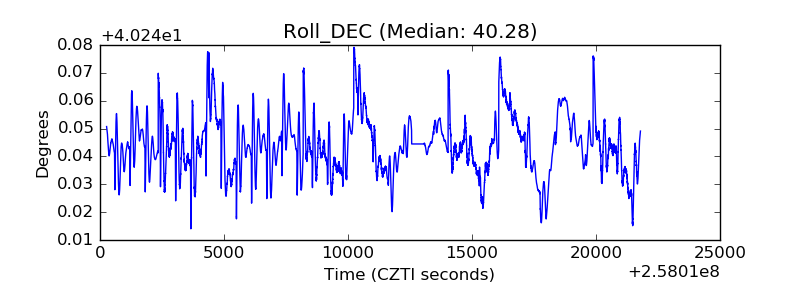 |
| _Roll_RA | 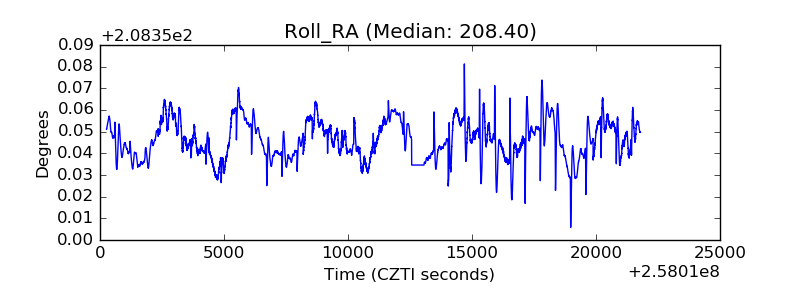 |
| Veto Counter | 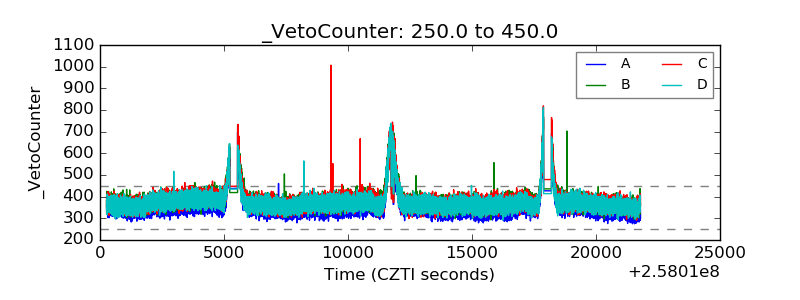 |