| Param | Original file | Final file |
|---|---|---|
| Filename | modeM0/AS1T02_012T01_9000001946cztM0_level2.fits | modeM0/AS1T02_012T01_9000001946cztM0_level2_quad_clean.evt |
| Size (bytes) | 37,679,040 | 16,004,160 |
| Size | 35.9 MB | 15.3 MB |
| Events in quadrant A | 220,534 | 46,616 |
| Events in quadrant B | 210,662 | 45,822 |
| Events in quadrant C | 224,654 | 49,397 |
| Events in quadrant D | 188,848 | 45,092 |
| Mode M9 | |||
|---|---|---|---|
| Quadrant | BADHDUFLAG | Total packets | Discarded packets |
| A | 0 | 5 | 0 |
| B | 0 | 5 | 0 |
| C | 0 | 5 | 0 |
| D | 0 | 5 | 0 |
| Mode SS | |||
|---|---|---|---|
| Quadrant | BADHDUFLAG | Total packets | Discarded packets |
| A | 0 | 88 | 0 |
| B | 0 | 88 | 0 |
| C | 0 | 88 | 0 |
| D | 0 | 88 | 0 |
| Mode M0 | |||
|---|---|---|---|
| Quadrant | BADHDUFLAG | Total packets | Discarded packets |
| A | 0 | 12402 | 0 |
| B | 0 | 11333 | 0 |
| C | 0 | 8585 | 0 |
| D | 0 | 11693 | 0 |
| Quadrant | Total seconds | Saturated seconds | Saturation percentage |
|---|---|---|---|
| A | 4199 | 222 | 5.286973% |
| B | 4199 | 368 | 8.763991% |
| C | 4199 | 35 | 0.833532% |
| D | 4199 | 247 | 5.882353% |
Noise dominated data is calculated using 1-second bins in cleaned event files. If a bin has >2000 counts, and if more than 50% of those come from <1% of pixels, then it is considered to be noise-dominated and hence unusable.
| Quadrant | # 1 sec bins | Bins with >0 counts | Bins with >2000 counts | High rate bins dominated by noise | Noise dominated (total time) | Noise dominated (detector-on time) | Marked lightcurve |
|---|---|---|---|---|---|---|---|
| A | 4749 | 4199 | 0 | 0 | 0.00% | 0.00% |  |
| B | 4749 | 4173 | 0 | 0 | 0.00% | 0.00% |  |
| C | 4749 | 4199 | 0 | 0 | 0.00% | 0.00% |  |
| D | 4749 | 4196 | 0 | 0 | 0.00% | 0.00% | 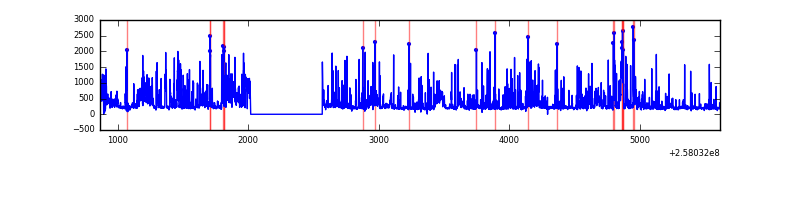 |
Top three noisy pixels from each quadrant. If the there are fewer than three noisy pixels in the level2.evt file, extra rows are filled as -1
| Pixel properties | Quadrant properties | ||||||
|---|---|---|---|---|---|---|---|
| Quadrant | DetID | PixID | Counts | Sigma | Mean | Median | Sigma |
| A | 14 | 188 | 240 | 11.65 | 57 | 54 | 16.0 |
| A | 0 | 29 | 239 | 11.59 | 57 | 54 | 16.0 |
| A | 14 | 204 | 225 | 10.71 | 57 | 54 | 16.0 |
| B | 2 | 9 | 166 | 8.3 | 55 | 53 | 13.6 |
| B | 5 | 225 | 144 | 6.69 | 55 | 53 | 13.6 |
| B | 14 | 254 | 144 | 6.69 | 55 | 53 | 13.6 |
| C | 12 | 241 | 166 | 6.48 | 59 | 55 | 17.1 |
| C | 15 | 65 | 155 | 5.84 | 59 | 55 | 17.1 |
| C | 9 | 233 | 154 | 5.78 | 59 | 55 | 17.1 |
| D | 4 | 246 | 152 | 6.43 | 53 | 48 | 16.2 |
| D | 6 | 62 | 147 | 6.12 | 53 | 48 | 16.2 |
| D | 3 | 31 | 144 | 5.94 | 53 | 48 | 16.2 |
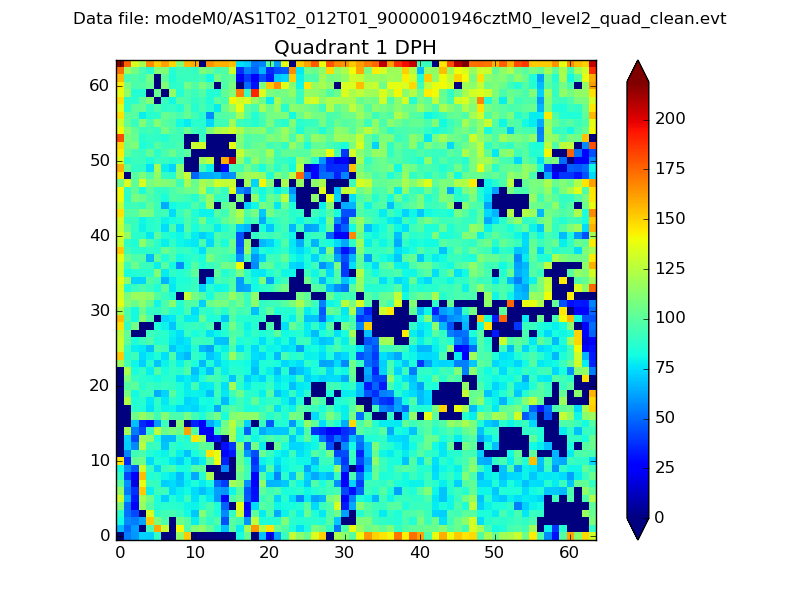
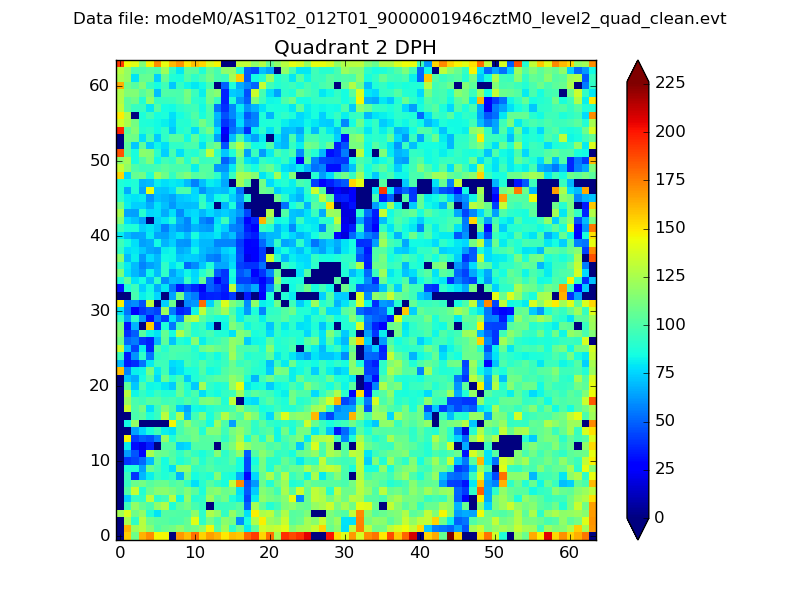
Histogram calculated using DETX and DETY for each event in the final _common_clean file
| Quadrant A |  |
 |
Quadrant B |
|---|---|---|---|
| Quadrant D |  |
 |
Quadrant C |
| Plot type | Count rate plots | Images |
|---|---|---|
| Comparison with Poisson distribution Blue bars denote a histogram of data divided into 1 sec bins. Red curve is a Poisson curve with rate = median count rate of data. |
 |
 |
| Quadrant-wise count rates Data is divided into 100 sec bins |
 |
|
| Module-wise count rates for Quadrant A Data is divided into 100 sec bins |
 |
 |
| Module-wise count rates for Quadrant B Data is divided into 100 sec bins |
 |
 |
| Module-wise count rates for Quadrant C Data is divided into 100 sec bins |
 |
 |
| Module-wise count rates for Quadrant D Data is divided into 100 sec bins |
 |
 |
| Parameter | Plot |
|---|---|
| CZT HV Monitor |  |
| D_VDD | 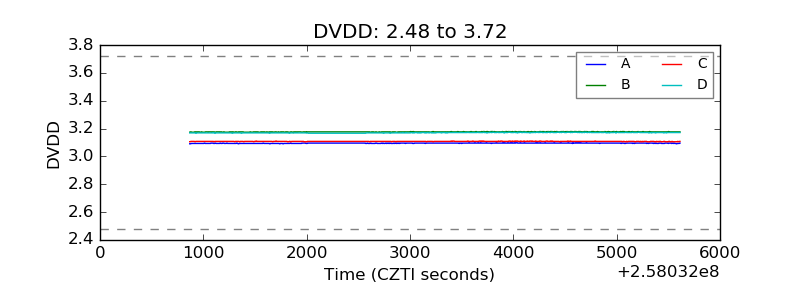 |
| Temperature 1 | 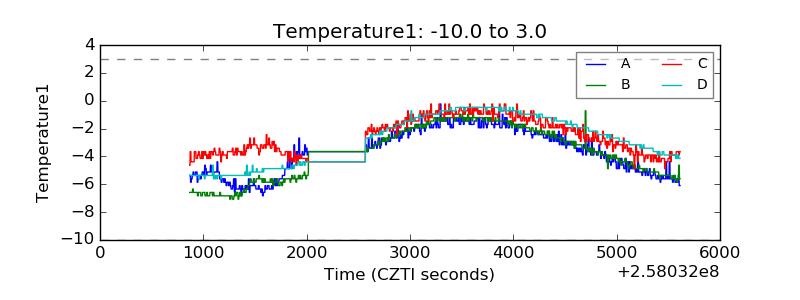 |
| Veto HV Monitor |  |
| Veto LLD | 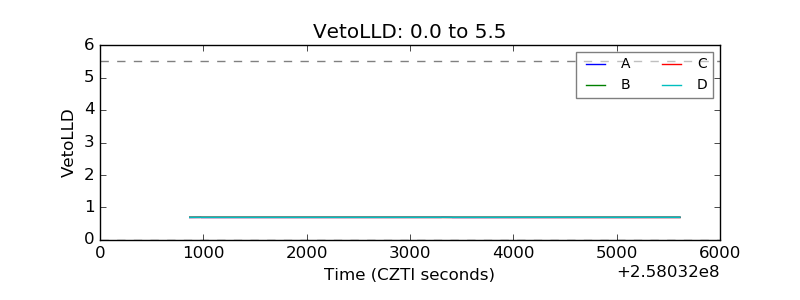 |
| Alpha Counter | 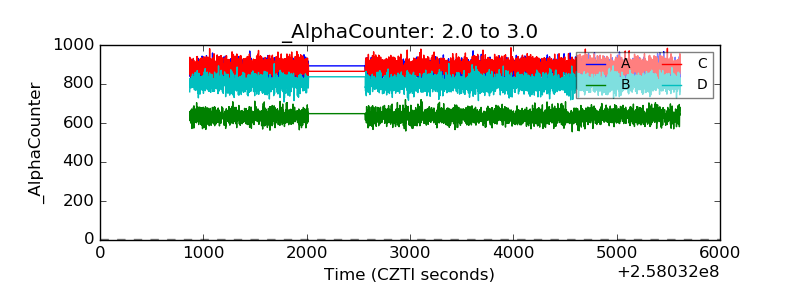 |
| _CPM_Rate |  |
| CZT Counter |  |
| +2.5 Volts monitor |  |
| +5 Volts monitor |  |
| _ROLL_ROT |  |
| _Roll_DEC |  |
| _Roll_RA |  |
| Veto Counter |  |