| Param | Original file | Final file |
|---|---|---|
| Filename | modeM0/AS1T02_012T02_9000001948_13180cztM0_level2.evt | modeM0/AS1T02_012T02_9000001948_13180cztM0_level2_quad_clean.evt |
| Size (bytes) | 351,912,960 | 49,792,320 |
| Size | 335.6 MB | 47.5 MB |
| Events in quadrant A | 2,528,879 | 307,295 |
| Events in quadrant B | 2,738,787 | 295,868 |
| Events in quadrant C | 1,993,416 | 306,020 |
| Events in quadrant D | 3,096,428 | 287,946 |
| Mode M0 | |||
|---|---|---|---|
| Quadrant | BADHDUFLAG | Total packets | Discarded packets |
| A | 0 | 10429 | 2 |
| B | 0 | 10986 | 1 |
| C | 0 | 8987 | 1 |
| D | 0 | 12215 | 1 |
| Mode SS | |||
|---|---|---|---|
| Quadrant | BADHDUFLAG | Total packets | Discarded packets |
| A | 0 | 90 | 0 |
| B | 0 | 90 | 0 |
| C | 0 | 90 | 0 |
| D | 0 | 90 | 0 |
| Mode M9 | |||
|---|---|---|---|
| Quadrant | BADHDUFLAG | Total packets | Discarded packets |
| A | 0 | 7 | 0 |
| B | 0 | 7 | 0 |
| C | 0 | 7 | 0 |
| D | 0 | 7 | 0 |
| Quadrant | Total seconds | Saturated seconds | Saturation percentage |
|---|---|---|---|
| A | 4408 | 50 | 1.134301% |
| B | 4408 | 272 | 6.170599% |
| C | 4408 | 24 | 0.544465% |
| D | 4408 | 308 | 6.987296% |
Noise dominated data is calculated using 1-second bins in cleaned event files. If a bin has >2000 counts, and if more than 50% of those come from <1% of pixels, then it is considered to be noise-dominated and hence unusable.
| Quadrant | # 1 sec bins | Bins with >0 counts | Bins with >2000 counts | High rate bins dominated by noise | Noise dominated (total time) | Noise dominated (detector-on time) | Marked lightcurve |
|---|---|---|---|---|---|---|---|
| A | 5144 | 4410 | 0 | 0 | 0.00% | 0.00% | 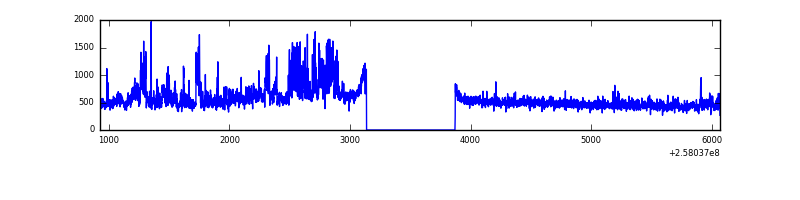 |
| B | 5144 | 4410 | 156 | 156 | 3.03% | 3.54% | 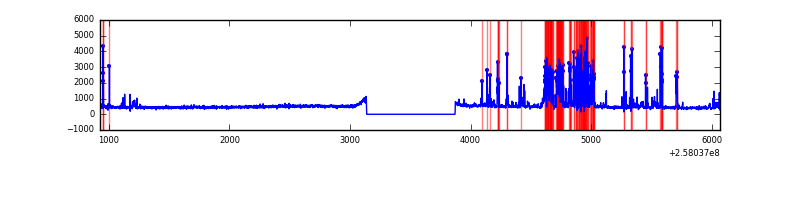 |
| C | 5144 | 4410 | 1 | 1 | 0.02% | 0.02% | 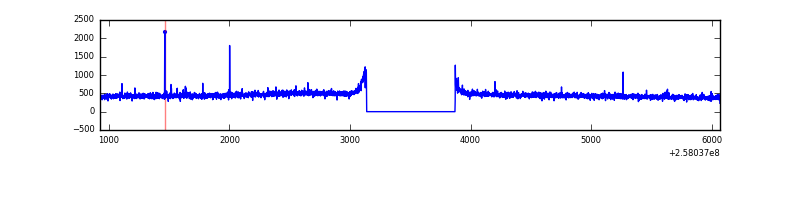 |
| D | 5144 | 4410 | 193 | 193 | 3.75% | 4.38% | 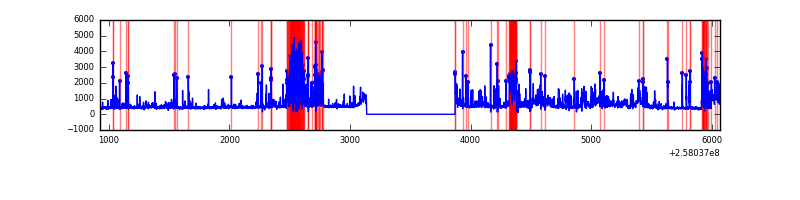 |
Top three noisy pixels from each quadrant. If the there are fewer than three noisy pixels in the level2.evt file, extra rows are filled as -1
| Pixel properties | Quadrant properties | ||||||
|---|---|---|---|---|---|---|---|
| Quadrant | DetID | PixID | Counts | Sigma | Mean | Median | Sigma |
| A | 0 | 23 | 222090 | 2058.37 | 520 | 508 | 107.6 |
| A | 12 | 189 | 198816 | 1842.17 | 520 | 508 | 107.6 |
| A | 15 | 222 | 29236 | 266.87 | 520 | 508 | 107.6 |
| B | 4 | 239 | 647861 | 6527.09 | 509 | 495 | 99.2 |
| B | 3 | 64 | 29696 | 294.42 | 509 | 495 | 99.2 |
| B | 0 | 197 | 15187 | 148.13 | 509 | 495 | 99.2 |
| C | 15 | 208 | 12199 | 98.1 | 506 | 508 | 119.2 |
| C | 14 | 234 | 3698 | 26.77 | 506 | 508 | 119.2 |
| C | 13 | 61 | 3595 | 25.9 | 506 | 508 | 119.2 |
| D | 1 | 52 | 609954 | 5070.79 | 492 | 477 | 120.2 |
| D | 1 | 7 | 352853 | 2931.74 | 492 | 477 | 120.2 |
| D | 10 | 157 | 133131 | 1103.67 | 492 | 477 | 120.2 |
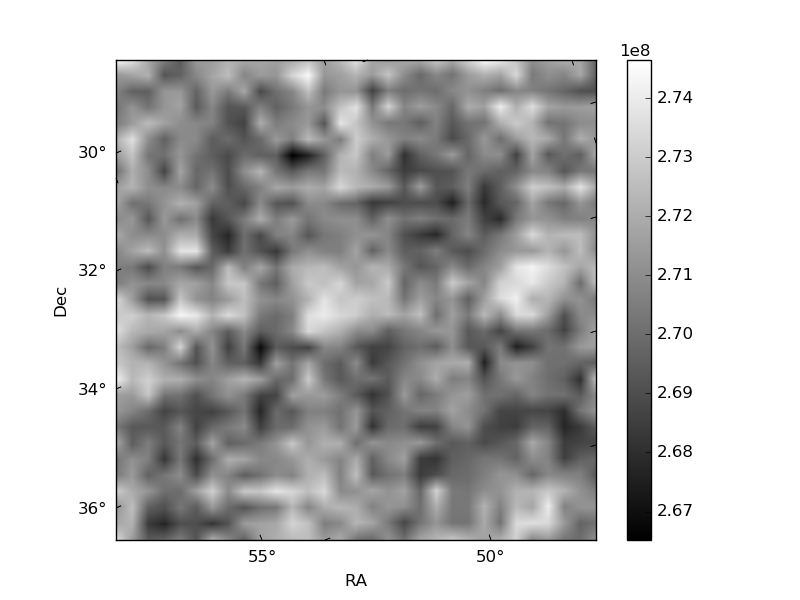
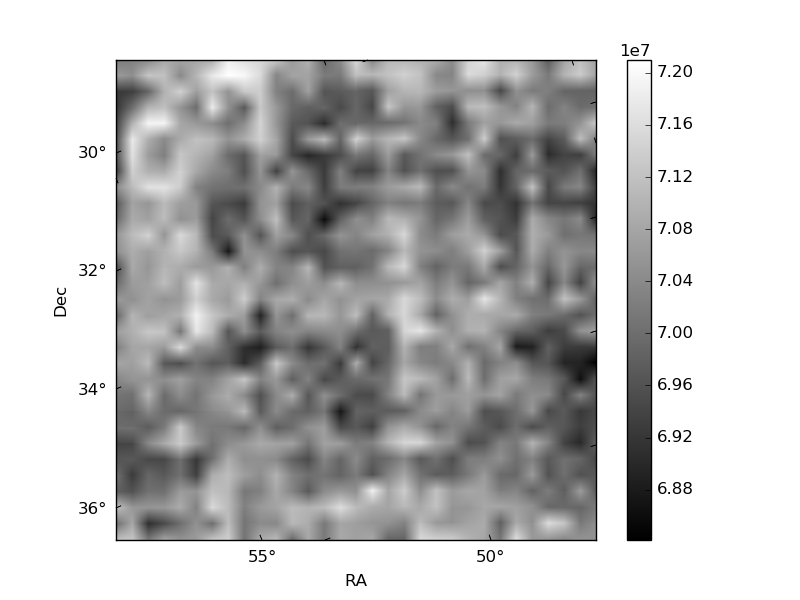
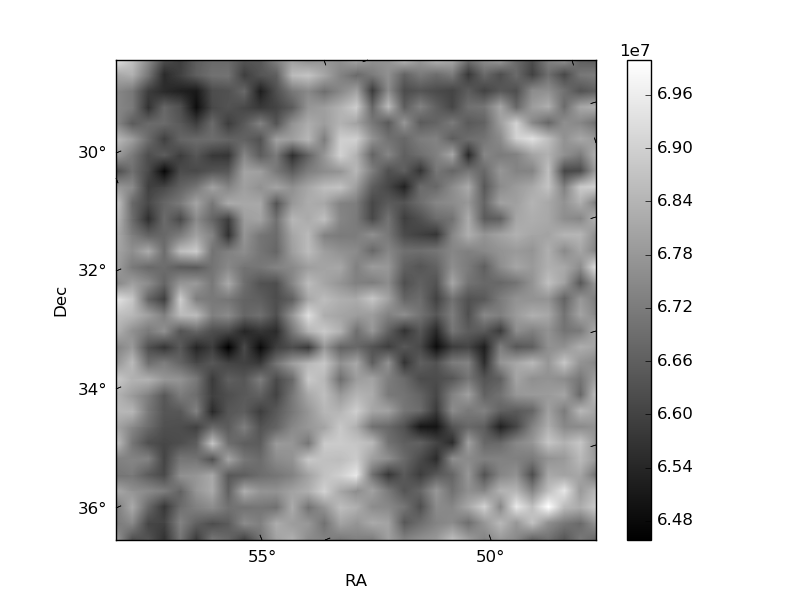
Histogram calculated using DETX and DETY for each event in the final _common_clean file
| Quadrant A | 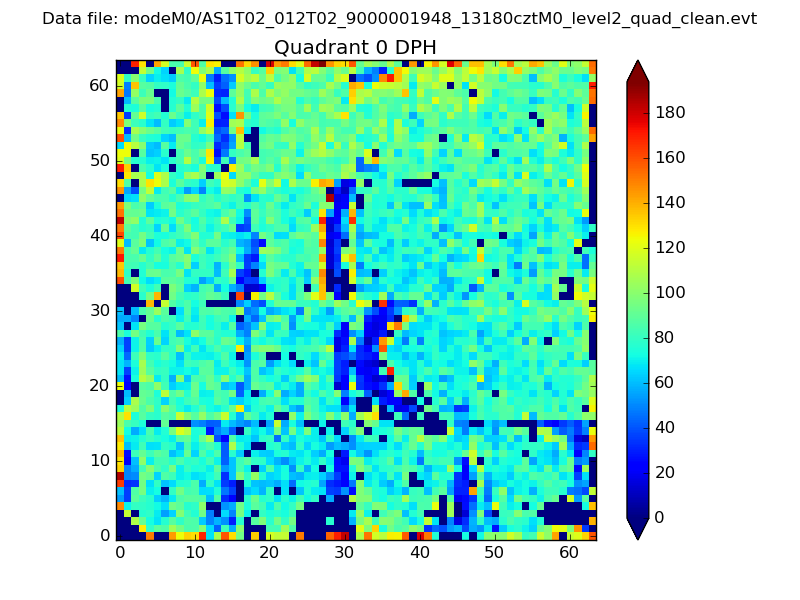 |
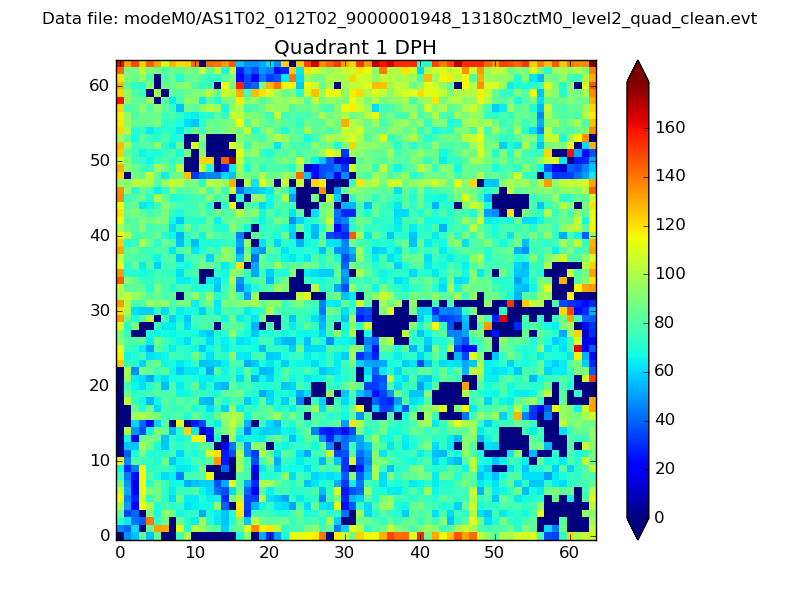 |
Quadrant B |
|---|---|---|---|
| Quadrant D |  |
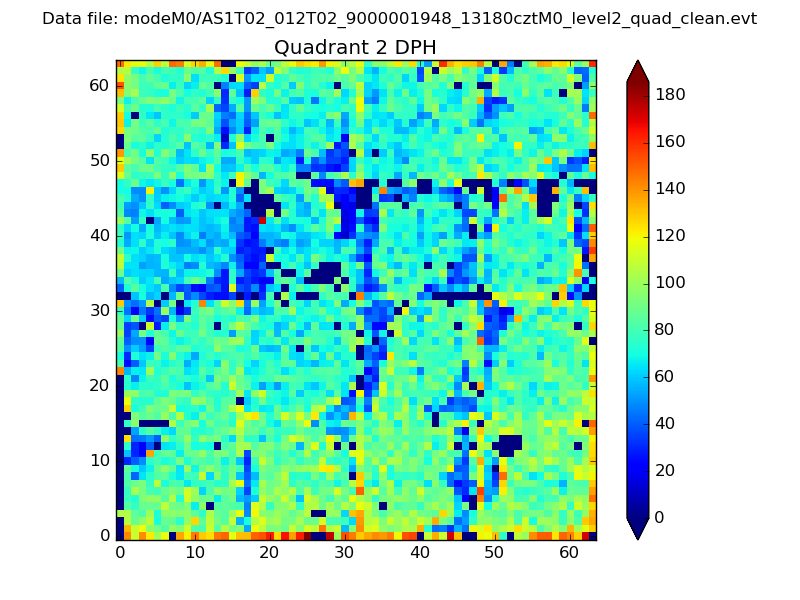 |
Quadrant C |
| Plot type | Count rate plots | Images |
|---|---|---|
| Comparison with Poisson distribution Blue bars denote a histogram of data divided into 1 sec bins. Red curve is a Poisson curve with rate = median count rate of data. |
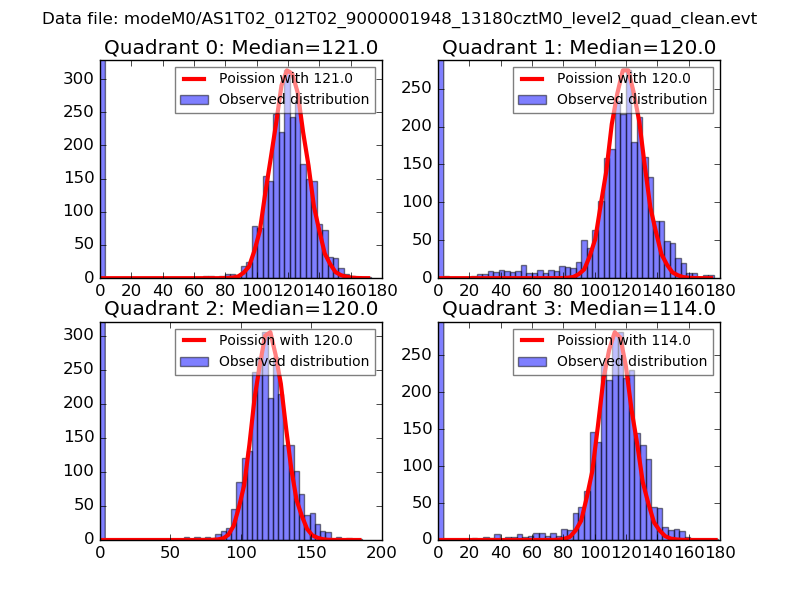 |
 |
| Quadrant-wise count rates Data is divided into 100 sec bins |
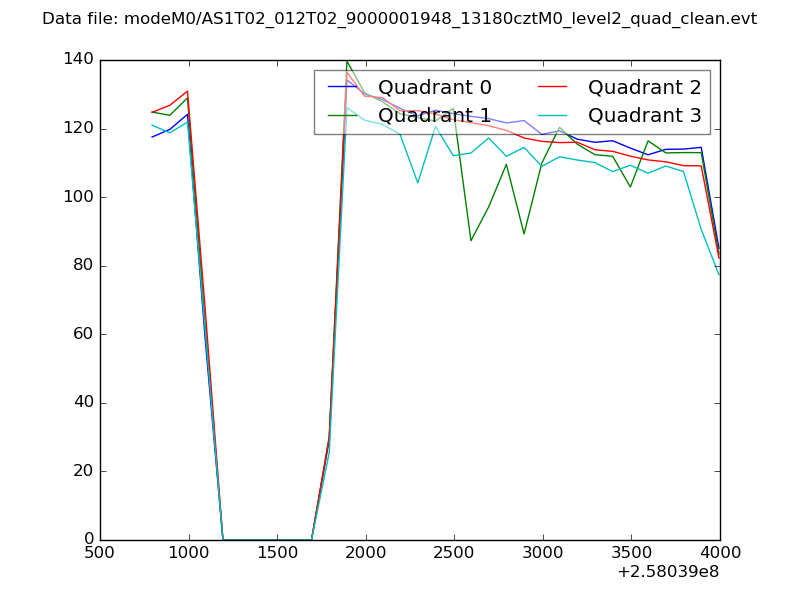 |
|
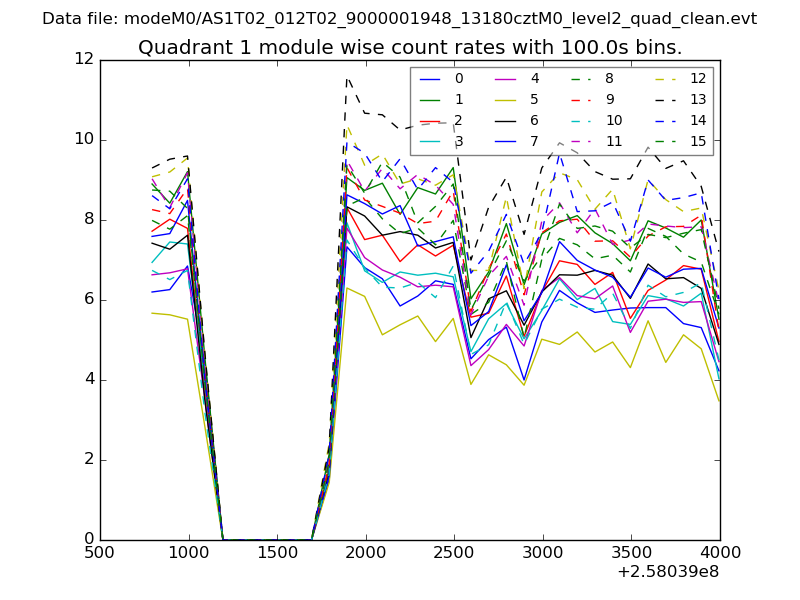
| Module-wise count rates for Quadrant A Data is divided into 100 sec bins |
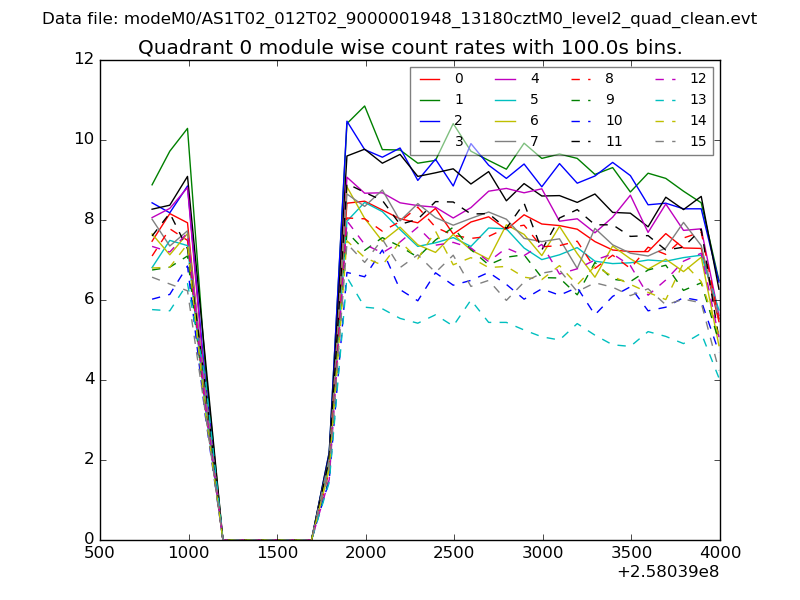 |
 |
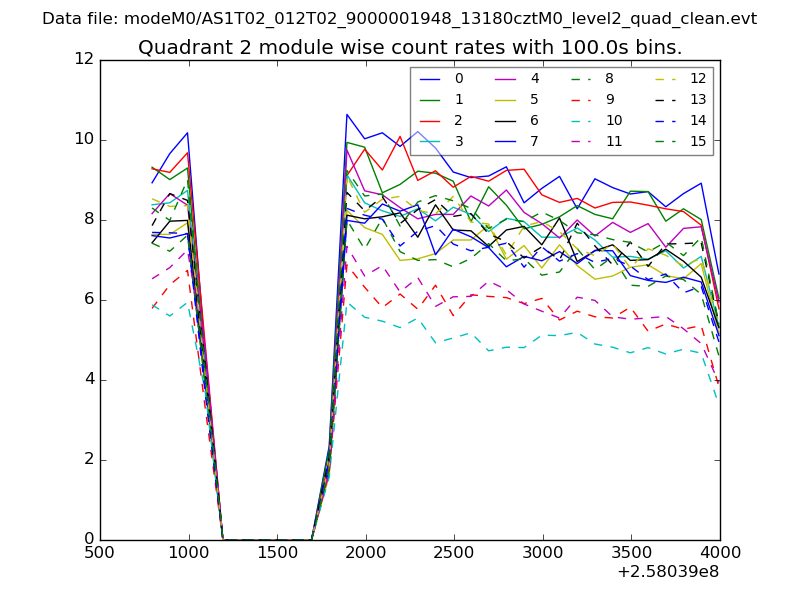
| Module-wise count rates for Quadrant B Data is divided into 100 sec bins |
 |
 |
| Module-wise count rates for Quadrant C Data is divided into 100 sec bins |
 |
 |
| Module-wise count rates for Quadrant D Data is divided into 100 sec bins |
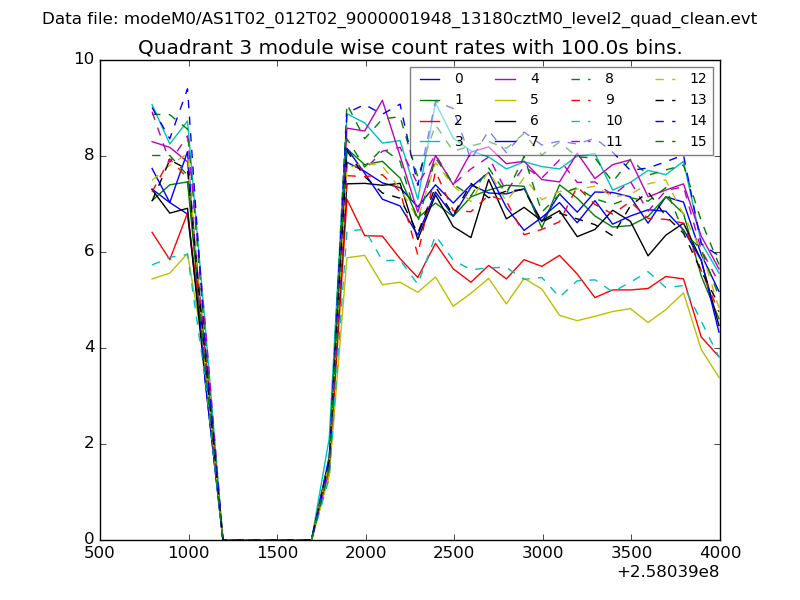 |
 |
| Parameter | Plot |
|---|---|
| CZT HV Monitor | 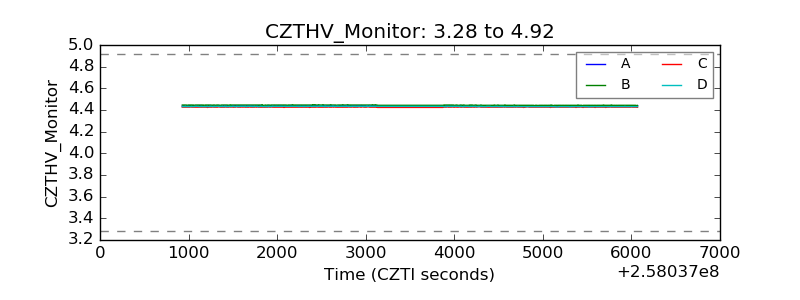 |
| D_VDD | 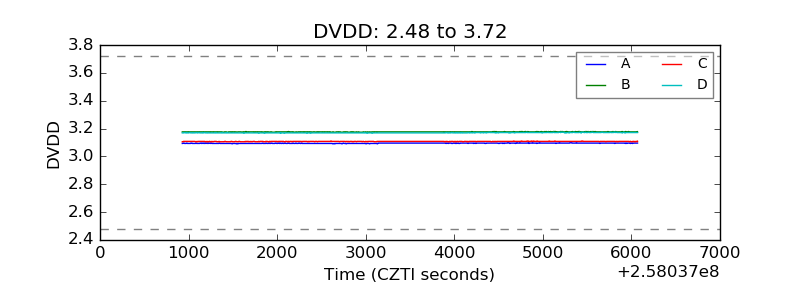 |
| Temperature 1 | 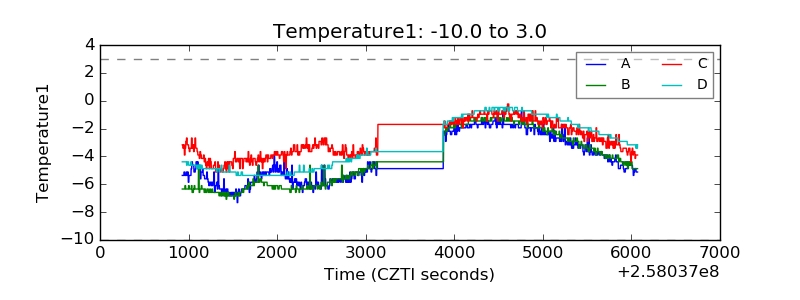 |
| Veto HV Monitor |  |
| Veto LLD | 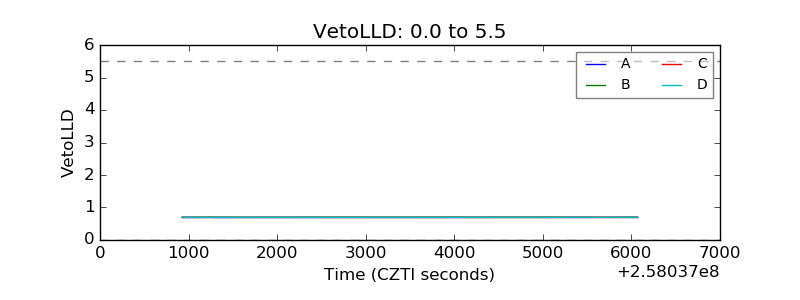 |
| Alpha Counter | 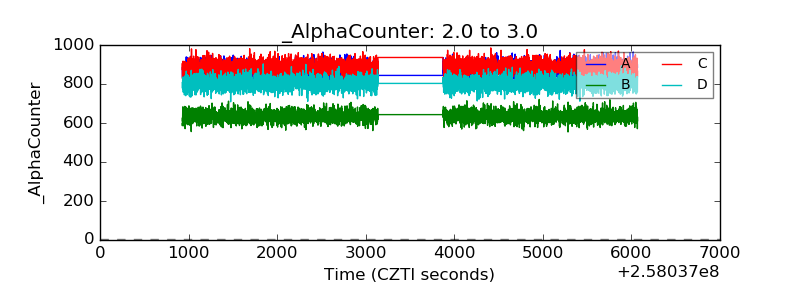 |
| _CPM_Rate | 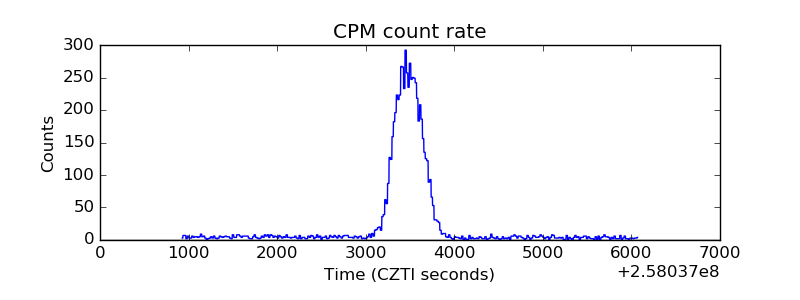 |
| CZT Counter | 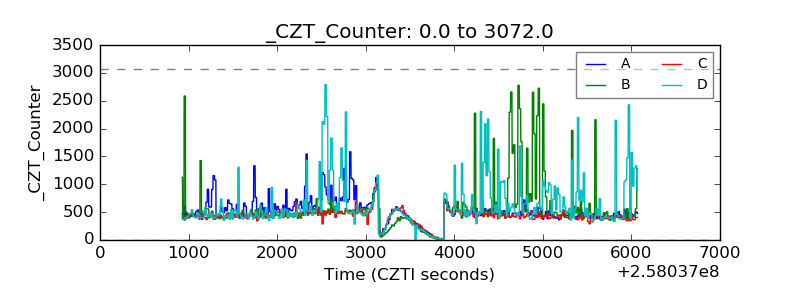 |
| +2.5 Volts monitor |  |
| +5 Volts monitor | 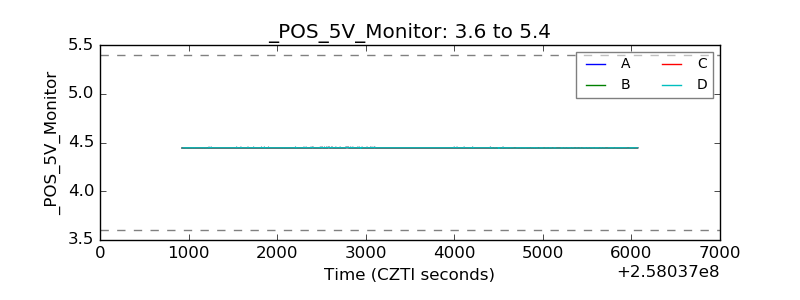 |
| _ROLL_ROT | 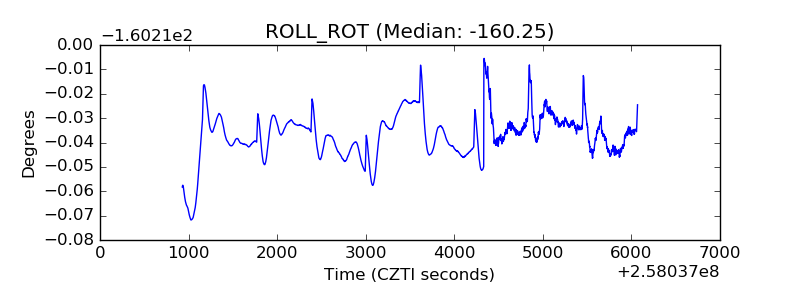 |
| _Roll_DEC | 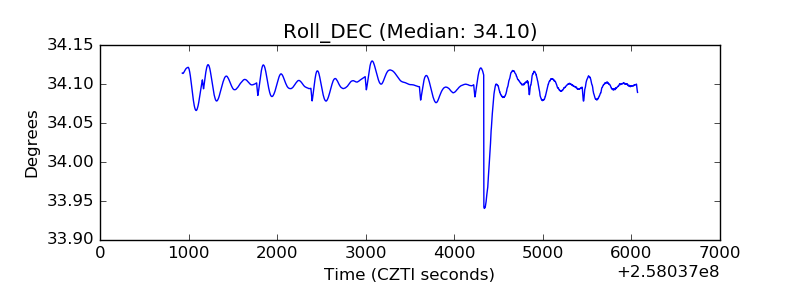 |
| _Roll_RA | 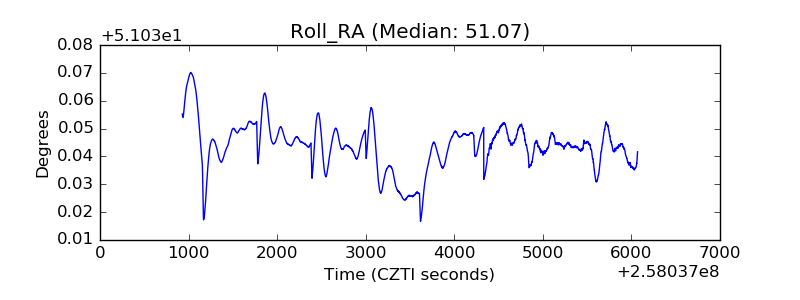 |
| Veto Counter | 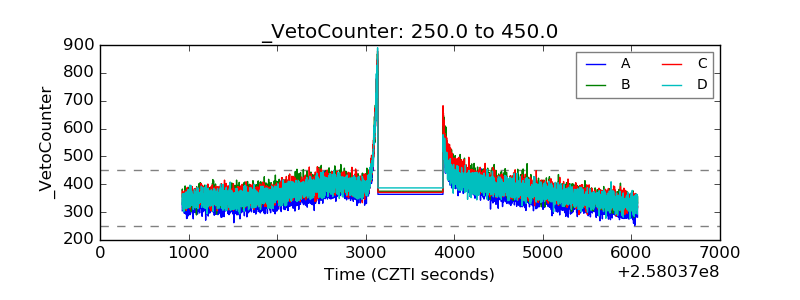 |