| Param | Original file | Final file |
|---|---|---|
| Filename | modeM0/AS1T02_012T02_9000001948_13181cztM0_level2.evt | modeM0/AS1T02_012T02_9000001948_13181cztM0_level2_quad_clean.evt |
| Size (bytes) | 380,574,720 | 55,825,920 |
| Size | 362.9 MB | 53.2 MB |
| Events in quadrant A | 2,682,719 | 347,970 |
| Events in quadrant B | 2,914,926 | 337,020 |
| Events in quadrant C | 2,135,809 | 345,432 |
| Events in quadrant D | 3,467,179 | 324,244 |
| Mode M0 | |||
|---|---|---|---|
| Quadrant | BADHDUFLAG | Total packets | Discarded packets |
| A | 0 | 11166 | 1 |
| B | 0 | 11786 | 1 |
| C | 0 | 9718 | 1 |
| D | 0 | 13581 | 1 |
| Mode SS | |||
|---|---|---|---|
| Quadrant | BADHDUFLAG | Total packets | Discarded packets |
| A | 0 | 98 | 0 |
| B | 0 | 98 | 0 |
| C | 0 | 98 | 0 |
| D | 0 | 98 | 0 |
| Mode M9 | |||
|---|---|---|---|
| Quadrant | BADHDUFLAG | Total packets | Discarded packets |
| A | 0 | 7 | 0 |
| B | 0 | 7 | 0 |
| C | 0 | 7 | 0 |
| D | 0 | 7 | 0 |
| Quadrant | Total seconds | Saturated seconds | Saturation percentage |
|---|---|---|---|
| A | 4772 | 50 | 1.047779% |
| B | 4772 | 274 | 5.741827% |
| C | 4772 | 24 | 0.502934% |
| D | 4772 | 323 | 6.768650% |
Noise dominated data is calculated using 1-second bins in cleaned event files. If a bin has >2000 counts, and if more than 50% of those come from <1% of pixels, then it is considered to be noise-dominated and hence unusable.
| Quadrant | # 1 sec bins | Bins with >0 counts | Bins with >2000 counts | High rate bins dominated by noise | Noise dominated (total time) | Noise dominated (detector-on time) | Marked lightcurve |
|---|---|---|---|---|---|---|---|
| A | 5508 | 4774 | 0 | 0 | 0.00% | 0.00% | 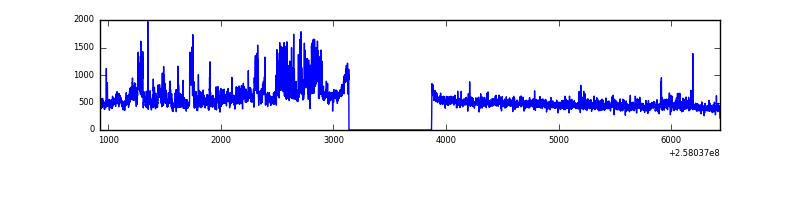 |
| B | 5508 | 4774 | 159 | 159 | 2.89% | 3.33% | 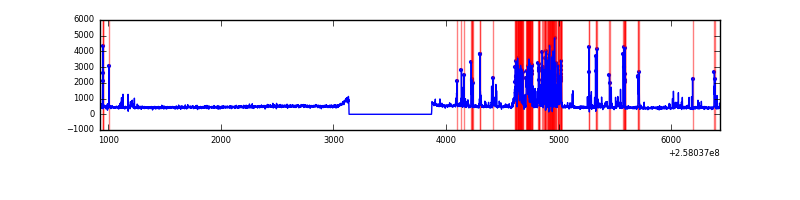 |
| C | 5508 | 4774 | 1 | 1 | 0.02% | 0.02% | 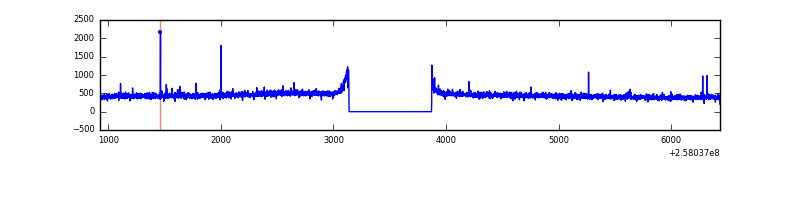 |
| D | 5508 | 4774 | 215 | 215 | 3.90% | 4.50% | 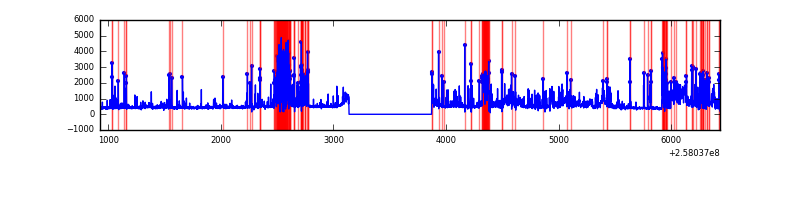 |
Top three noisy pixels from each quadrant. If the there are fewer than three noisy pixels in the level2.evt file, extra rows are filled as -1
| Pixel properties | Quadrant properties | ||||||
|---|---|---|---|---|---|---|---|
| Quadrant | DetID | PixID | Counts | Sigma | Mean | Median | Sigma |
| A | 0 | 23 | 222235 | 1930.33 | 556 | 543 | 114.8 |
| A | 12 | 189 | 199222 | 1729.95 | 556 | 543 | 114.8 |
| A | 15 | 222 | 33834 | 289.87 | 556 | 543 | 114.8 |
| B | 4 | 239 | 677075 | 6389.85 | 546 | 531 | 105.9 |
| B | 3 | 64 | 30019 | 278.51 | 546 | 531 | 105.9 |
| B | 0 | 189 | 16280 | 148.75 | 546 | 531 | 105.9 |
| C | 15 | 208 | 14849 | 112.2 | 542 | 545 | 127.5 |
| C | 14 | 234 | 3950 | 26.71 | 542 | 545 | 127.5 |
| C | 13 | 61 | 3837 | 25.82 | 542 | 545 | 127.5 |
| D | 1 | 52 | 836387 | 6514.84 | 527 | 511 | 128.3 |
| D | 1 | 7 | 352907 | 2746.58 | 527 | 511 | 128.3 |
| D | 10 | 157 | 140934 | 1094.46 | 527 | 511 | 128.3 |
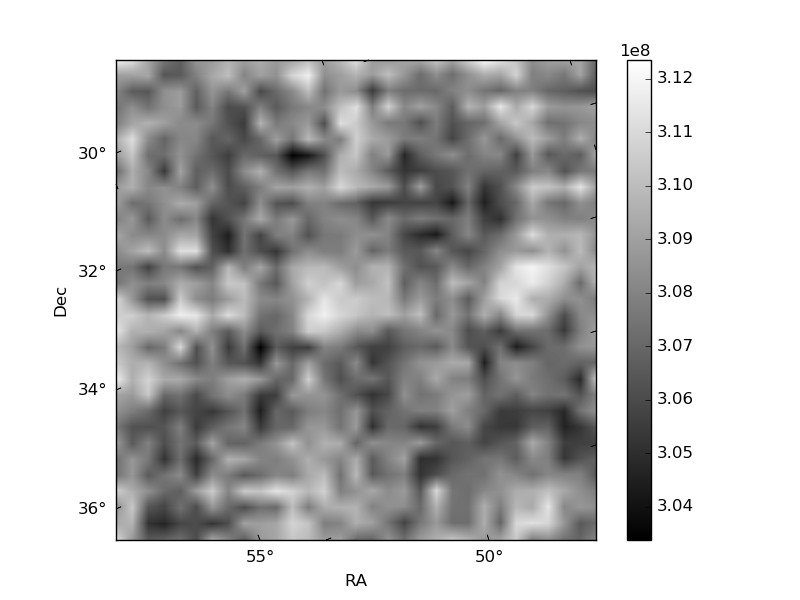
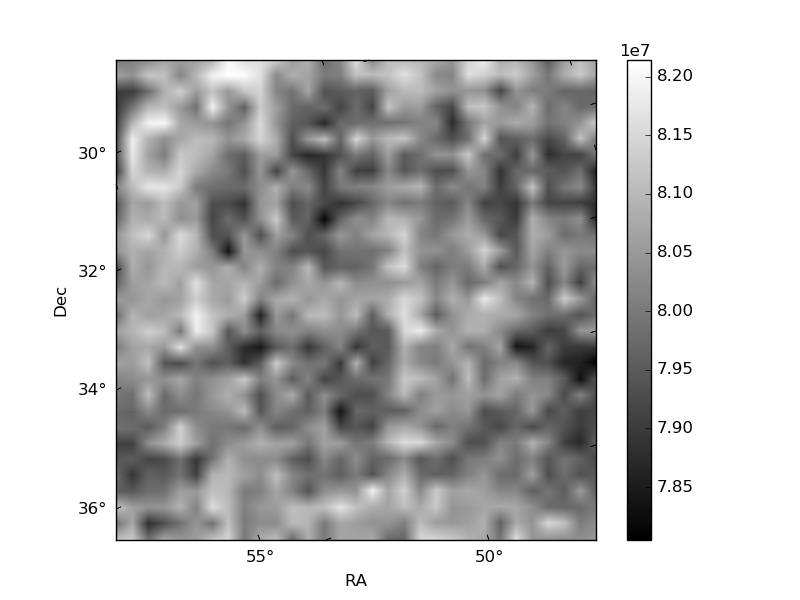
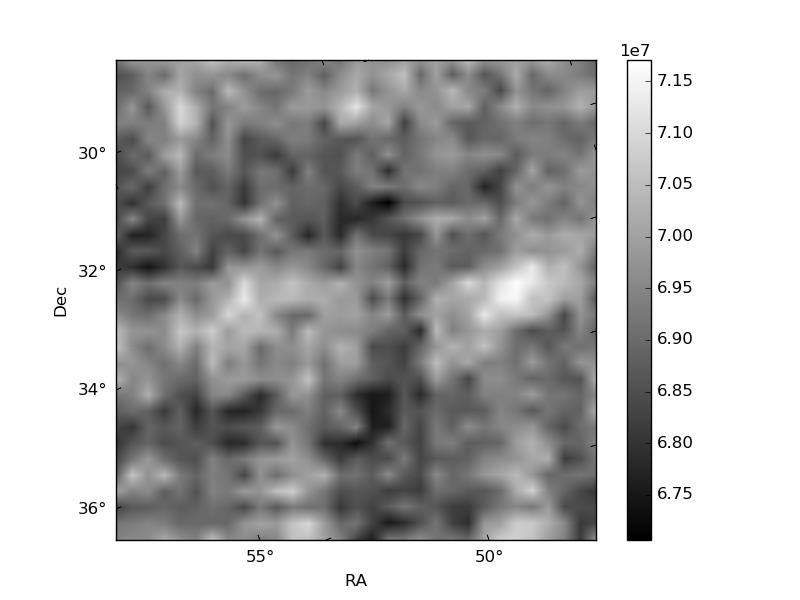
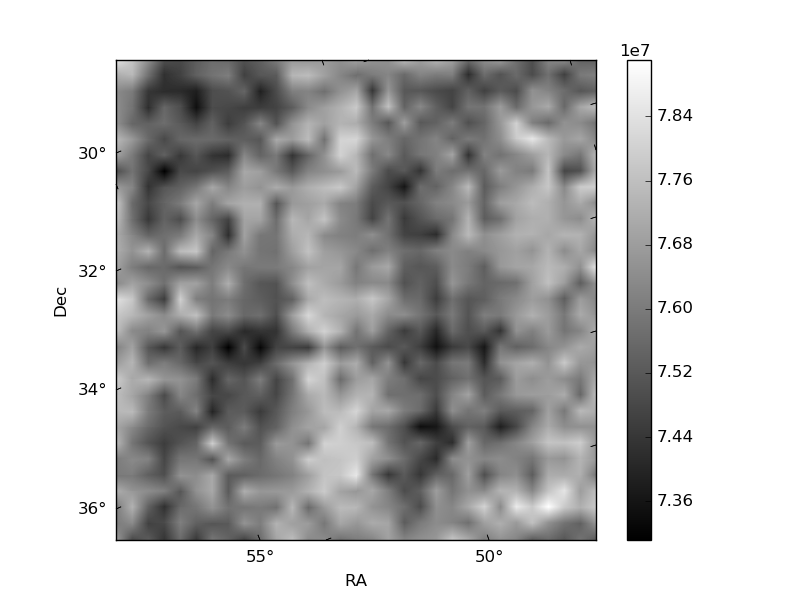
Histogram calculated using DETX and DETY for each event in the final _common_clean file
| Quadrant A | 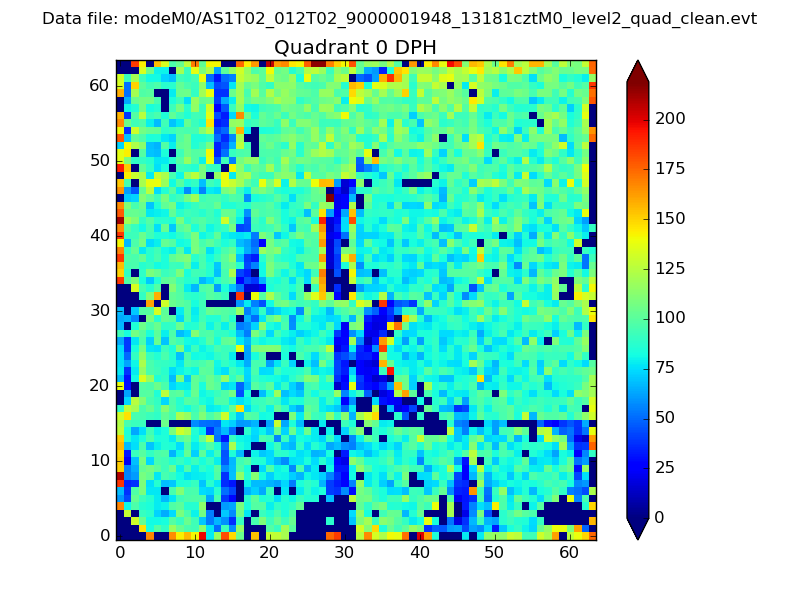 |
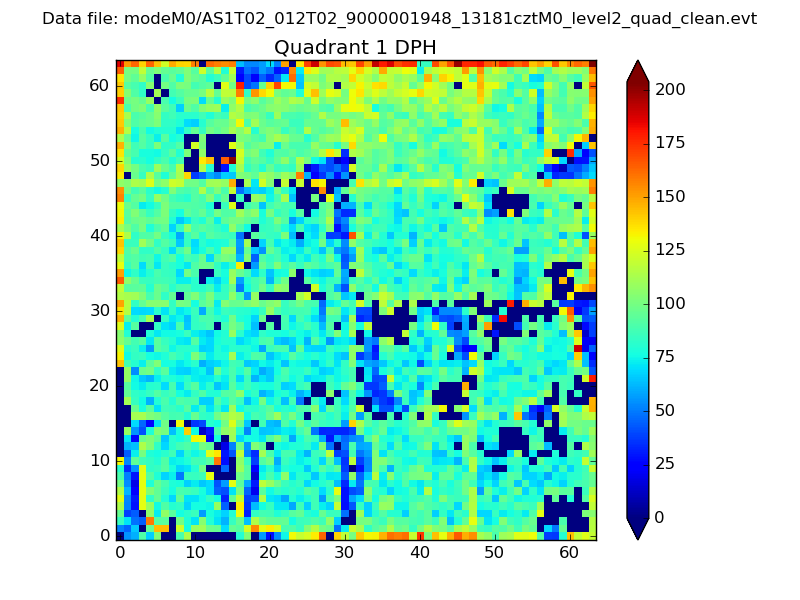 |
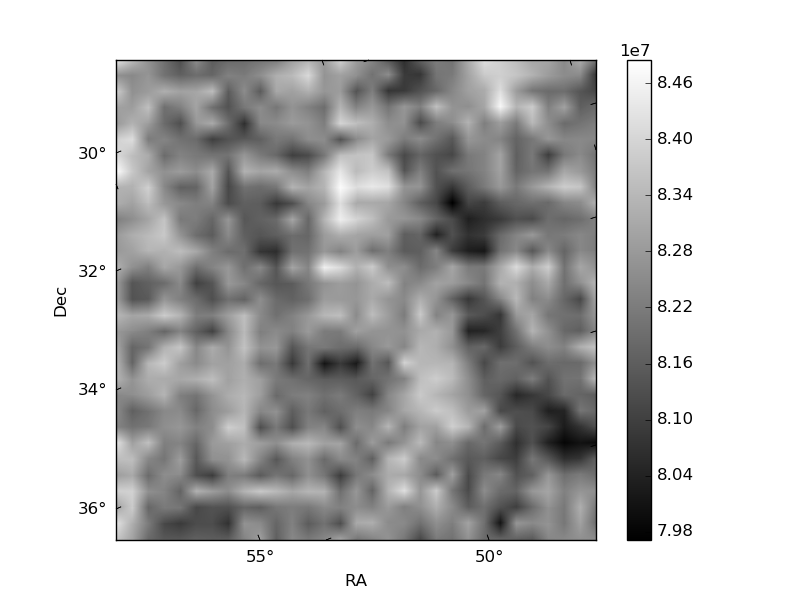
Quadrant B |
|---|---|---|---|
| Quadrant D | 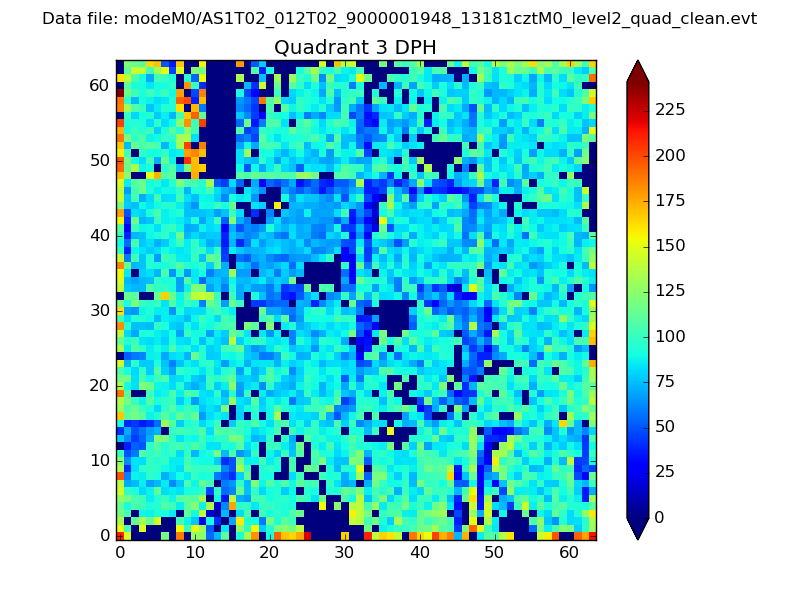 |
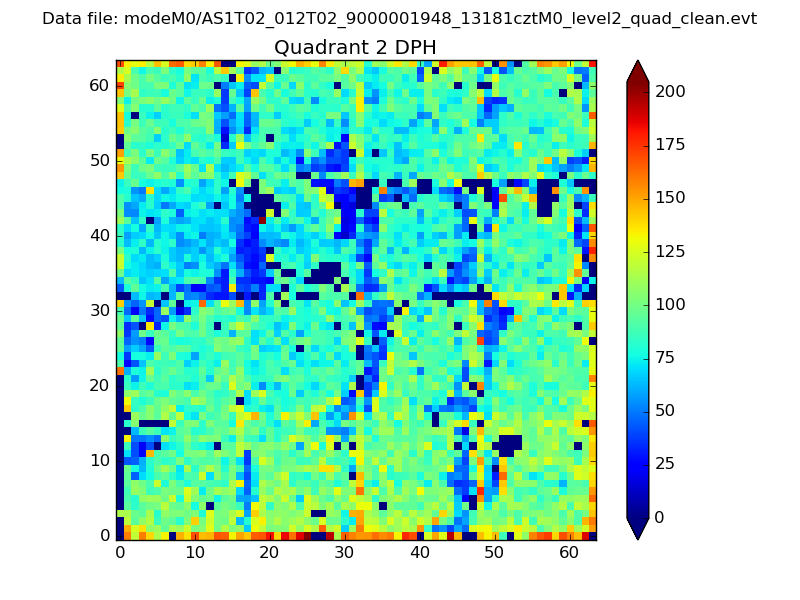 |
Quadrant C |
| Plot type | Count rate plots | Images |
|---|---|---|
| Comparison with Poisson distribution Blue bars denote a histogram of data divided into 1 sec bins. Red curve is a Poisson curve with rate = median count rate of data. |
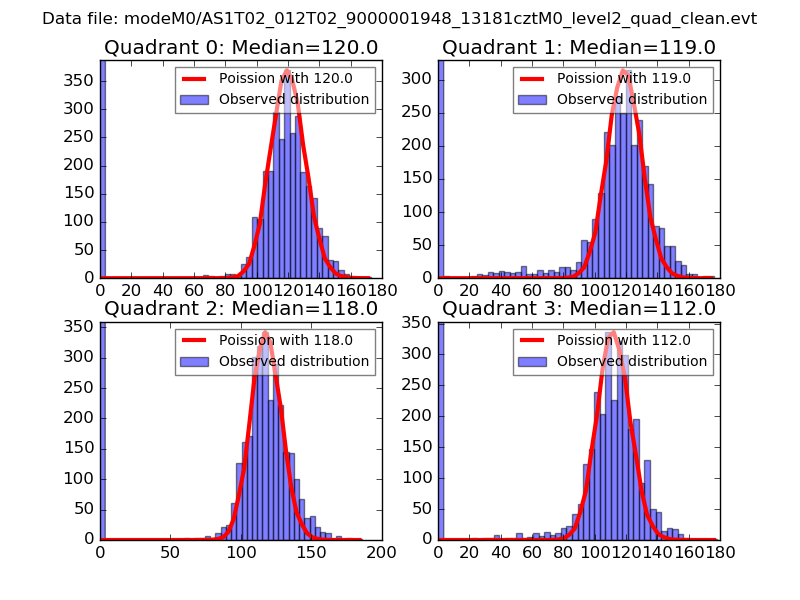 |
 |
| Quadrant-wise count rates Data is divided into 100 sec bins |
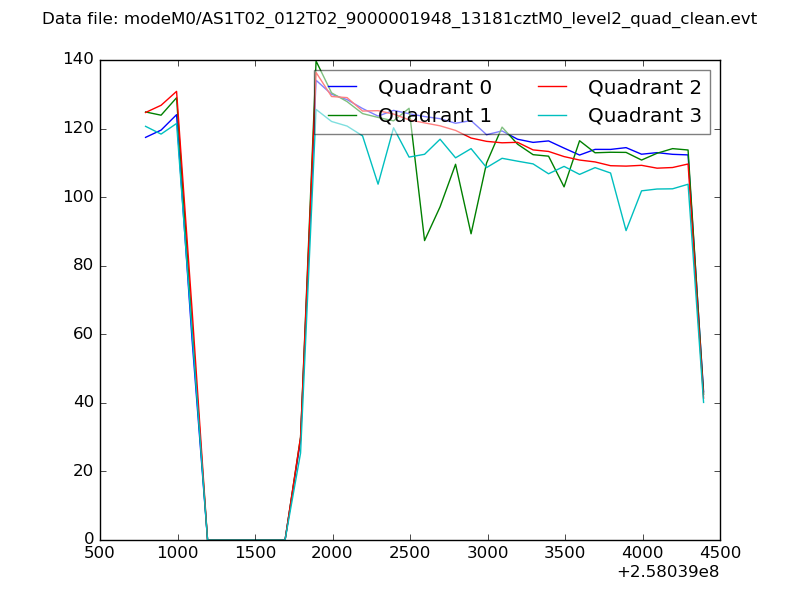 |
|
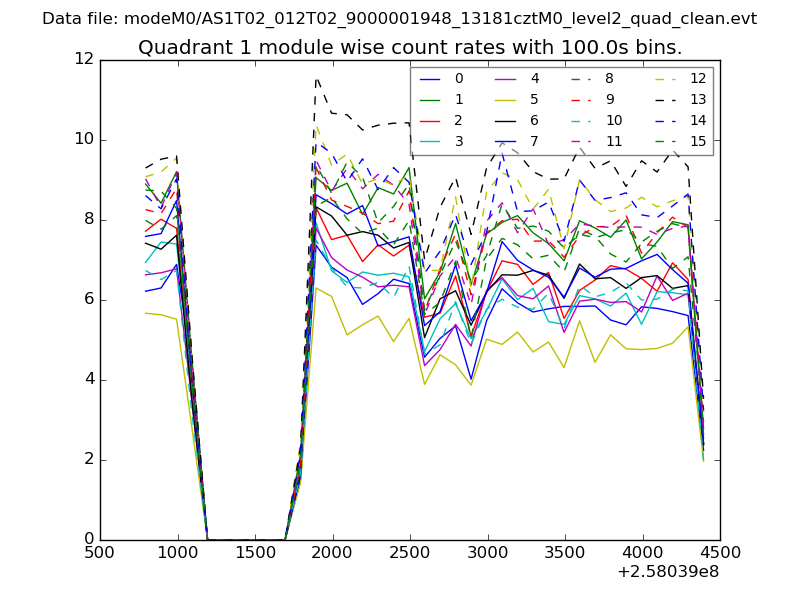
| Module-wise count rates for Quadrant A Data is divided into 100 sec bins |
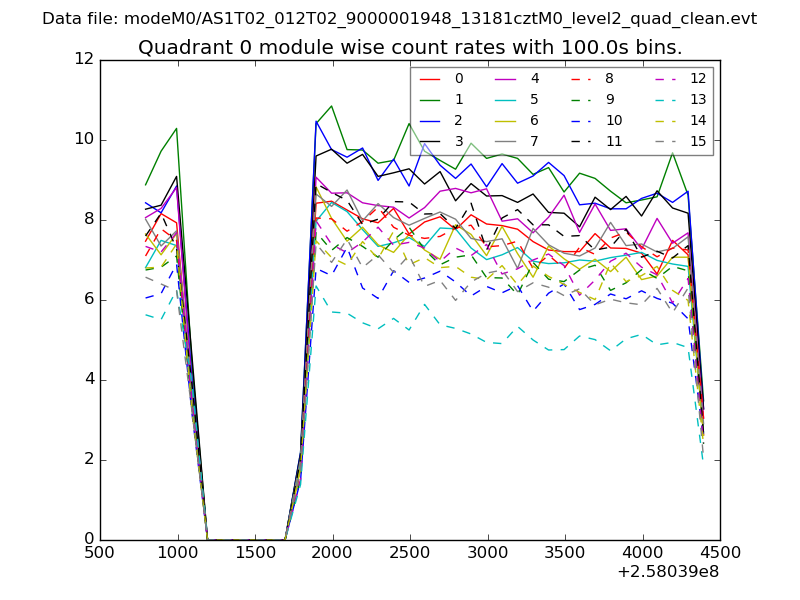 |
 |
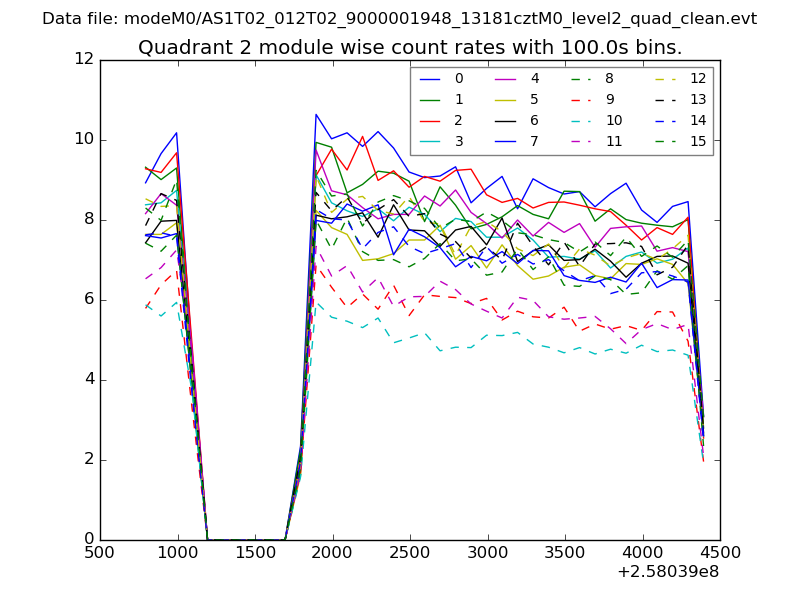
| Module-wise count rates for Quadrant B Data is divided into 100 sec bins |
 |
 |
| Module-wise count rates for Quadrant C Data is divided into 100 sec bins |
 |
 |
| Module-wise count rates for Quadrant D Data is divided into 100 sec bins |
 |
 |
| Parameter | Plot |
|---|---|
| CZT HV Monitor | 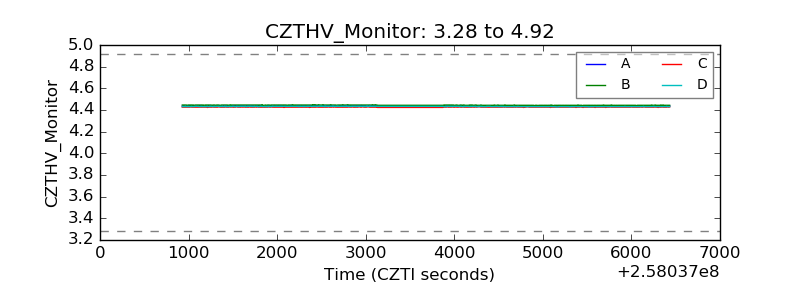 |
| D_VDD | 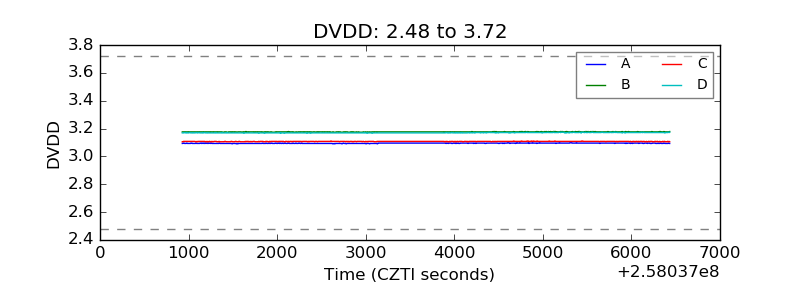 |
| Temperature 1 | 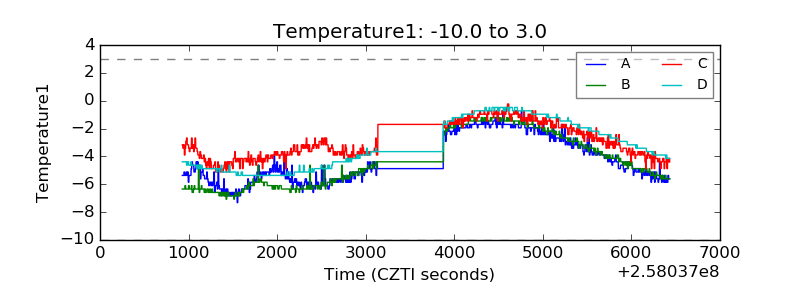 |
| Veto HV Monitor | 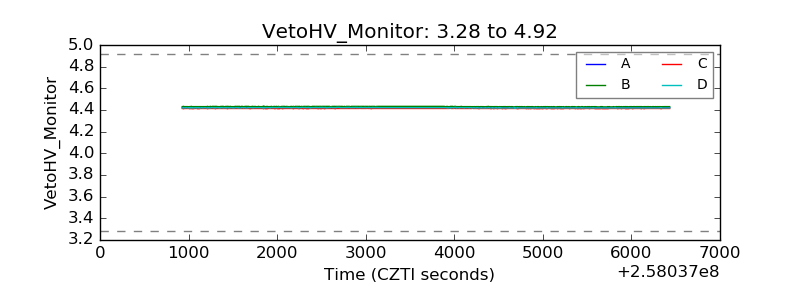 |
| Veto LLD |  |
| Alpha Counter | 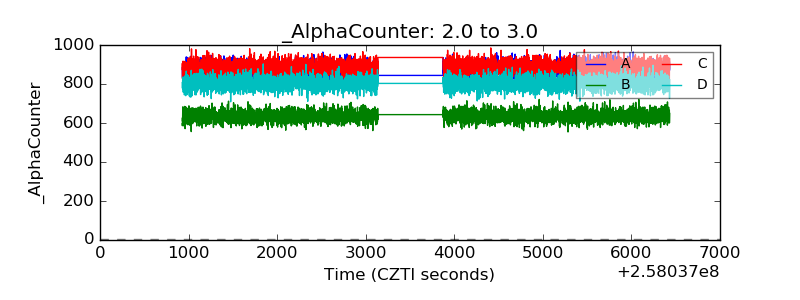 |
| _CPM_Rate | 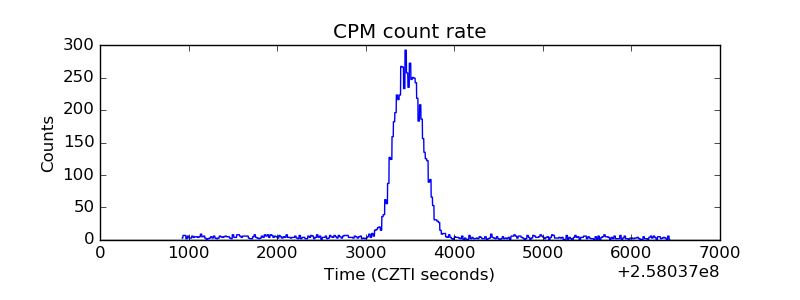 |
| CZT Counter | 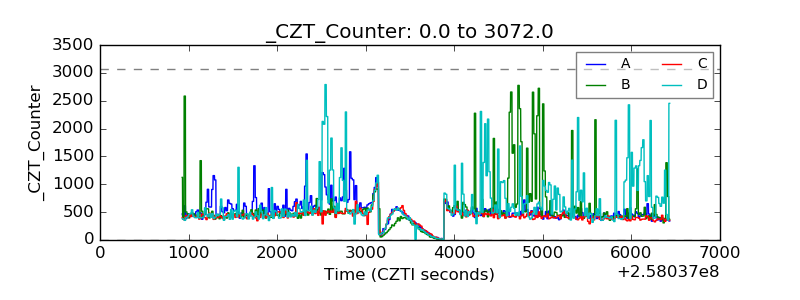 |
| +2.5 Volts monitor |  |
| +5 Volts monitor |  |
| _ROLL_ROT | 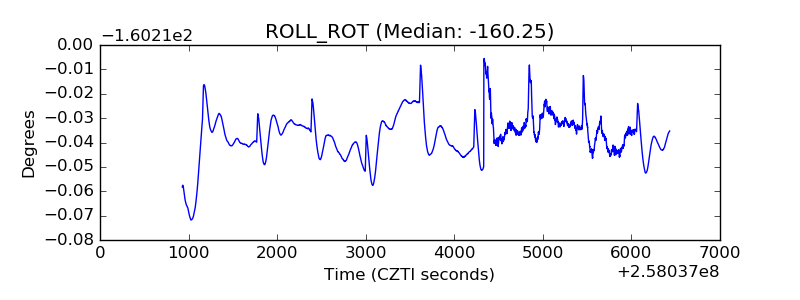 |
| _Roll_DEC | 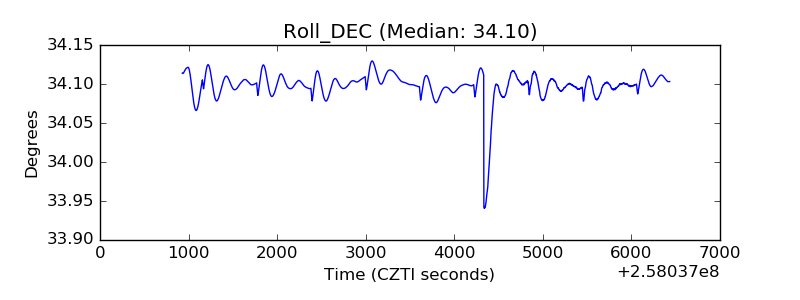 |
| _Roll_RA | 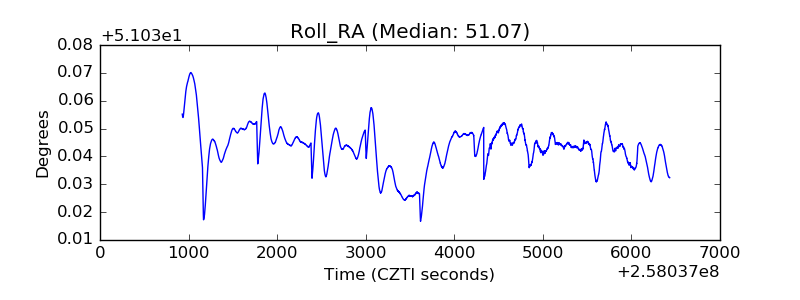 |
| Veto Counter |  |