| Param | Original file | Final file |
|---|---|---|
| Filename | modeM0/AS1T02_012T03_9000001950cztM0_level2.fits | modeM0/AS1T02_012T03_9000001950cztM0_level2_quad_clean.evt |
| Size (bytes) | 38,306,880 | 27,169,920 |
| Size | 36.5 MB | 25.9 MB |
| Events in quadrant A | 228,470 | 141,630 |
| Events in quadrant B | 216,856 | 134,593 |
| Events in quadrant C | 228,684 | 135,219 |
| Events in quadrant D | 194,614 | 118,650 |
| Mode M9 | |||
|---|---|---|---|
| Quadrant | BADHDUFLAG | Total packets | Discarded packets |
| A | 0 | 9 | 0 |
| B | 0 | 9 | 0 |
| C | 0 | 9 | 0 |
| D | 0 | 9 | 0 |
| Mode M0 | |||
|---|---|---|---|
| Quadrant | BADHDUFLAG | Total packets | Discarded packets |
| A | 0 | 8630 | 0 |
| B | 0 | 10421 | 0 |
| C | 0 | 8439 | 0 |
| D | 0 | 11383 | 0 |
| Mode SS | |||
|---|---|---|---|
| Quadrant | BADHDUFLAG | Total packets | Discarded packets |
| A | 0 | 84 | 0 |
| B | 0 | 84 | 0 |
| C | 0 | 84 | 0 |
| D | 0 | 84 | 0 |
| Quadrant | Total seconds | Saturated seconds | Saturation percentage |
|---|---|---|---|
| A | 4140 | 30 | 0.724638% |
| B | 4140 | 240 | 5.797101% |
| C | 4140 | 15 | 0.362319% |
| D | 4140 | 187 | 4.516908% |
Noise dominated data is calculated using 1-second bins in cleaned event files. If a bin has >2000 counts, and if more than 50% of those come from <1% of pixels, then it is considered to be noise-dominated and hence unusable.
| Quadrant | # 1 sec bins | Bins with >0 counts | Bins with >2000 counts | High rate bins dominated by noise | Noise dominated (total time) | Noise dominated (detector-on time) | Marked lightcurve |
|---|---|---|---|---|---|---|---|
| A | 5025 | 4140 | 0 | 0 | 0.00% | 0.00% | 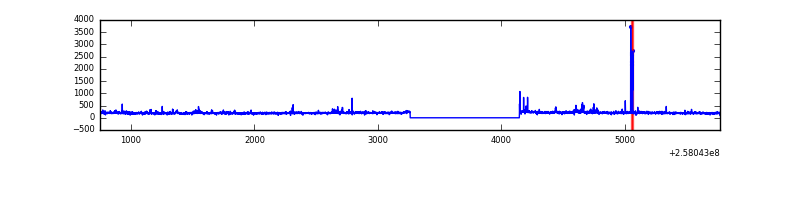 |
| B | 5025 | 4118 | 0 | 0 | 0.00% | 0.00% | 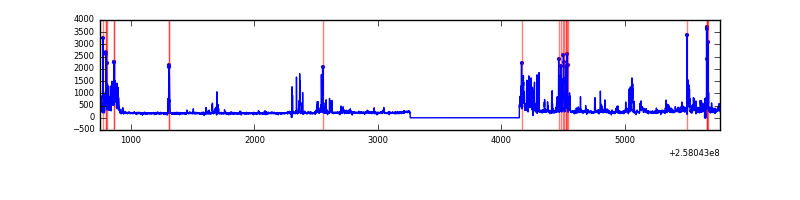 |
| C | 5025 | 4140 | 0 | 0 | 0.00% | 0.00% | 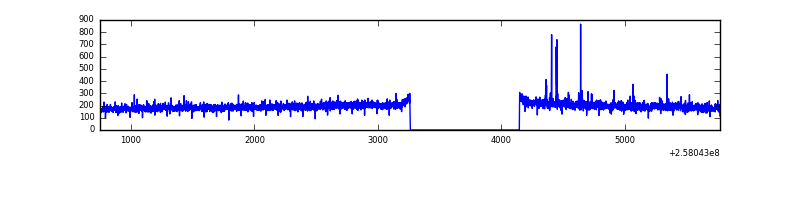 |
| D | 5025 | 4140 | 0 | 0 | 0.00% | 0.00% | 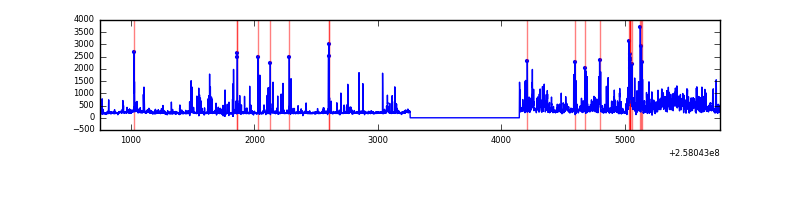 |
Top three noisy pixels from each quadrant. If the there are fewer than three noisy pixels in the level2.evt file, extra rows are filled as -1
| Pixel properties | Quadrant properties | ||||||
|---|---|---|---|---|---|---|---|
| Quadrant | DetID | PixID | Counts | Sigma | Mean | Median | Sigma |
| A | 0 | 29 | 229 | 10.39 | 59 | 56 | 16.7 |
| A | 0 | 28 | 189 | 7.99 | 59 | 56 | 16.7 |
| A | 14 | 79 | 177 | 7.27 | 59 | 56 | 16.7 |
| B | 2 | 9 | 172 | 8.53 | 57 | 54 | 13.8 |
| B | 3 | 17 | 160 | 7.67 | 57 | 54 | 13.8 |
| B | 14 | 254 | 153 | 7.16 | 57 | 54 | 13.8 |
| C | 12 | 242 | 174 | 6.87 | 60 | 56 | 17.2 |
| C | 3 | 126 | 166 | 6.41 | 60 | 56 | 17.2 |
| C | 3 | 158 | 162 | 6.17 | 60 | 56 | 17.2 |
| D | 3 | 14 | 157 | 6.51 | 55 | 50 | 16.4 |
| D | 15 | 46 | 147 | 5.9 | 55 | 50 | 16.4 |
| D | 6 | 231 | 147 | 5.9 | 55 | 50 | 16.4 |
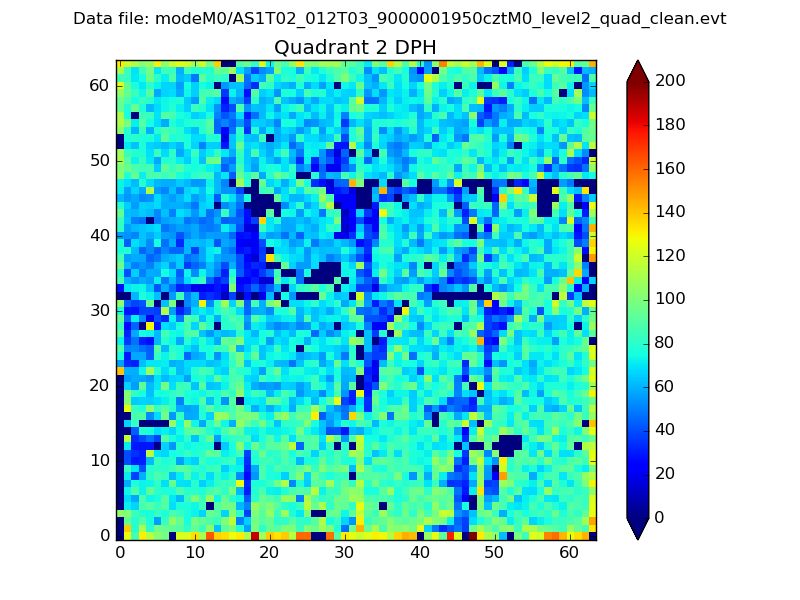
Histogram calculated using DETX and DETY for each event in the final _common_clean file
| Quadrant A | 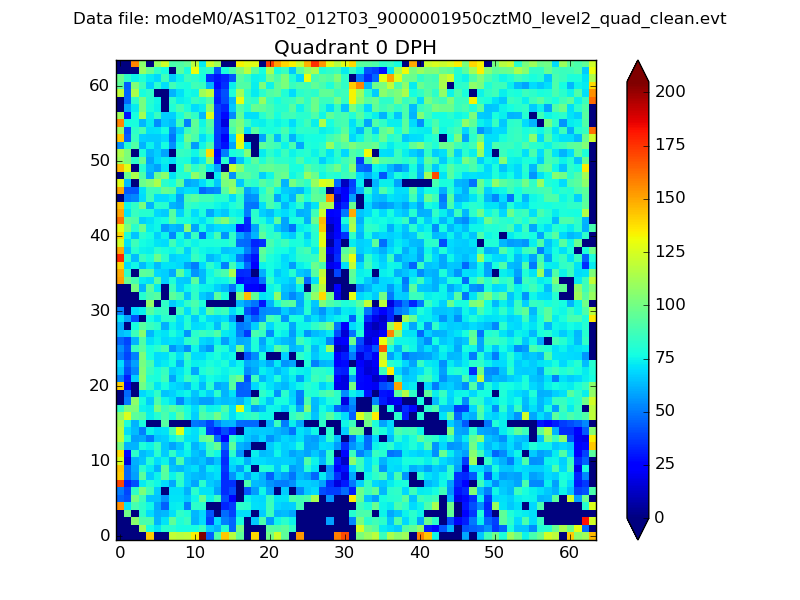 |
 |
Quadrant B |
|---|---|---|---|
| Quadrant D |  |
 |
Quadrant C |
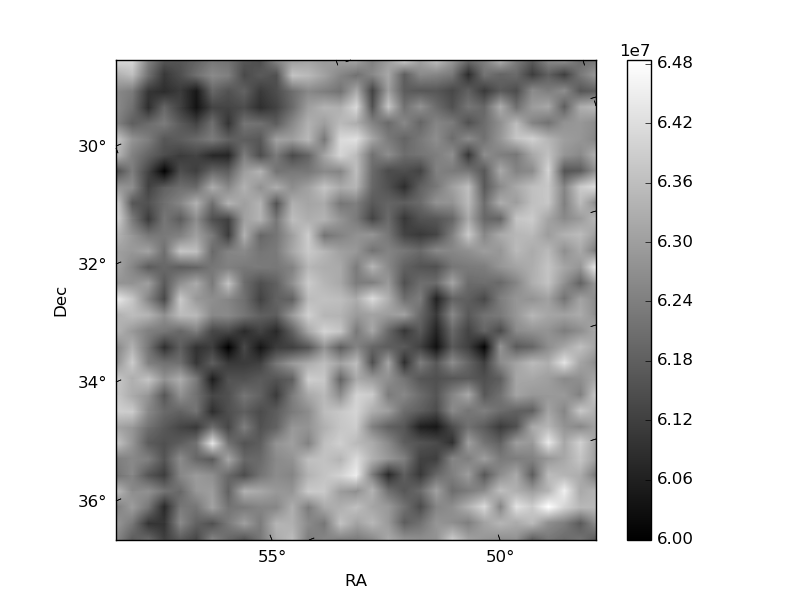
| Plot type | Count rate plots | Images |
|---|---|---|
| Comparison with Poisson distribution Blue bars denote a histogram of data divided into 1 sec bins. Red curve is a Poisson curve with rate = median count rate of data. |
 |
 |
| Quadrant-wise count rates Data is divided into 100 sec bins |
 |
|
| Module-wise count rates for Quadrant A Data is divided into 100 sec bins |
 |
 |
| Module-wise count rates for Quadrant B Data is divided into 100 sec bins |
 |
 |
| Module-wise count rates for Quadrant C Data is divided into 100 sec bins |
 |
 |
| Module-wise count rates for Quadrant D Data is divided into 100 sec bins |
 |
 |
| Parameter | Plot |
|---|---|
| CZT HV Monitor | 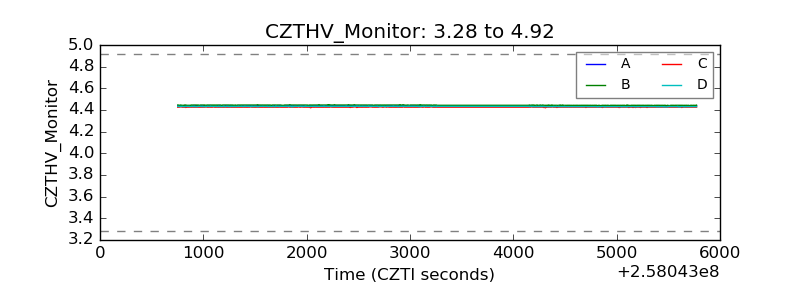 |
| D_VDD | 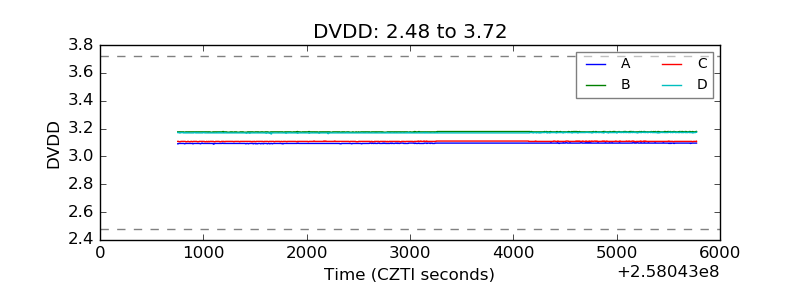 |
| Temperature 1 |  |
| Veto HV Monitor |  |
| Veto LLD |  |
| Alpha Counter | 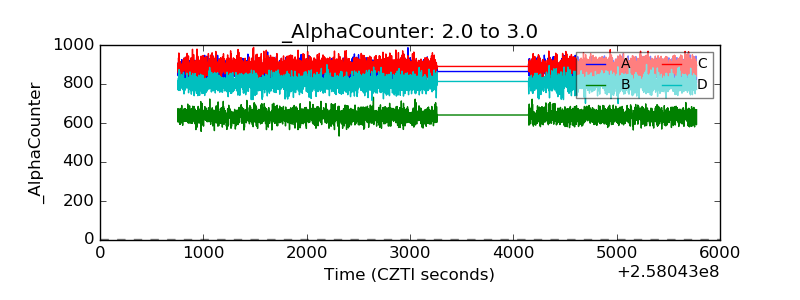 |
| _CPM_Rate |  |
| CZT Counter | 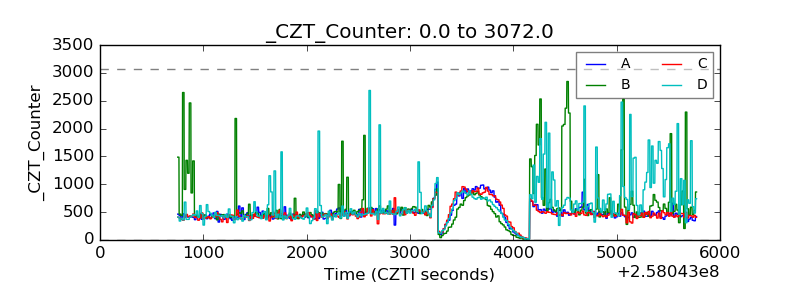 |
| +2.5 Volts monitor |  |
| +5 Volts monitor |  |
| _ROLL_ROT |  |
| _Roll_DEC | 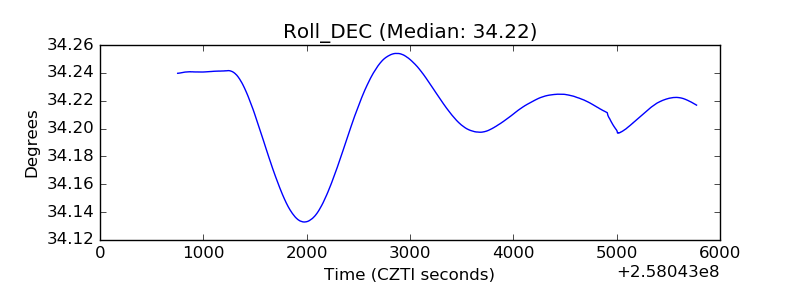 |
| _Roll_RA | 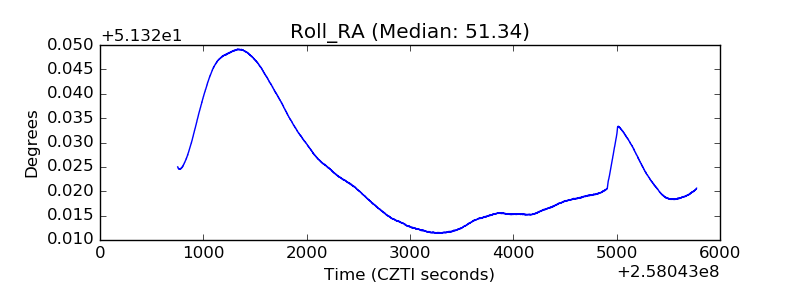 |
| Veto Counter |  |