| Param | Original file | Final file |
|---|---|---|
| Filename | modeM0/AS1T02_012T04_9000001952cztM0_level2.fits | modeM0/AS1T02_012T04_9000001952cztM0_level2_quad_clean.evt |
| Size (bytes) | 39,404,160 | 25,148,160 |
| Size | 37.6 MB | 24.0 MB |
| Events in quadrant A | 247,446 | 125,714 |
| Events in quadrant B | 184,640 | 97,743 |
| Events in quadrant C | 246,820 | 119,535 |
| Events in quadrant D | 201,382 | 105,163 |
| Mode M9 | |||
|---|---|---|---|
| Quadrant | BADHDUFLAG | Total packets | Discarded packets |
| A | 0 | 10 | 0 |
| B | 0 | 10 | 0 |
| C | 0 | 10 | 0 |
| D | 0 | 10 | 0 |
| Mode M0 | |||
|---|---|---|---|
| Quadrant | BADHDUFLAG | Total packets | Discarded packets |
| A | 0 | 9101 | 0 |
| B | 0 | 18925 | 0 |
| C | 0 | 8981 | 0 |
| D | 0 | 13637 | 0 |
| Mode SS | |||
|---|---|---|---|
| Quadrant | BADHDUFLAG | Total packets | Discarded packets |
| A | 0 | 92 | 0 |
| B | 0 | 92 | 0 |
| C | 0 | 92 | 0 |
| D | 0 | 92 | 0 |
| Quadrant | Total seconds | Saturated seconds | Saturation percentage |
|---|---|---|---|
| A | 4435 | 19 | 0.428410% |
| B | 4435 | 1550 | 34.949267% |
| C | 4435 | 9 | 0.202931% |
| D | 4435 | 445 | 10.033822% |
Noise dominated data is calculated using 1-second bins in cleaned event files. If a bin has >2000 counts, and if more than 50% of those come from <1% of pixels, then it is considered to be noise-dominated and hence unusable.
| Quadrant | # 1 sec bins | Bins with >0 counts | Bins with >2000 counts | High rate bins dominated by noise | Noise dominated (total time) | Noise dominated (detector-on time) | Marked lightcurve |
|---|---|---|---|---|---|---|---|
| A | 5505 | 4435 | 0 | 0 | 0.00% | 0.00% | 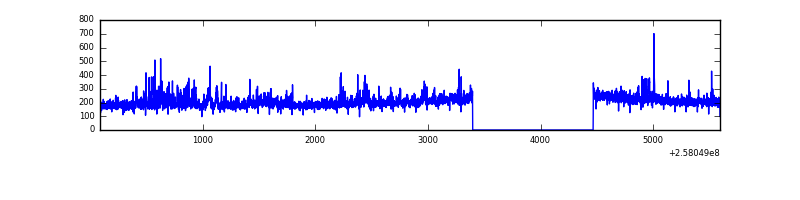 |
| B | 5505 | 4206 | 0 | 0 | 0.00% | 0.00% | 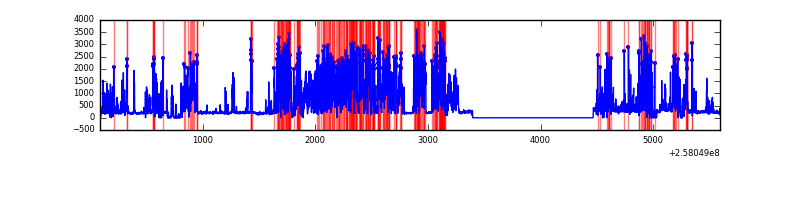 |
| C | 5505 | 4435 | 0 | 0 | 0.00% | 0.00% | 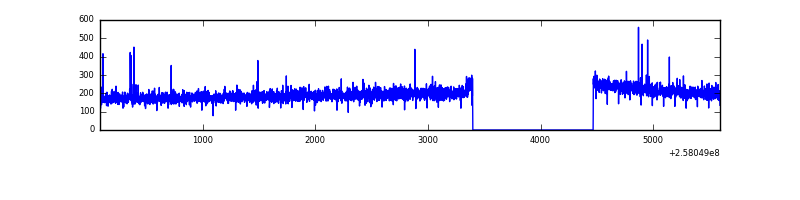 |
| D | 5505 | 4430 | 0 | 0 | 0.00% | 0.00% | 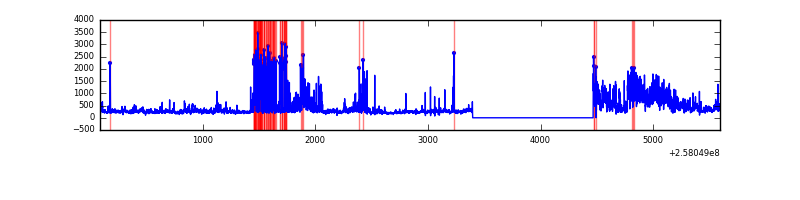 |
Top three noisy pixels from each quadrant. If the there are fewer than three noisy pixels in the level2.evt file, extra rows are filled as -1
| Pixel properties | Quadrant properties | ||||||
|---|---|---|---|---|---|---|---|
| Quadrant | DetID | PixID | Counts | Sigma | Mean | Median | Sigma |
| A | 0 | 29 | 235 | 9.7 | 64 | 61 | 17.9 |
| A | 7 | 110 | 210 | 8.31 | 64 | 61 | 17.9 |
| A | 9 | 239 | 186 | 6.97 | 64 | 61 | 17.9 |
| B | 2 | 9 | 169 | 10.09 | 48 | 46 | 12.2 |
| B | 2 | 8 | 131 | 6.97 | 48 | 46 | 12.2 |
| B | 5 | 232 | 124 | 6.4 | 48 | 46 | 12.2 |
| C | 1 | 80 | 203 | 7.7 | 64 | 60 | 18.6 |
| C | 15 | 65 | 199 | 7.49 | 64 | 60 | 18.6 |
| C | 1 | 81 | 193 | 7.16 | 64 | 60 | 18.6 |
| D | 4 | 246 | 169 | 6.79 | 57 | 52 | 17.2 |
| D | 4 | 160 | 161 | 6.33 | 57 | 52 | 17.2 |
| D | 6 | 231 | 153 | 5.86 | 57 | 52 | 17.2 |
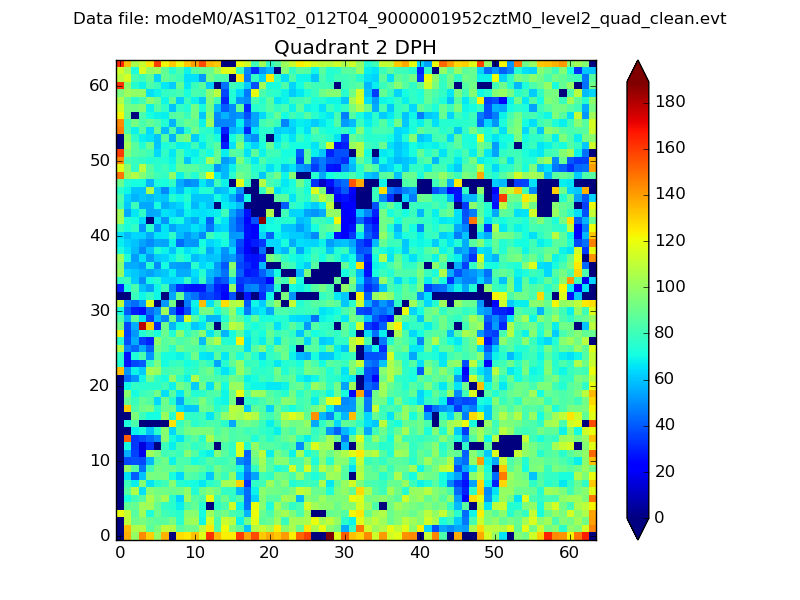
Histogram calculated using DETX and DETY for each event in the final _common_clean file
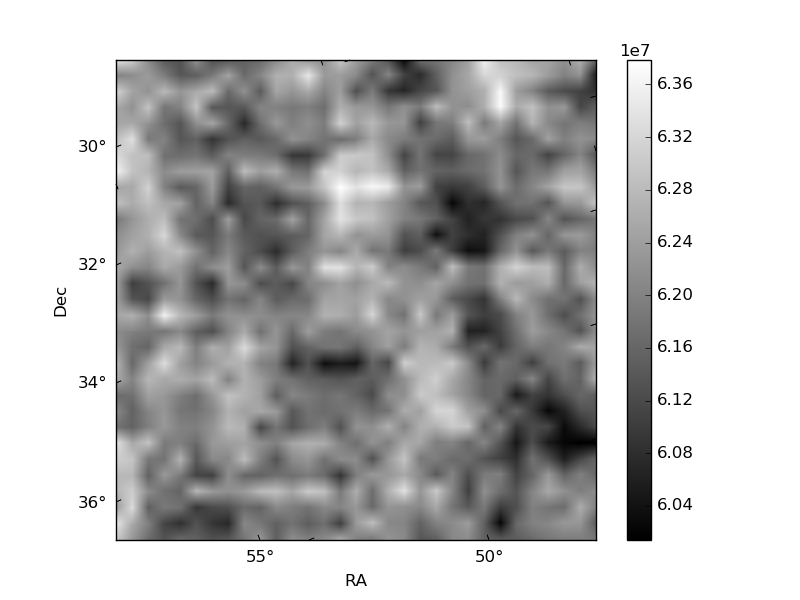
| Quadrant A | 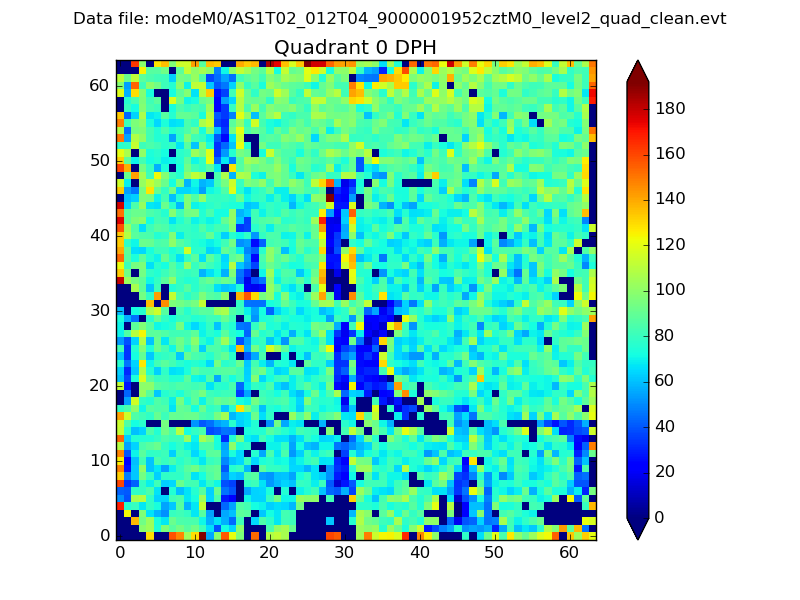 |
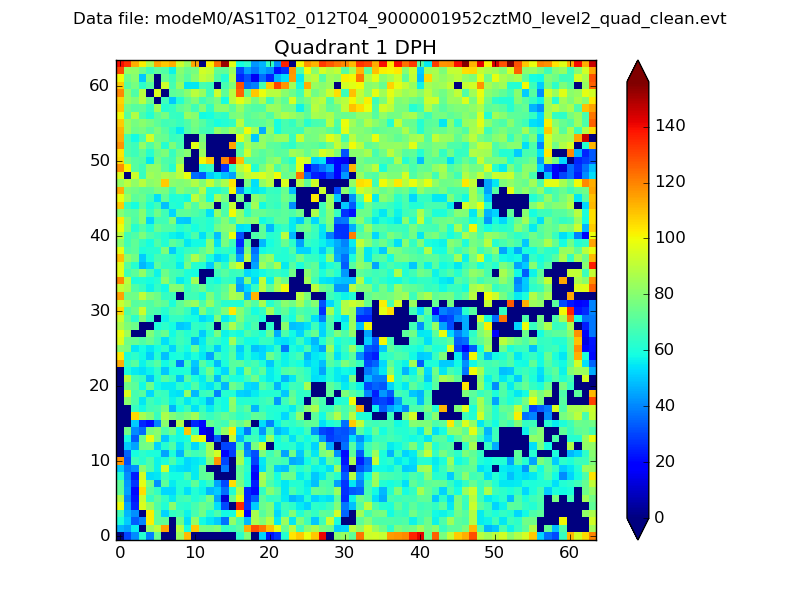 |
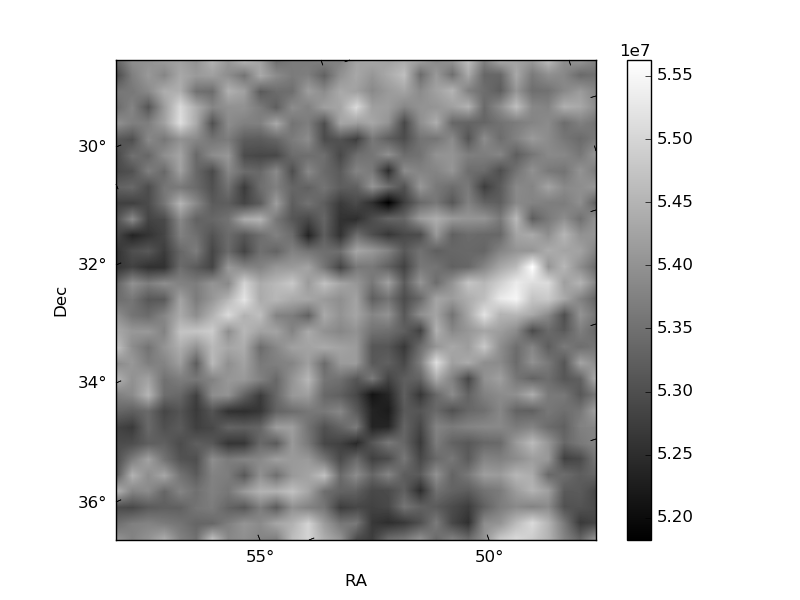
Quadrant B |
|---|---|---|---|
| Quadrant D | 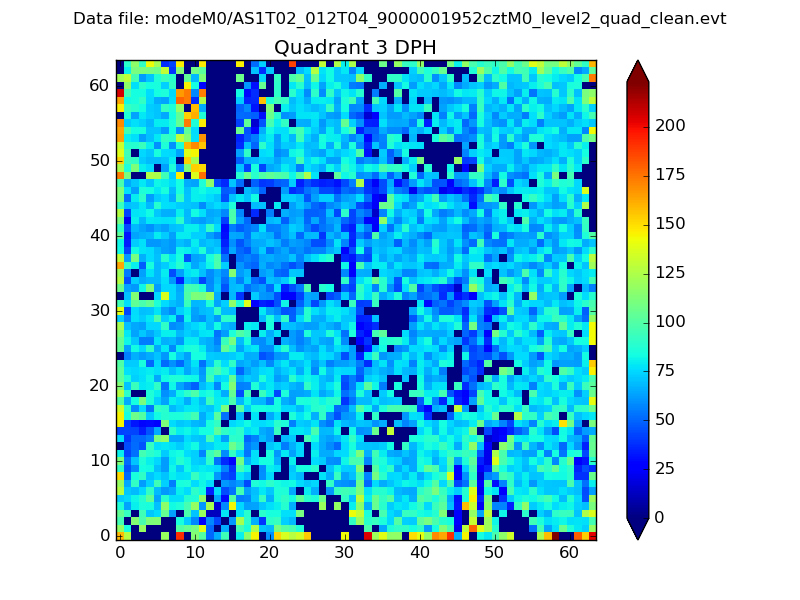 |
 |
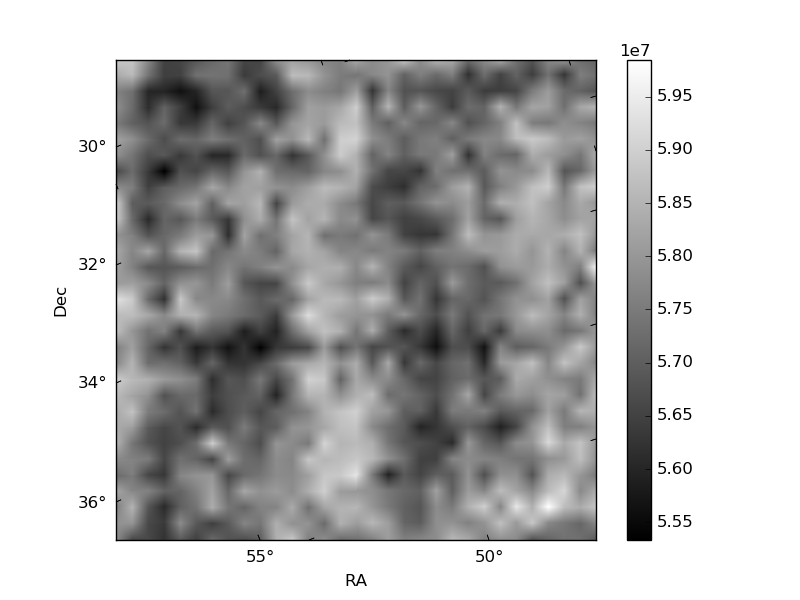
Quadrant C |
| Plot type | Count rate plots | Images |
|---|---|---|
| Comparison with Poisson distribution Blue bars denote a histogram of data divided into 1 sec bins. Red curve is a Poisson curve with rate = median count rate of data. |
 |
 |
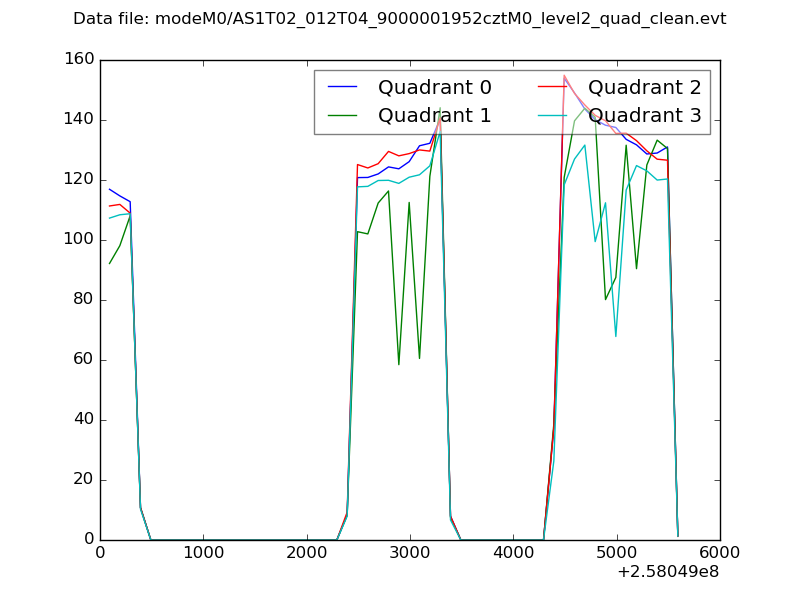
| Quadrant-wise count rates Data is divided into 100 sec bins |
 |
|
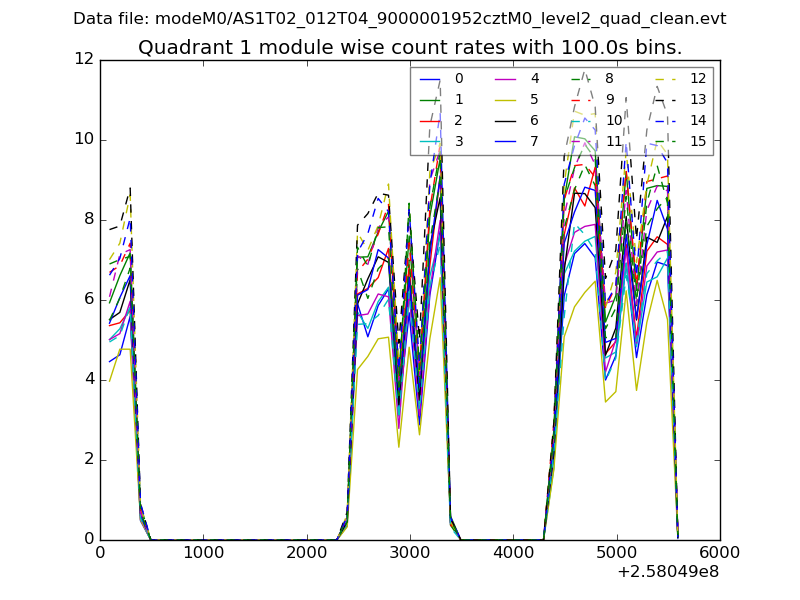
| Module-wise count rates for Quadrant A Data is divided into 100 sec bins |
 |
 |
| Module-wise count rates for Quadrant B Data is divided into 100 sec bins |
 |
 |
| Module-wise count rates for Quadrant C Data is divided into 100 sec bins |
 |
 |
| Module-wise count rates for Quadrant D Data is divided into 100 sec bins |
 |
 |
| Parameter | Plot |
|---|---|
| CZT HV Monitor | 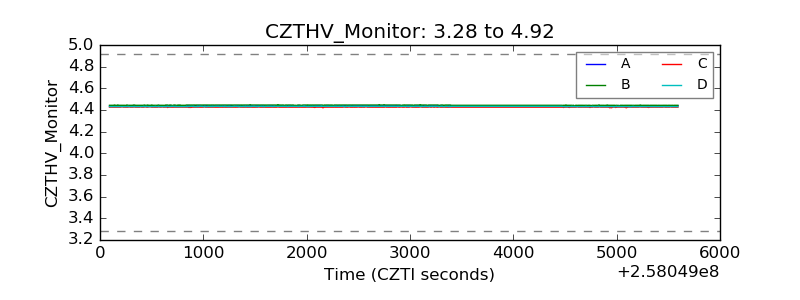 |
| D_VDD | 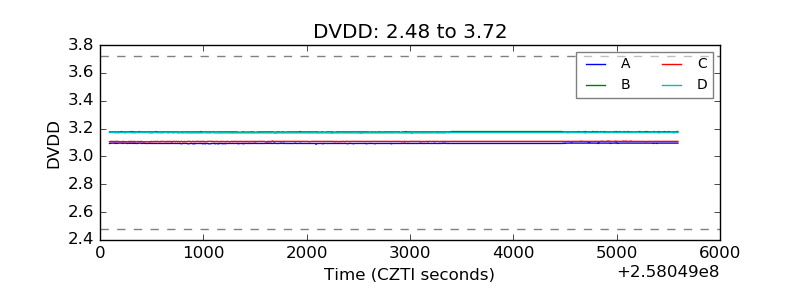 |
| Temperature 1 | 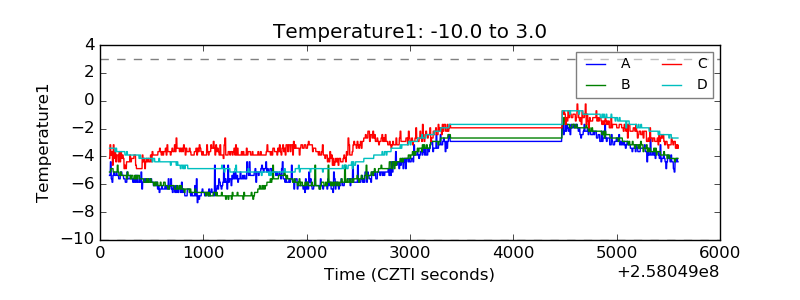 |
| Veto HV Monitor | 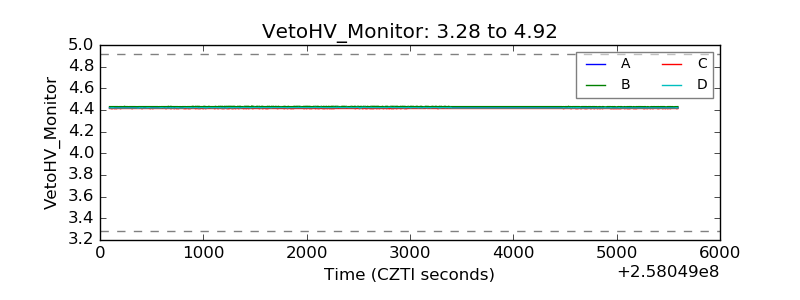 |
| Veto LLD | 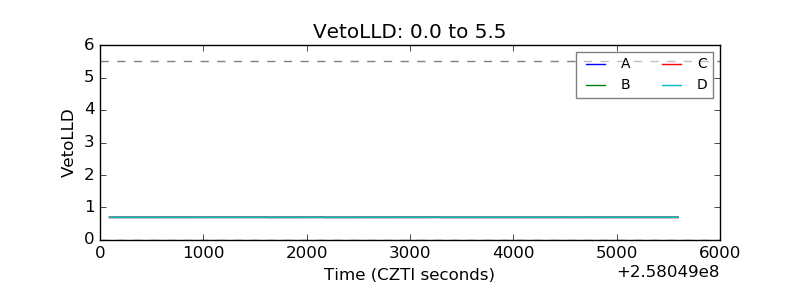 |
| Alpha Counter | 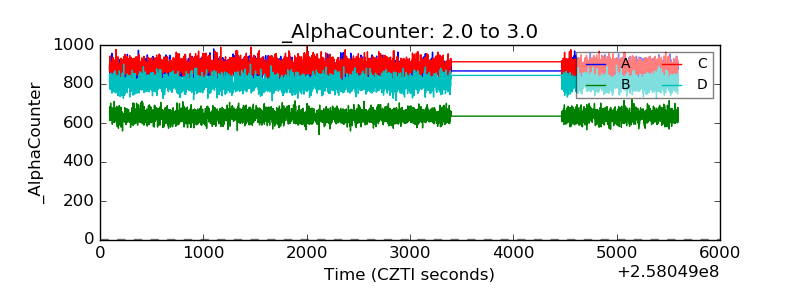 |
| _CPM_Rate | 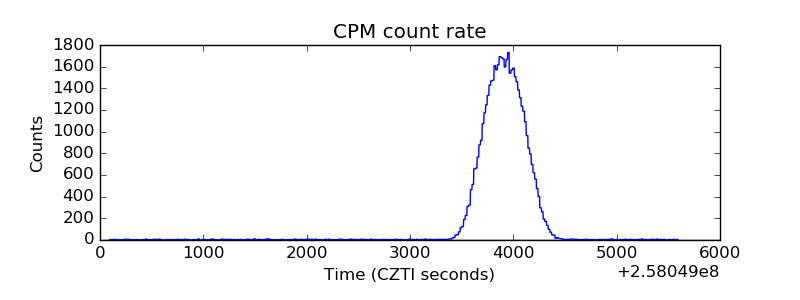 |
| CZT Counter | 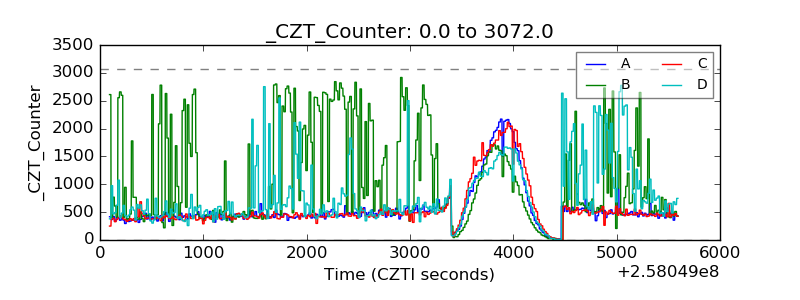 |
| +2.5 Volts monitor |  |
| +5 Volts monitor |  |
| _ROLL_ROT | 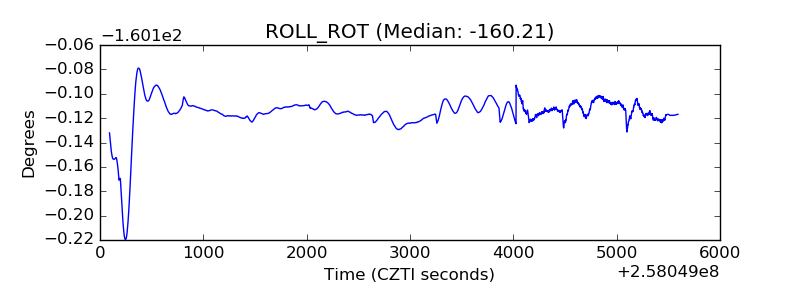 |
| _Roll_DEC | 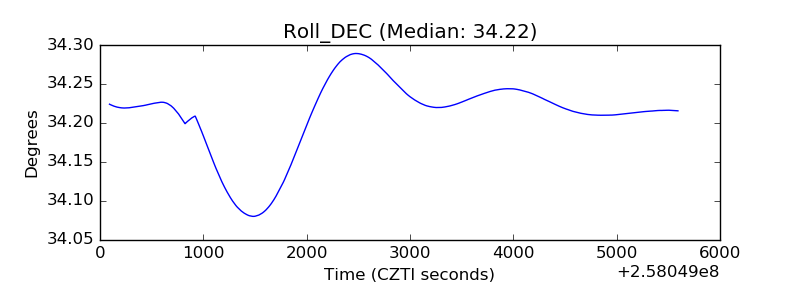 |
| _Roll_RA | 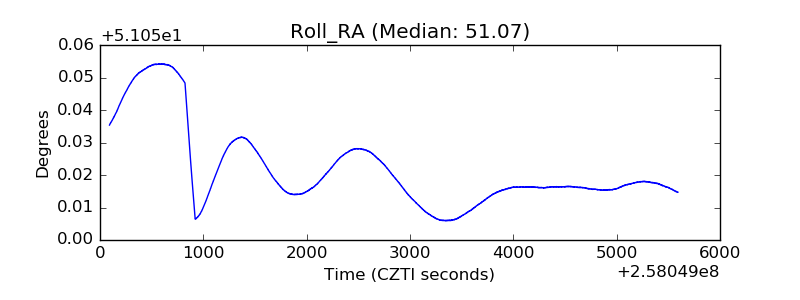 |
| Veto Counter | 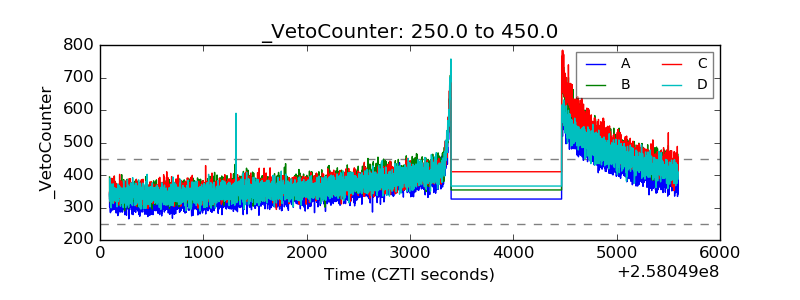 |