| Param | Original file | Final file |
|---|---|---|
| Filename | modeM0/AS1T02_012T04_9000001952_13181cztM0_level2.evt | modeM0/AS1T02_012T04_9000001952_13181cztM0_level2_quad_clean.evt |
| Size (bytes) | 439,871,040 | 48,326,400 |
| Size | 419.5 MB | 46.1 MB |
| Events in quadrant A | 2,070,992 | 306,831 |
| Events in quadrant B | 5,361,040 | 262,047 |
| Events in quadrant C | 1,991,113 | 307,751 |
| Events in quadrant D | 3,596,122 | 273,630 |
| Mode M9 | |||
|---|---|---|---|
| Quadrant | BADHDUFLAG | Total packets | Discarded packets |
| A | 0 | 10 | 0 |
| B | 0 | 10 | 0 |
| C | 0 | 10 | 0 |
| D | 0 | 10 | 0 |
| Mode M0 | |||
|---|---|---|---|
| Quadrant | BADHDUFLAG | Total packets | Discarded packets |
| A | 0 | 9102 | 1 |
| B | 0 | 18926 | 1 |
| C | 0 | 8982 | 1 |
| D | 0 | 13638 | 1 |
| Mode SS | |||
|---|---|---|---|
| Quadrant | BADHDUFLAG | Total packets | Discarded packets |
| A | 0 | 92 | 0 |
| B | 0 | 92 | 0 |
| C | 0 | 92 | 0 |
| D | 0 | 92 | 0 |
| Quadrant | Total seconds | Saturated seconds | Saturation percentage |
|---|---|---|---|
| A | 4435 | 19 | 0.428410% |
| B | 4435 | 1550 | 34.949267% |
| C | 4435 | 9 | 0.202931% |
| D | 4435 | 445 | 10.033822% |
Noise dominated data is calculated using 1-second bins in cleaned event files. If a bin has >2000 counts, and if more than 50% of those come from <1% of pixels, then it is considered to be noise-dominated and hence unusable.
| Quadrant | # 1 sec bins | Bins with >0 counts | Bins with >2000 counts | High rate bins dominated by noise | Noise dominated (total time) | Noise dominated (detector-on time) | Marked lightcurve |
|---|---|---|---|---|---|---|---|
| A | 5506 | 4437 | 0 | 0 | 0.00% | 0.00% | 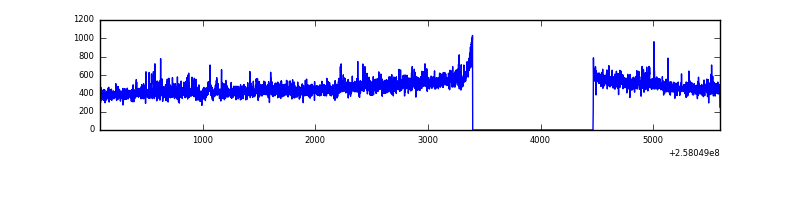 |
| B | 5506 | 4437 | 1000 | 1000 | 18.16% | 22.54% | 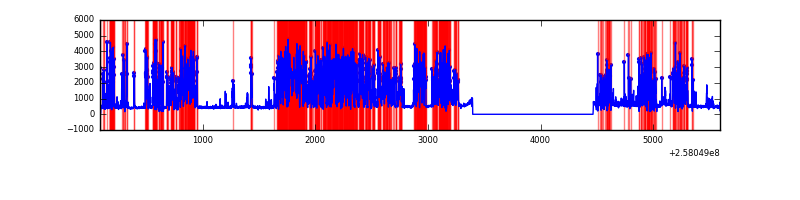 |
| C | 5506 | 4437 | 0 | 0 | 0.00% | 0.00% |  |
| D | 5506 | 4437 | 315 | 315 | 5.72% | 7.10% | 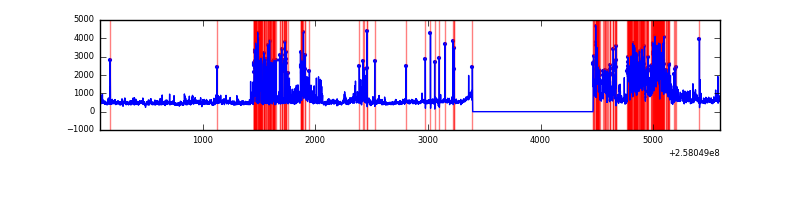 |
Top three noisy pixels from each quadrant. If the there are fewer than three noisy pixels in the level2.evt file, extra rows are filled as -1
| Pixel properties | Quadrant properties | ||||||
|---|---|---|---|---|---|---|---|
| Quadrant | DetID | PixID | Counts | Sigma | Mean | Median | Sigma |
| A | 12 | 189 | 56654 | 531.26 | 517 | 505 | 105.7 |
| A | 4 | 2 | 8753 | 78.04 | 517 | 505 | 105.7 |
| A | 1 | 162 | 6432 | 56.08 | 517 | 505 | 105.7 |
| B | 4 | 239 | 3654405 | 45401.43 | 415 | 404 | 80.5 |
| B | 0 | 189 | 21362 | 260.41 | 415 | 404 | 80.5 |
| B | 4 | 216 | 13866 | 167.27 | 415 | 404 | 80.5 |
| C | 15 | 208 | 7555 | 59.27 | 508 | 510 | 118.9 |
| C | 13 | 61 | 3669 | 26.58 | 508 | 510 | 118.9 |
| C | 8 | 222 | 1454 | 7.94 | 508 | 510 | 118.9 |
| D | 13 | 122 | 946991 | 8043.98 | 484 | 469 | 117.7 |
| D | 1 | 52 | 575446 | 4886.42 | 484 | 469 | 117.7 |
| D | 14 | 34 | 155038 | 1313.6 | 484 | 469 | 117.7 |
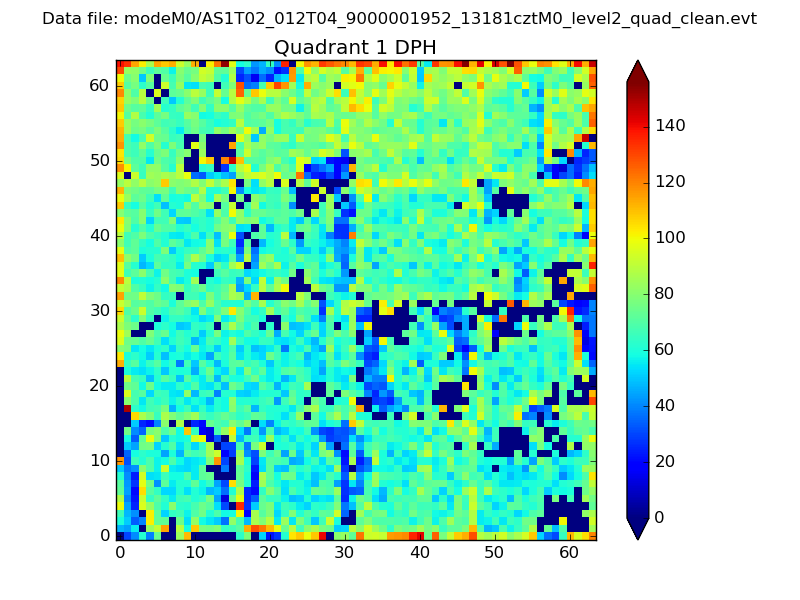
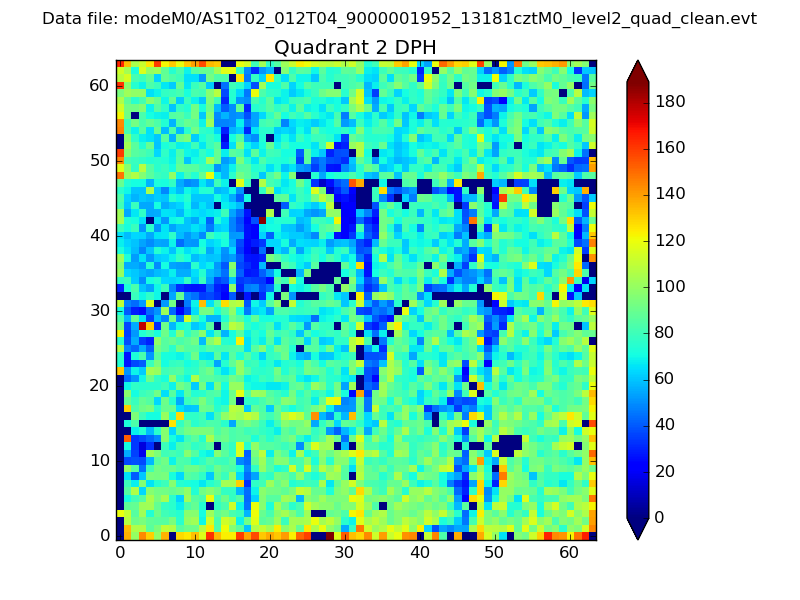
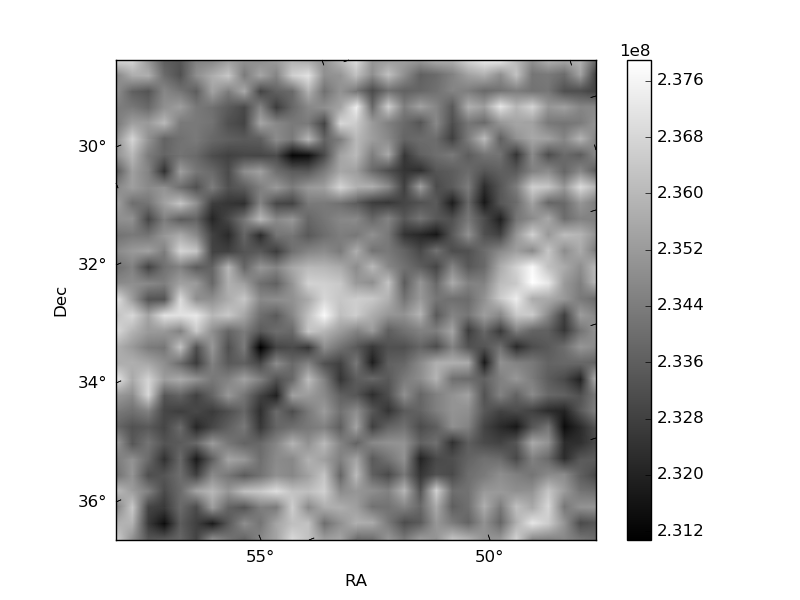
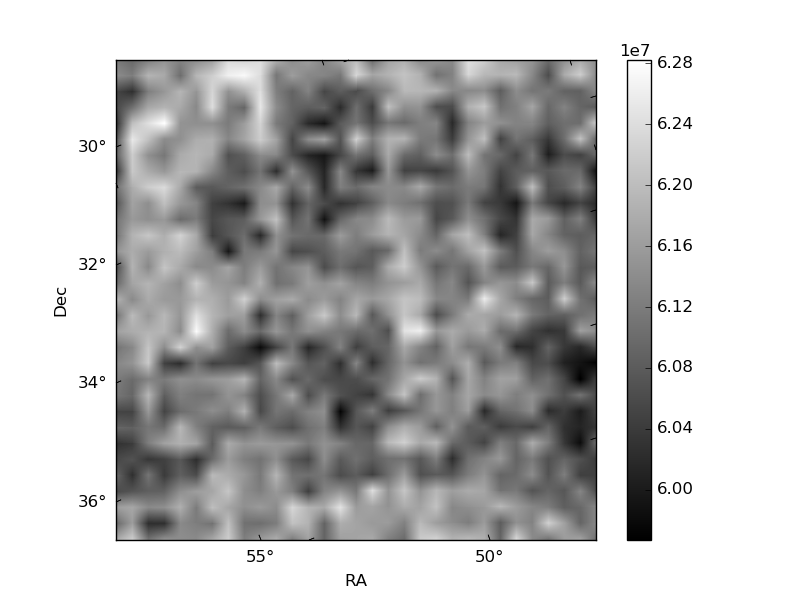
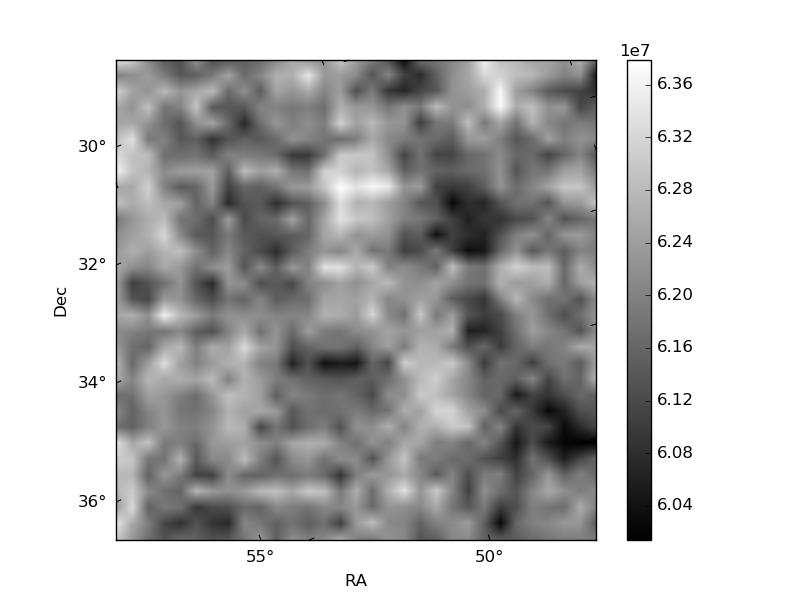
Histogram calculated using DETX and DETY for each event in the final _common_clean file
| Quadrant A | 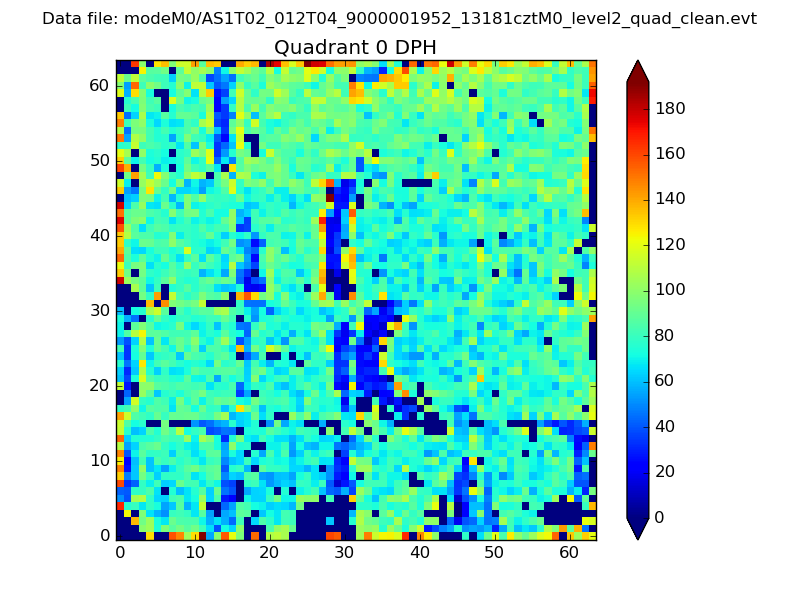 |
 |
Quadrant B |
|---|---|---|---|
| Quadrant D | 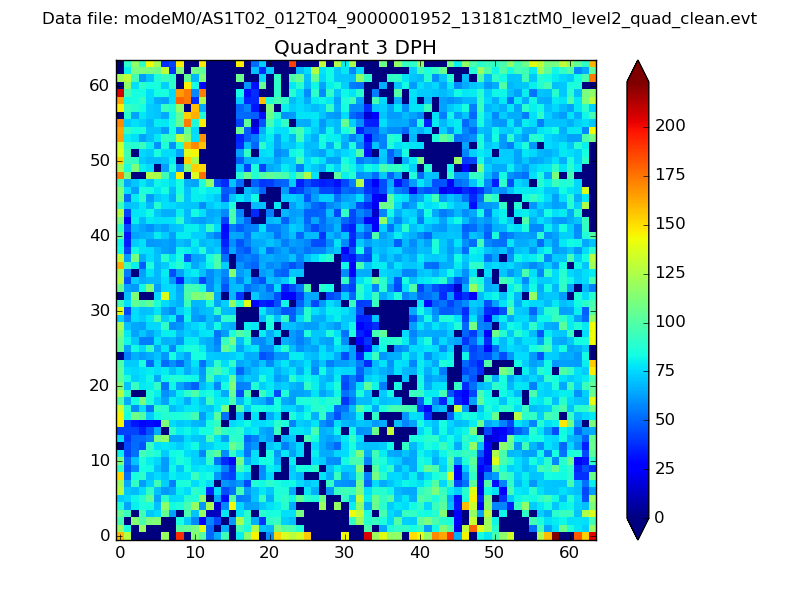 |
 |
Quadrant C |
| Plot type | Count rate plots | Images |
|---|---|---|
| Comparison with Poisson distribution Blue bars denote a histogram of data divided into 1 sec bins. Red curve is a Poisson curve with rate = median count rate of data. |
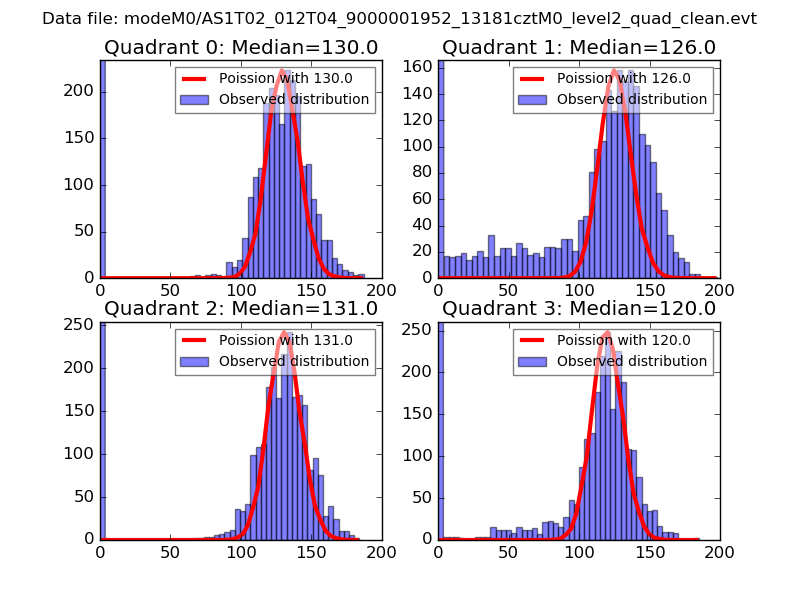 |
 |
| Quadrant-wise count rates Data is divided into 100 sec bins |
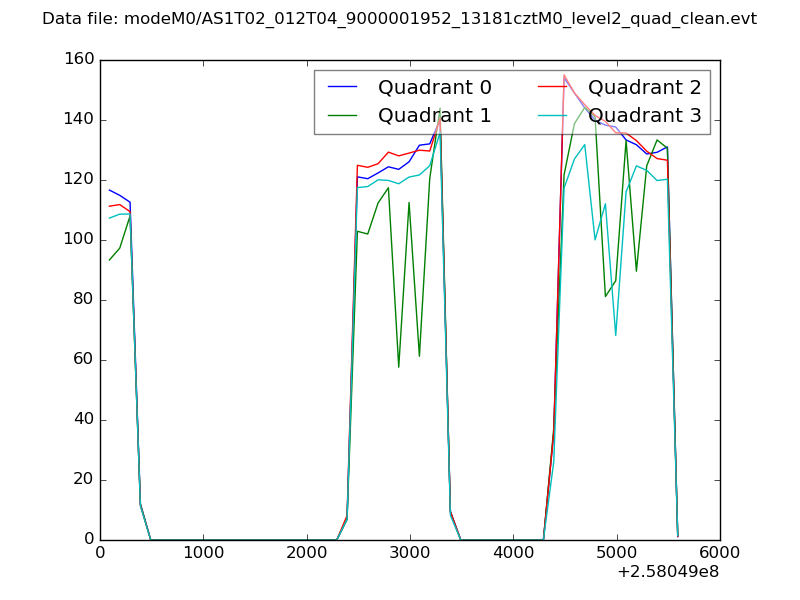 |
|
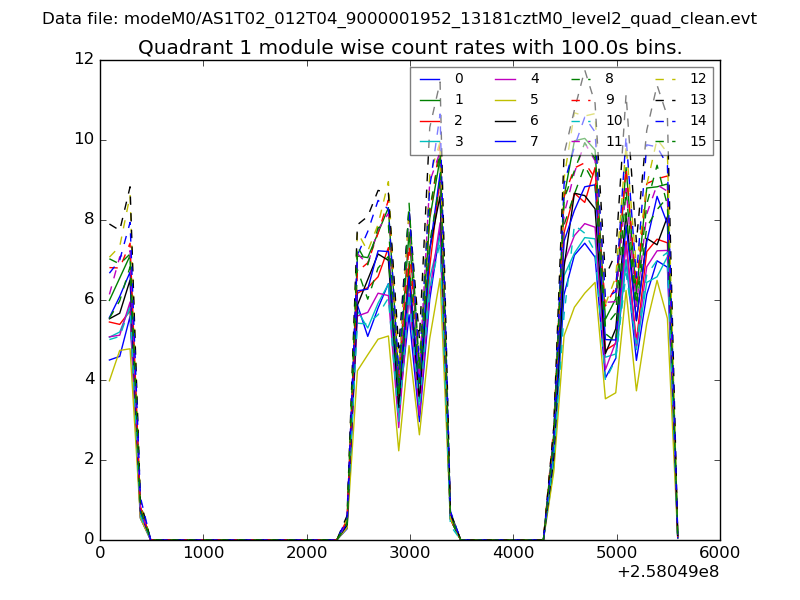
| Module-wise count rates for Quadrant A Data is divided into 100 sec bins |
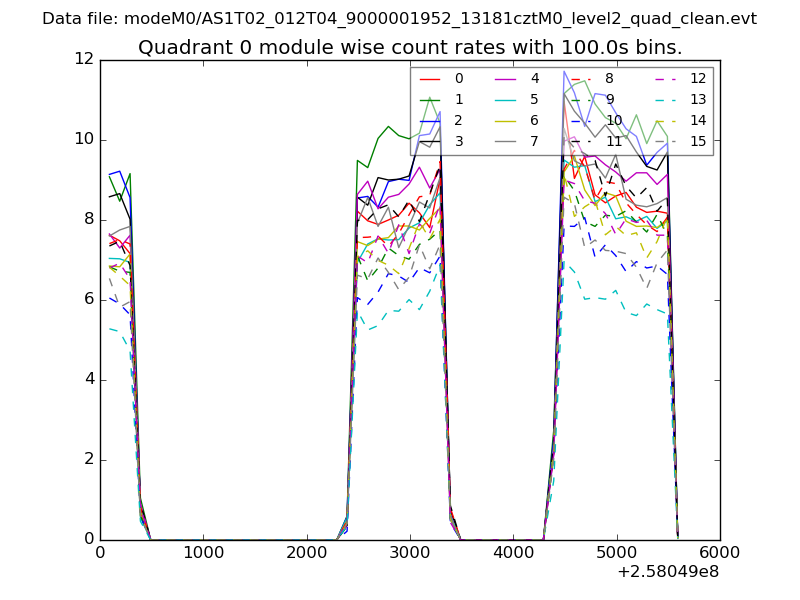 |
 |
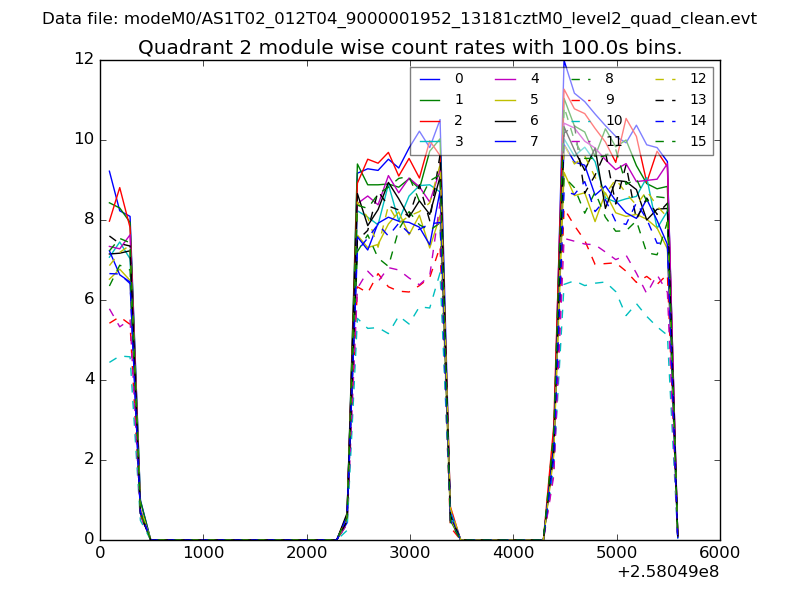
| Module-wise count rates for Quadrant B Data is divided into 100 sec bins |
 |
 |
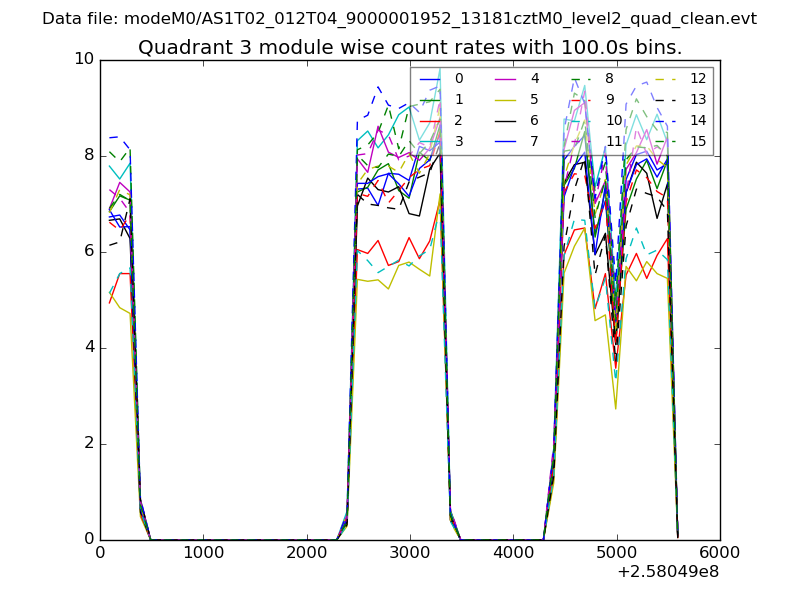
| Module-wise count rates for Quadrant C Data is divided into 100 sec bins |
 |
 |
| Module-wise count rates for Quadrant D Data is divided into 100 sec bins |
 |
 |
| Parameter | Plot |
|---|---|
| CZT HV Monitor | 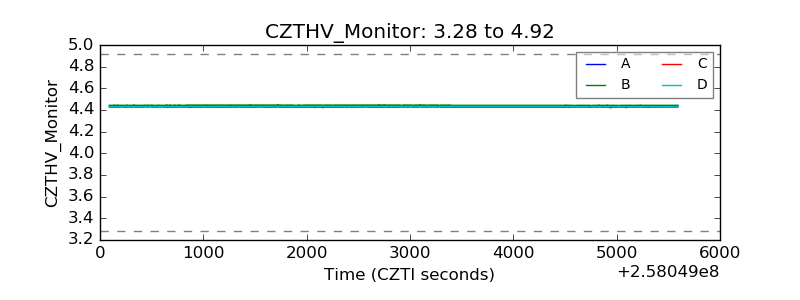 |
| D_VDD | 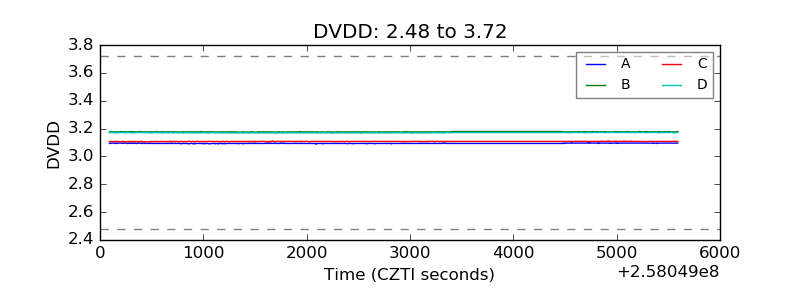 |
| Temperature 1 | 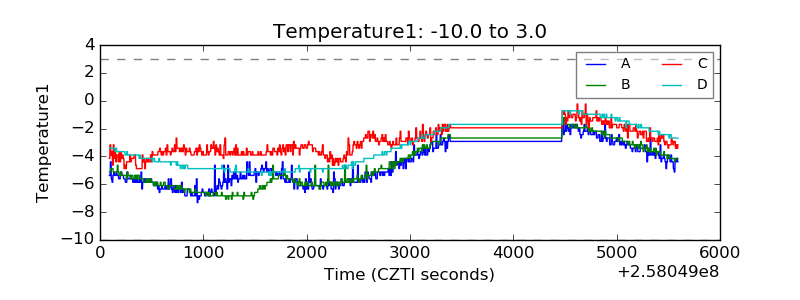 |
| Veto HV Monitor | 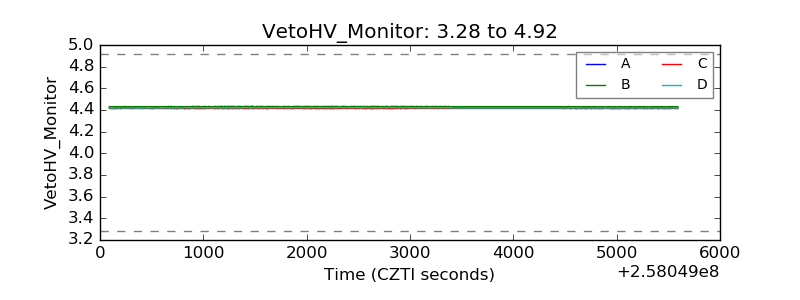 |
| Veto LLD | 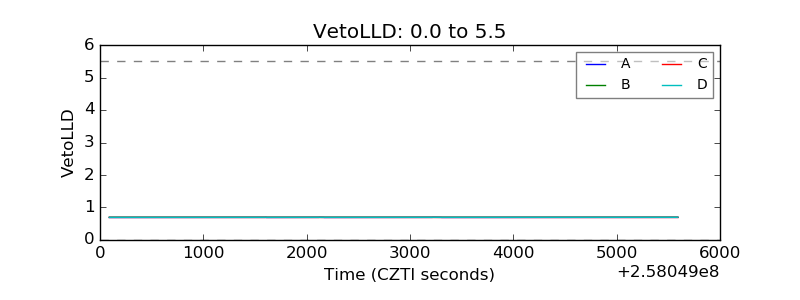 |
| Alpha Counter | 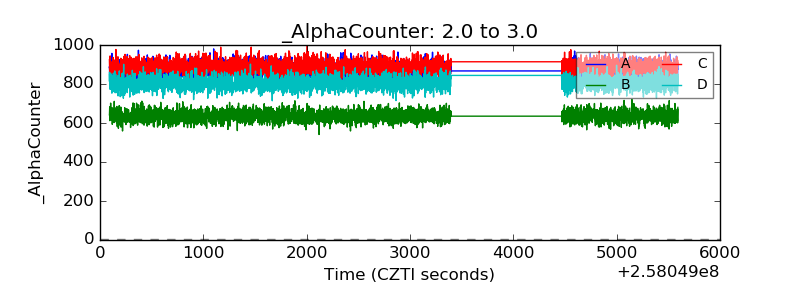 |
| _CPM_Rate | 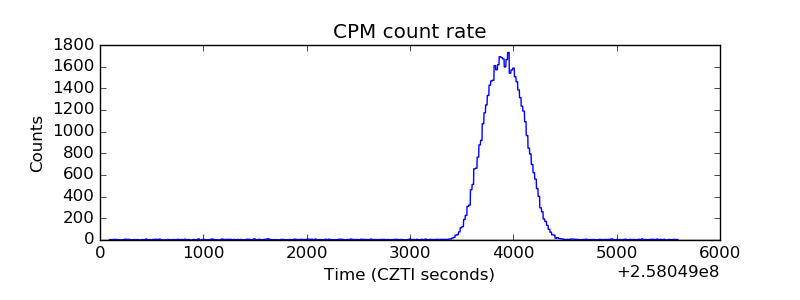 |
| CZT Counter | 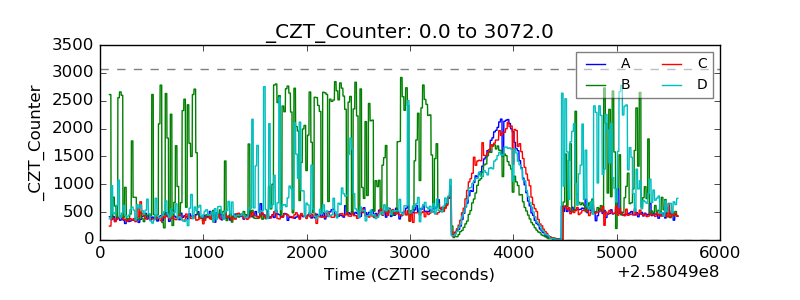 |
| +2.5 Volts monitor |  |
| +5 Volts monitor | 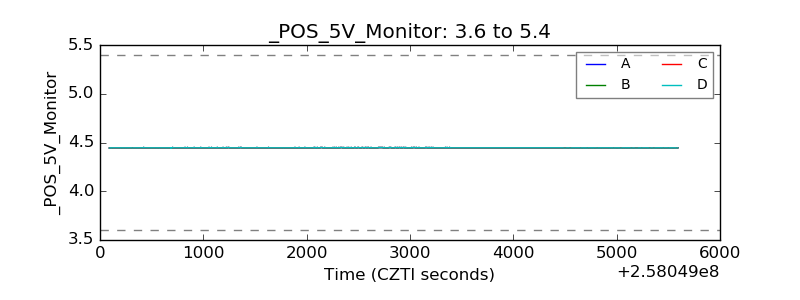 |
| _ROLL_ROT | 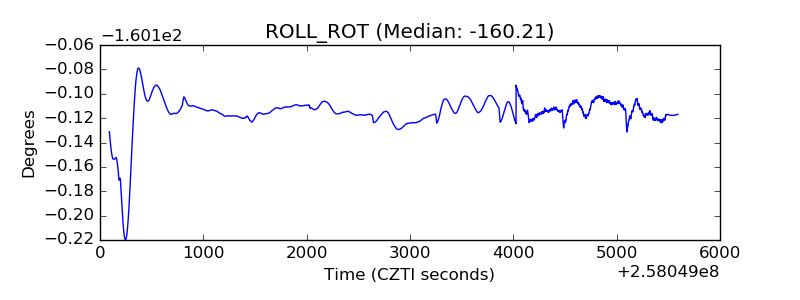 |
| _Roll_DEC | 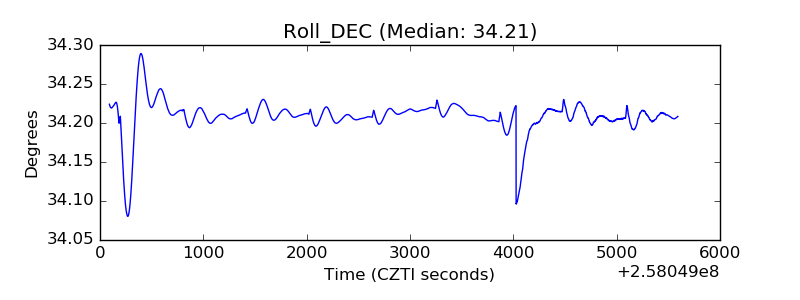 |
| _Roll_RA | 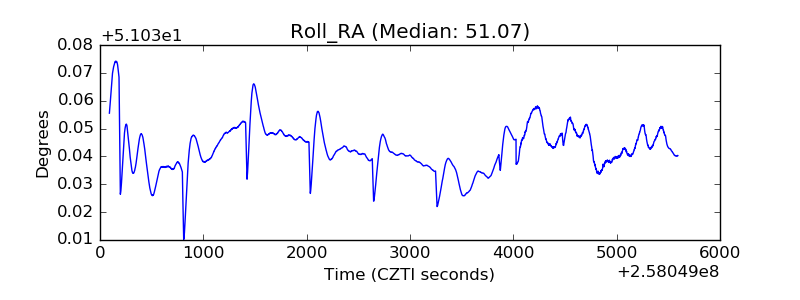 |
| Veto Counter | 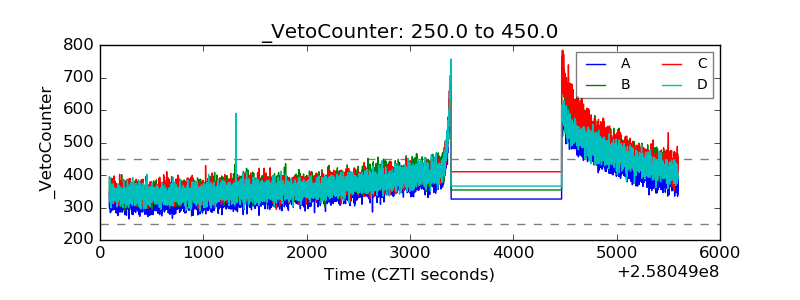 |