| Param | Original file | Final file |
|---|---|---|
| Filename | modeM0/AS1T02_012T04_9000001952_13183cztM0_level2.evt | modeM0/AS1T02_012T04_9000001952_13183cztM0_level2_quad_clean.evt |
| Size (bytes) | 120,502,080 | 21,841,920 |
| Size | 114.9 MB | 20.8 MB |
| Events in quadrant A | 560,637 | 155,336 |
| Events in quadrant B | 1,040,184 | 136,048 |
| Events in quadrant C | 551,897 | 155,290 |
| Events in quadrant D | 1,417,628 | 128,653 |
| Mode M0 | |||
|---|---|---|---|
| Quadrant | BADHDUFLAG | Total packets | Discarded packets |
| A | 0 | 2334 | 1 |
| B | 0 | 3845 | 1 |
| C | 0 | 2293 | 1 |
| D | 0 | 4998 | 1 |
| Mode SS | |||
|---|---|---|---|
| Quadrant | BADHDUFLAG | Total packets | Discarded packets |
| A | 0 | 22 | 0 |
| B | 0 | 22 | 0 |
| C | 0 | 22 | 0 |
| D | 0 | 22 | 0 |
| Quadrant | Total seconds | Saturated seconds | Saturation percentage |
|---|---|---|---|
| A | 1125 | 2 | 0.177778% |
| B | 1125 | 219 | 19.466667% |
| C | 1125 | 0 | 0.000000% |
| D | 1126 | 293 | 26.021314% |
Noise dominated data is calculated using 1-second bins in cleaned event files. If a bin has >2000 counts, and if more than 50% of those come from <1% of pixels, then it is considered to be noise-dominated and hence unusable.
| Quadrant | # 1 sec bins | Bins with >0 counts | Bins with >2000 counts | High rate bins dominated by noise | Noise dominated (total time) | Noise dominated (detector-on time) | Marked lightcurve |
|---|---|---|---|---|---|---|---|
| A | 1126 | 1126 | 0 | 0 | 0.00% | 0.00% | 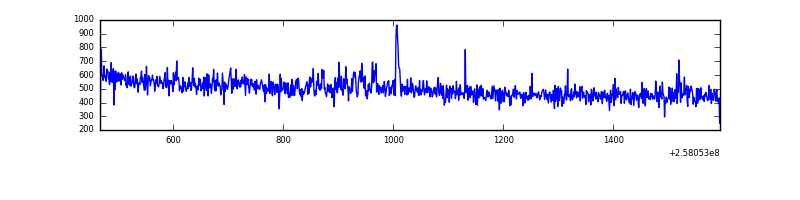 |
| B | 1126 | 1126 | 106 | 106 | 9.41% | 9.41% | 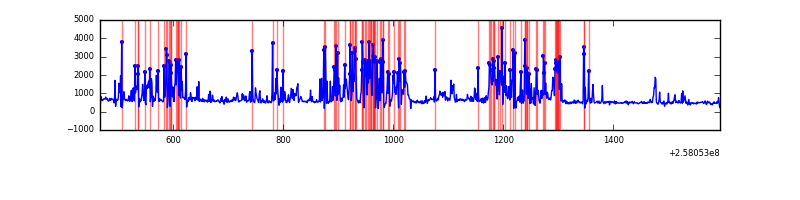 |
| C | 1126 | 1126 | 0 | 0 | 0.00% | 0.00% | 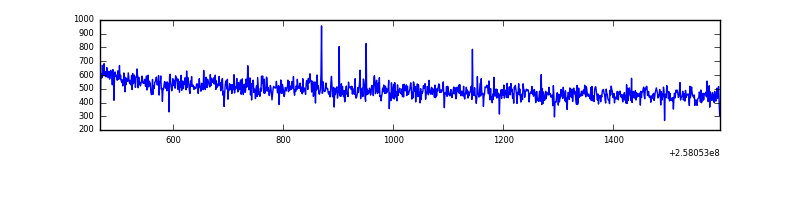 |
| D | 1127 | 1127 | 198 | 198 | 17.57% | 17.57% | 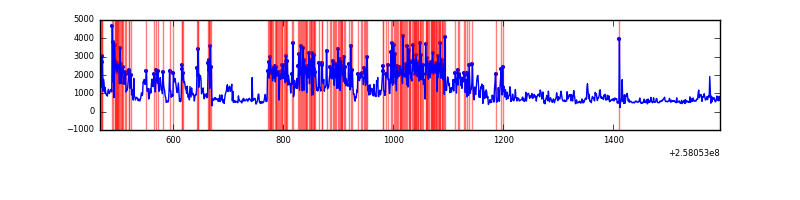 |
Top three noisy pixels from each quadrant. If the there are fewer than three noisy pixels in the level2.evt file, extra rows are filled as -1
| Pixel properties | Quadrant properties | ||||||
|---|---|---|---|---|---|---|---|
| Quadrant | DetID | PixID | Counts | Sigma | Mean | Median | Sigma |
| A | 4 | 2 | 6253 | 199.19 | 142 | 139 | 30.7 |
| A | 1 | 162 | 1811 | 54.47 | 142 | 139 | 30.7 |
| A | 0 | 226 | 1358 | 39.71 | 142 | 139 | 30.7 |
| B | 4 | 239 | 503166 | 19576.78 | 125 | 122 | 25.7 |
| B | 0 | 189 | 15691 | 605.89 | 125 | 122 | 25.7 |
| B | 4 | 216 | 13218 | 509.65 | 125 | 122 | 25.7 |
| C | 15 | 208 | 2128 | 58.05 | 140 | 141 | 34.2 |
| C | 13 | 61 | 1048 | 26.5 | 140 | 141 | 34.2 |
| C | 0 | 207 | 442 | 8.79 | 140 | 141 | 34.2 |
| D | 13 | 122 | 729901 | 22761.91 | 126 | 122 | 32.1 |
| D | 14 | 34 | 118547 | 3693.69 | 126 | 122 | 32.1 |
| D | 1 | 52 | 43439 | 1351.06 | 126 | 122 | 32.1 |
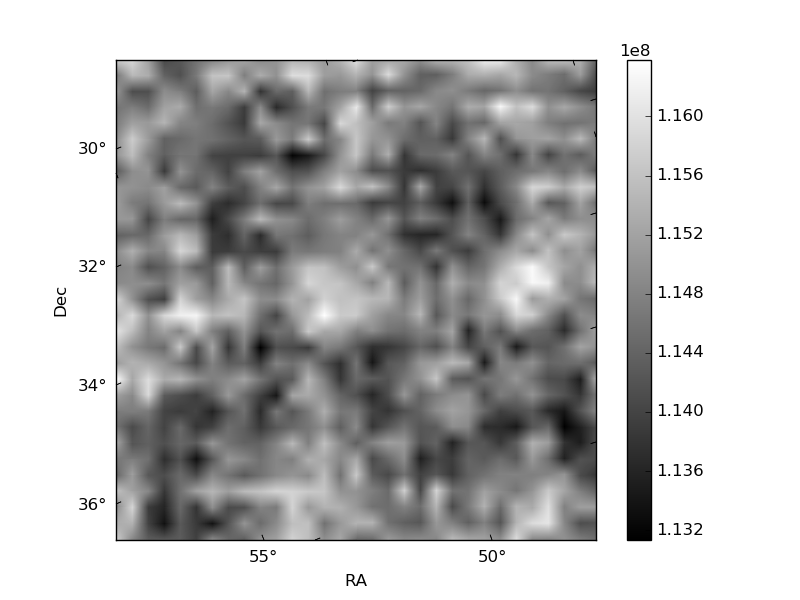
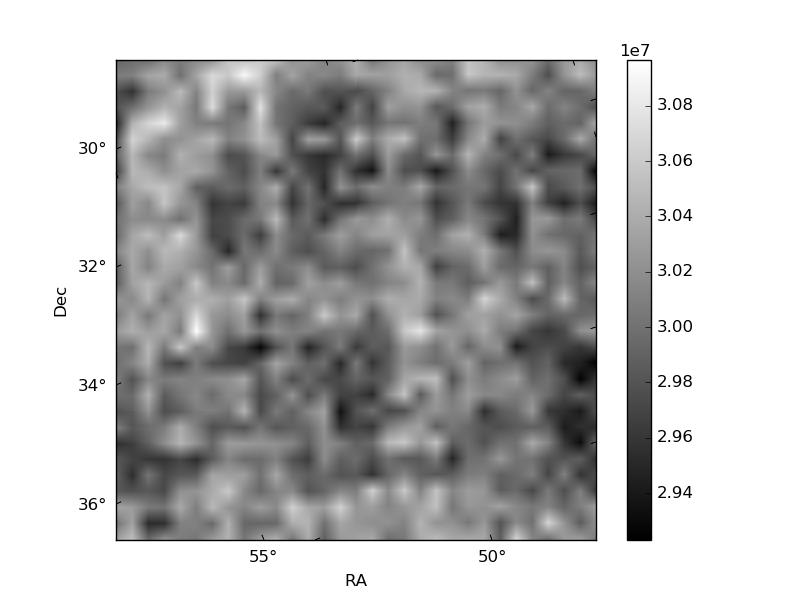
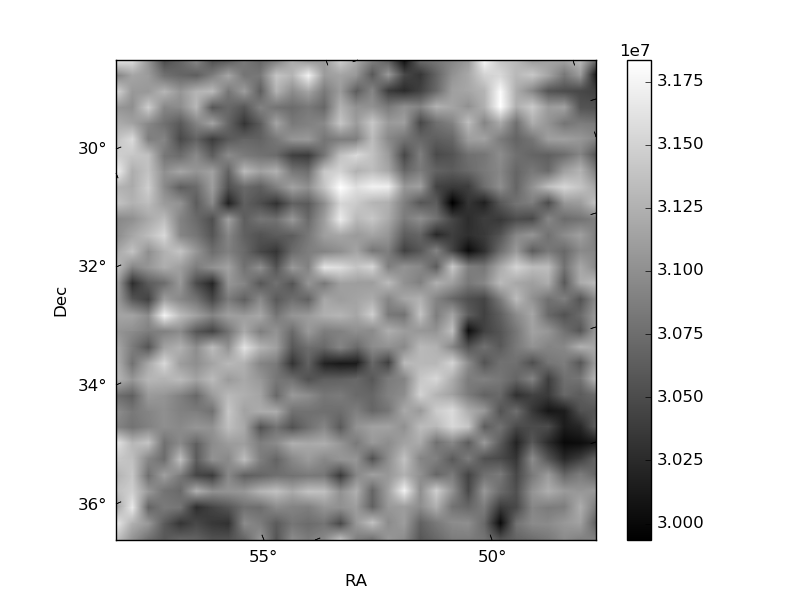
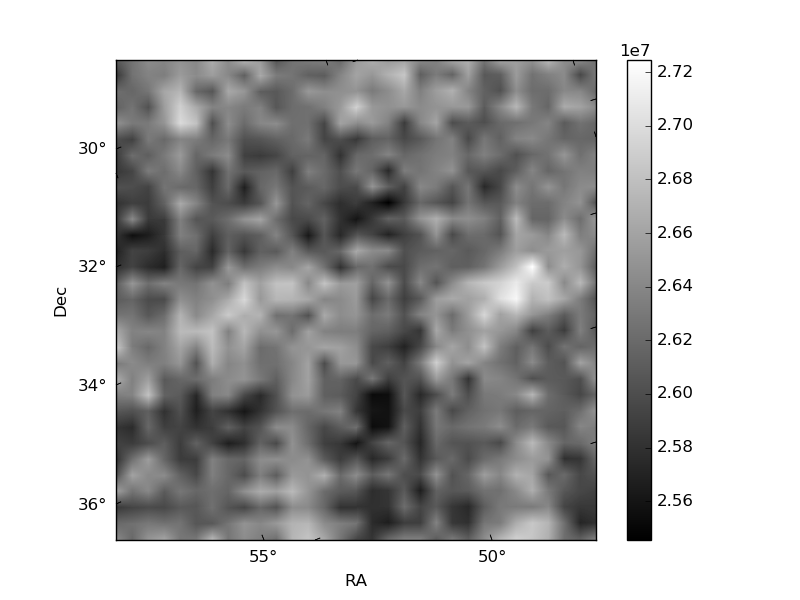
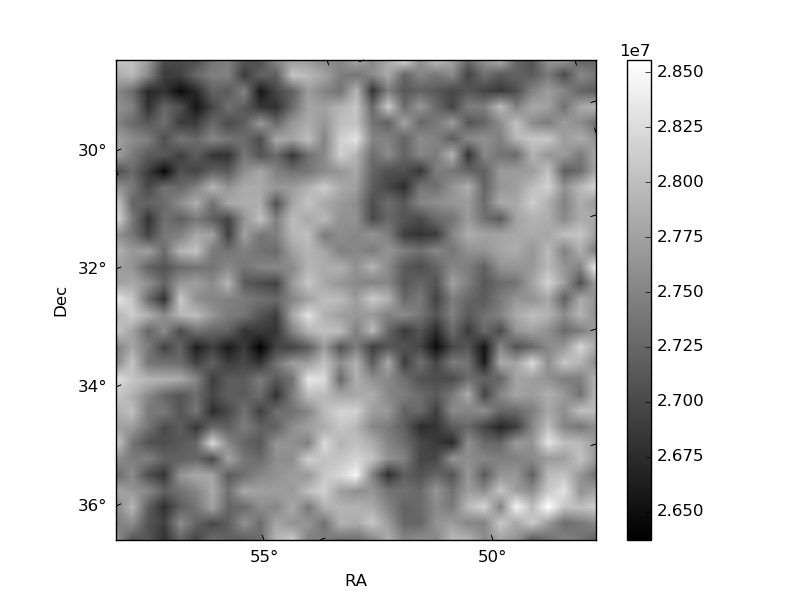
Histogram calculated using DETX and DETY for each event in the final _common_clean file
| Quadrant A | 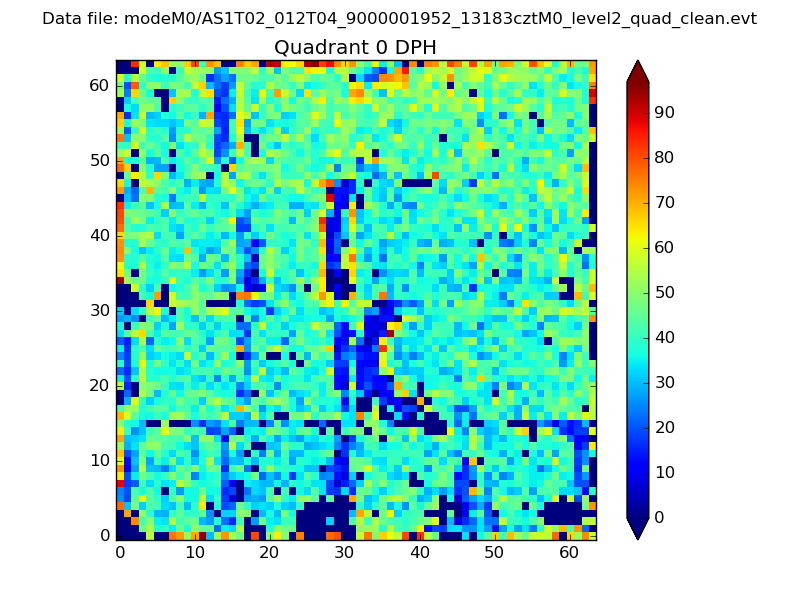 |
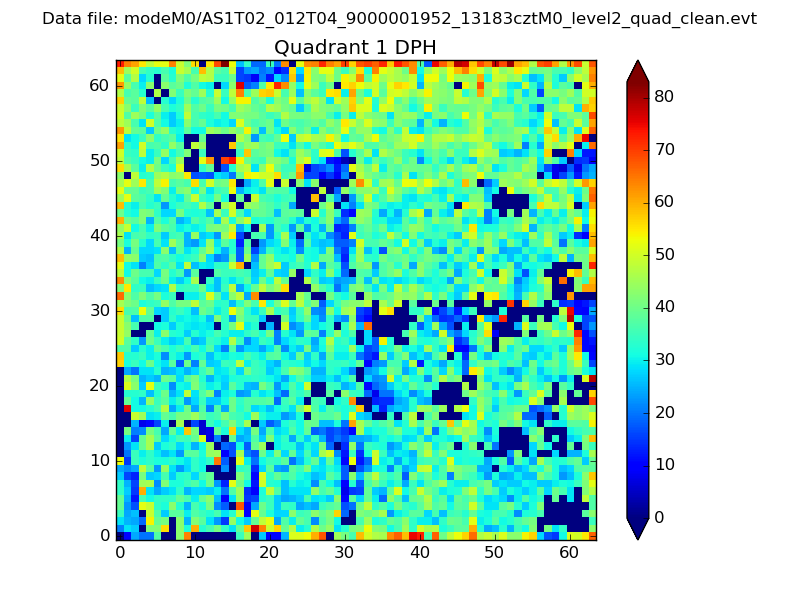 |
Quadrant B |
|---|---|---|---|
| Quadrant D | 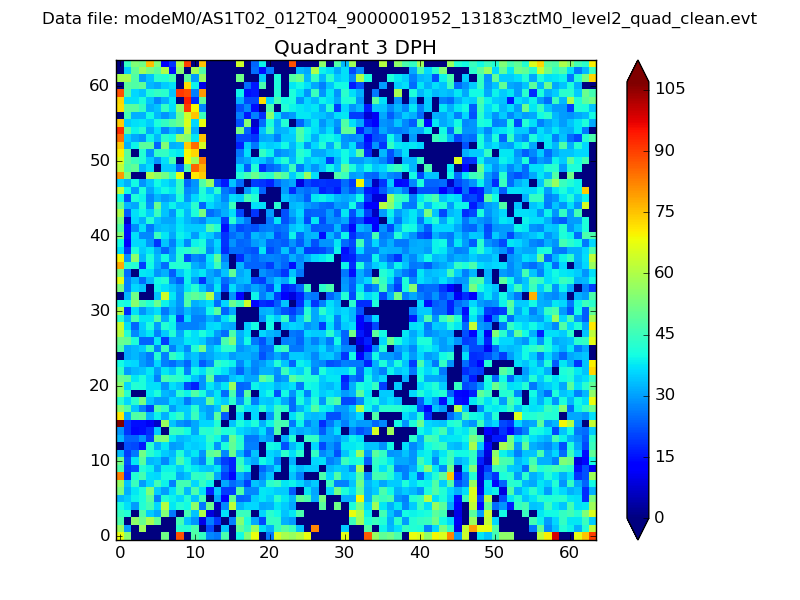 |
 |
Quadrant C |
| Plot type | Count rate plots | Images |
|---|---|---|
| Comparison with Poisson distribution Blue bars denote a histogram of data divided into 1 sec bins. Red curve is a Poisson curve with rate = median count rate of data. |
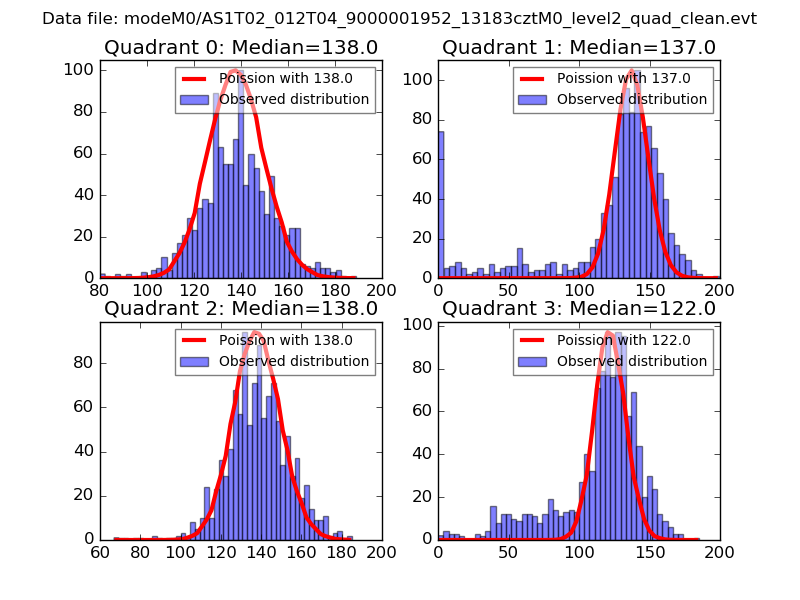 |
 |
| Quadrant-wise count rates Data is divided into 100 sec bins |
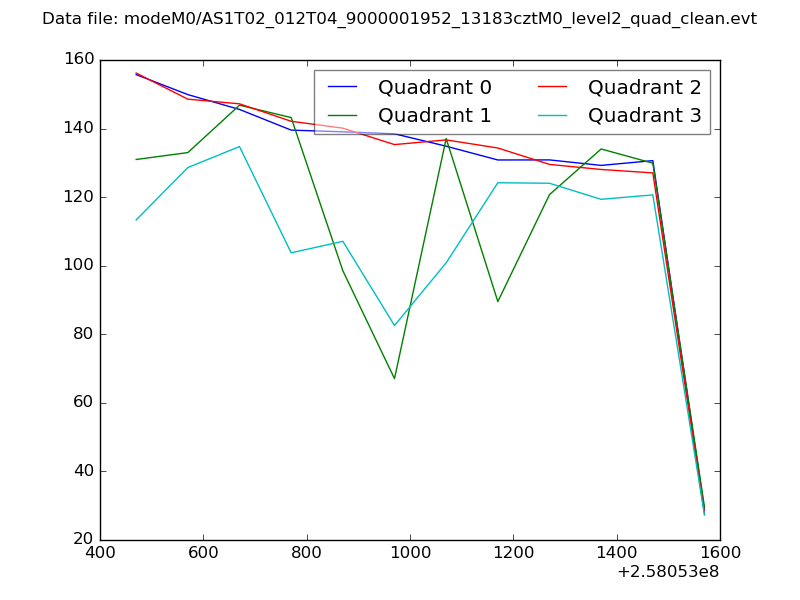 |
|
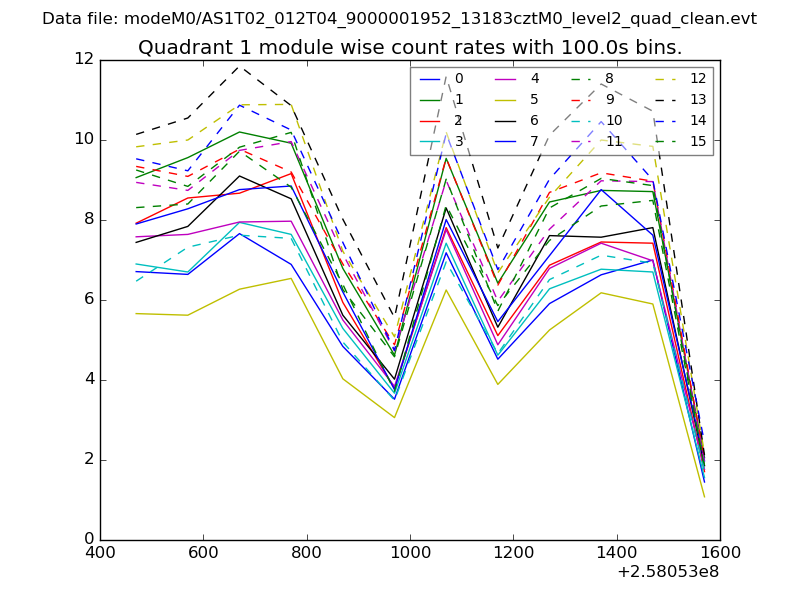
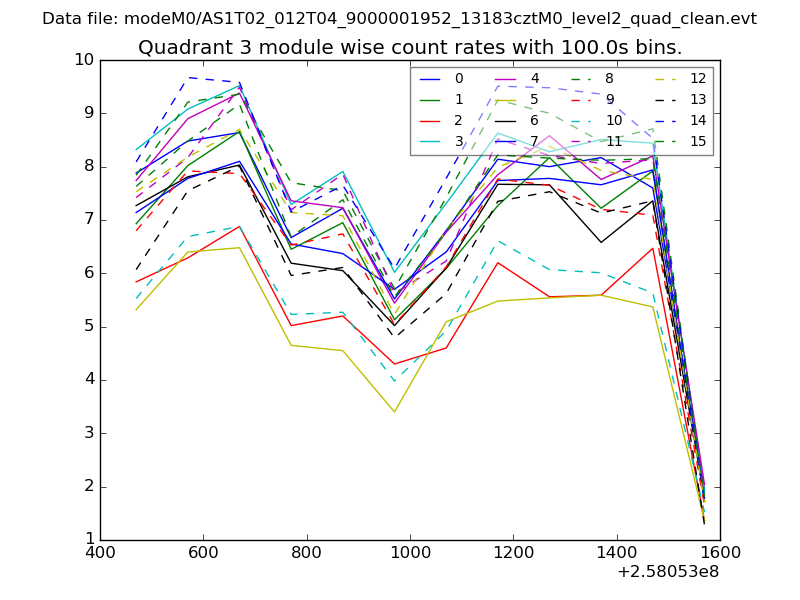
| Module-wise count rates for Quadrant A Data is divided into 100 sec bins |
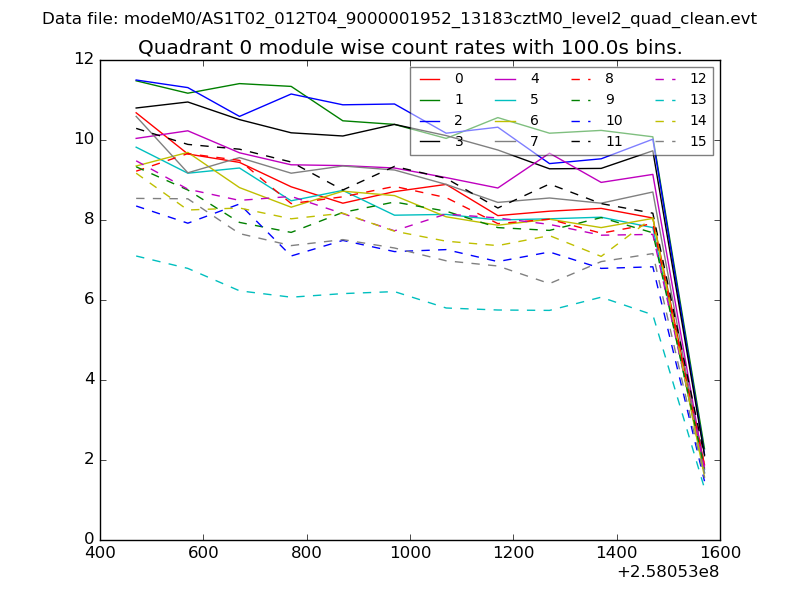 |
 |
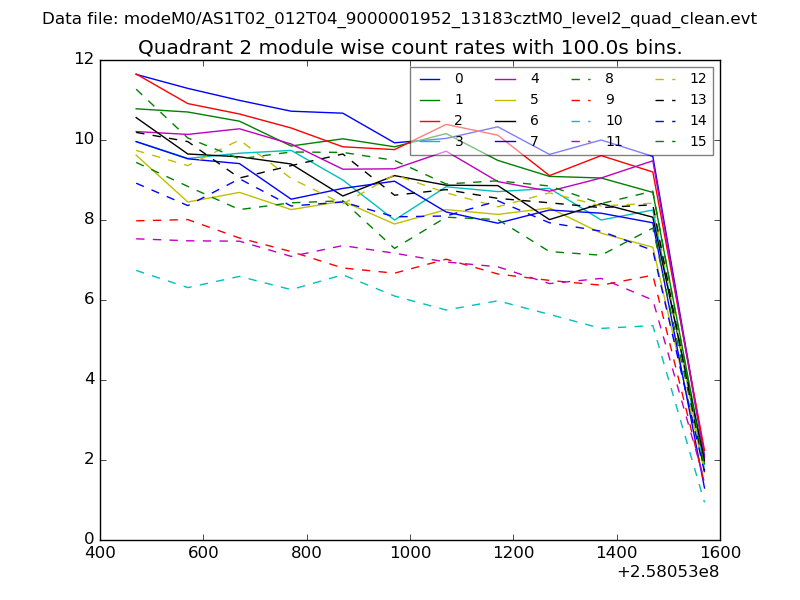
| Module-wise count rates for Quadrant B Data is divided into 100 sec bins |
 |
 |
| Module-wise count rates for Quadrant C Data is divided into 100 sec bins |
 |
 |
| Module-wise count rates for Quadrant D Data is divided into 100 sec bins |
 |
 |
| Parameter | Plot |
|---|---|
| CZT HV Monitor | 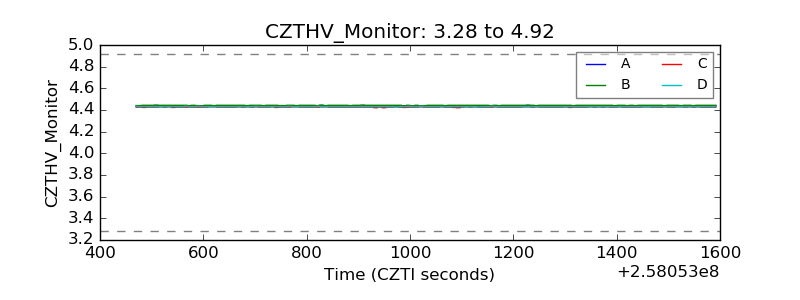 |
| D_VDD | 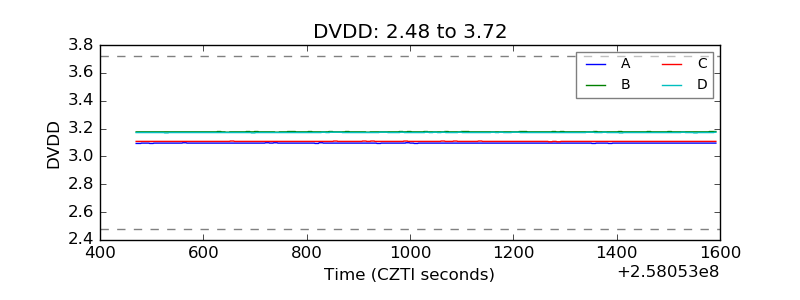 |
| Temperature 1 | 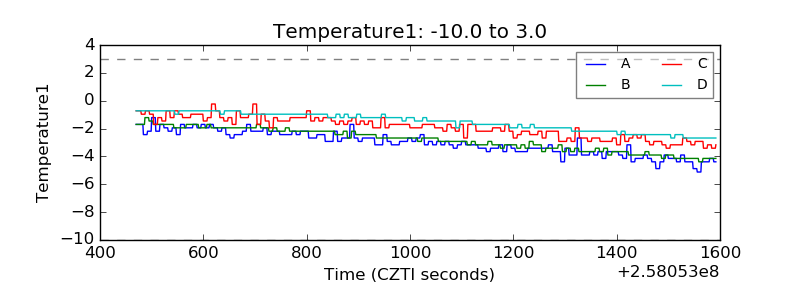 |
| Veto HV Monitor | 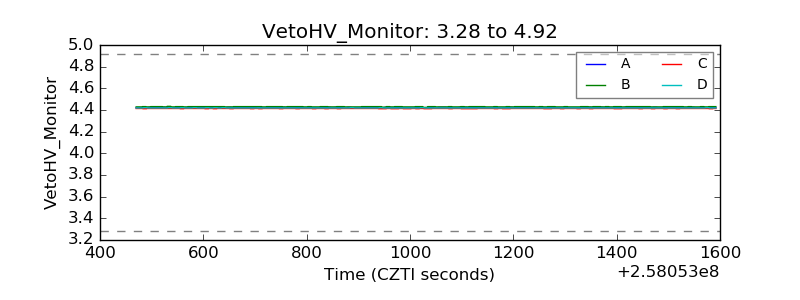 |
| Veto LLD | 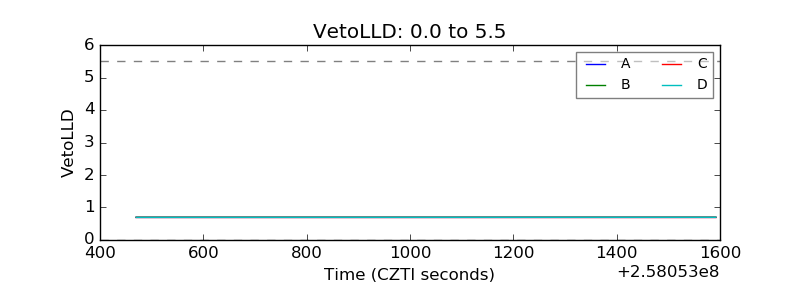 |
| Alpha Counter | 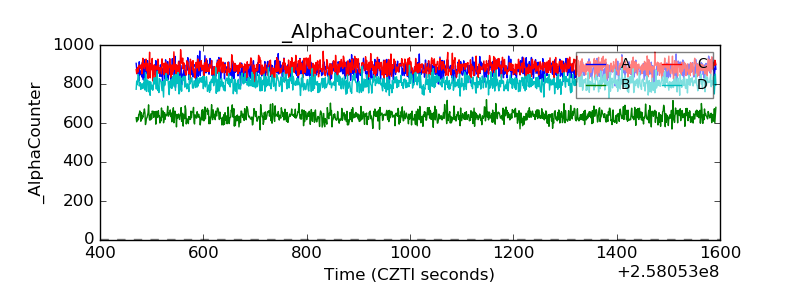 |
| _CPM_Rate | 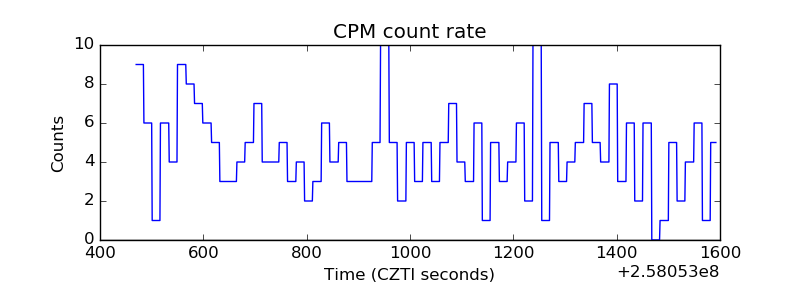 |
| CZT Counter |  |
| +2.5 Volts monitor |  |
| +5 Volts monitor | 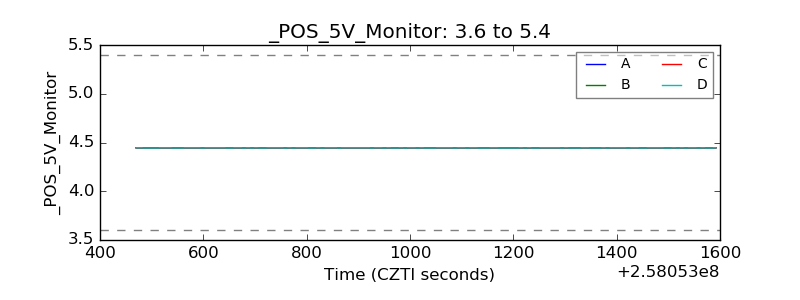 |
| _ROLL_ROT | 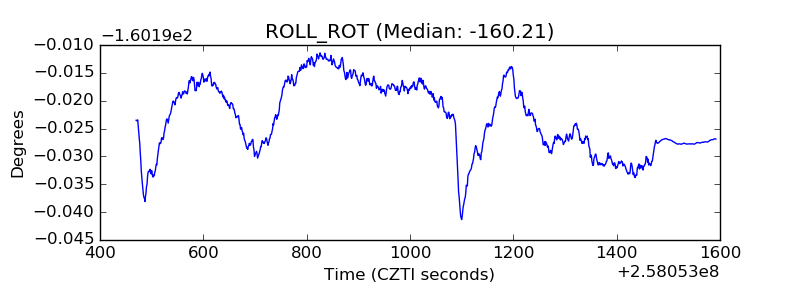 |
| _Roll_DEC | 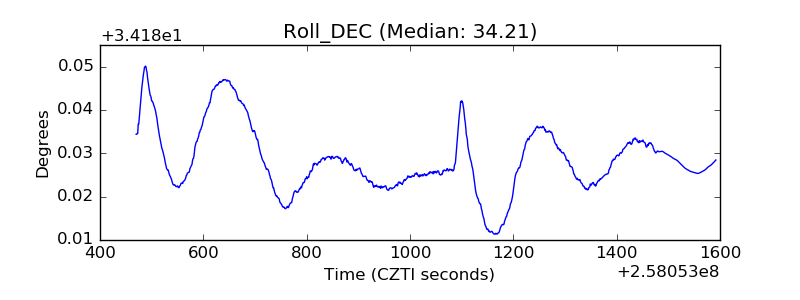 |
| _Roll_RA |  |
| Veto Counter | 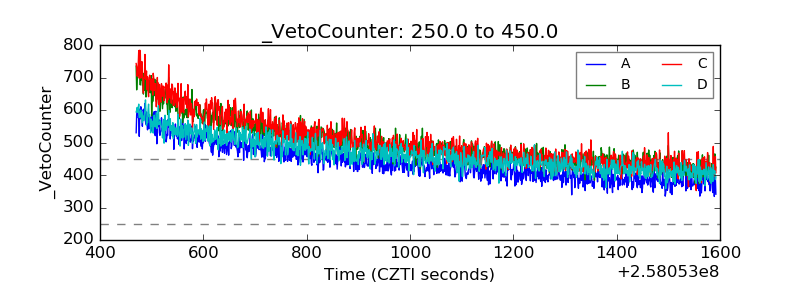 |