| Param | Original file | Final file |
|---|---|---|
| Filename | modeM0/AS1T02_012T05_9000001954_13183cztM0_level2.evt | modeM0/AS1T02_012T05_9000001954_13183cztM0_level2_quad_clean.evt |
| Size (bytes) | 434,113,920 | 47,220,480 |
| Size | 414.0 MB | 45.0 MB |
| Events in quadrant A | 2,032,370 | 301,016 |
| Events in quadrant B | 5,981,308 | 238,258 |
| Events in quadrant C | 1,955,043 | 303,576 |
| Events in quadrant D | 2,883,900 | 281,854 |
| Mode M0 | |||
|---|---|---|---|
| Quadrant | BADHDUFLAG | Total packets | Discarded packets |
| A | 0 | 8921 | 1 |
| B | 0 | 20707 | 1 |
| C | 0 | 8828 | 1 |
| D | 0 | 11486 | 1 |
| Mode SS | |||
|---|---|---|---|
| Quadrant | BADHDUFLAG | Total packets | Discarded packets |
| A | 0 | 88 | 0 |
| B | 0 | 88 | 0 |
| C | 0 | 88 | 0 |
| D | 0 | 88 | 0 |
| Mode M9 | |||
|---|---|---|---|
| Quadrant | BADHDUFLAG | Total packets | Discarded packets |
| A | 0 | 12 | 0 |
| B | 0 | 12 | 0 |
| C | 0 | 12 | 0 |
| D | 0 | 12 | 0 |
| Quadrant | Total seconds | Saturated seconds | Saturation percentage |
|---|---|---|---|
| A | 4325 | 10 | 0.231214% |
| B | 4325 | 1990 | 46.011561% |
| C | 4325 | 10 | 0.231214% |
| D | 4325 | 176 | 4.069364% |
Noise dominated data is calculated using 1-second bins in cleaned event files. If a bin has >2000 counts, and if more than 50% of those come from <1% of pixels, then it is considered to be noise-dominated and hence unusable.
| Quadrant | # 1 sec bins | Bins with >0 counts | Bins with >2000 counts | High rate bins dominated by noise | Noise dominated (total time) | Noise dominated (detector-on time) | Marked lightcurve |
|---|---|---|---|---|---|---|---|
| A | 5506 | 4327 | 0 | 0 | 0.00% | 0.00% | 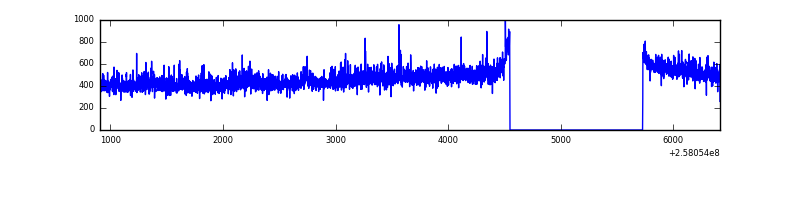 |
| B | 5506 | 4327 | 1318 | 1318 | 23.94% | 30.46% | 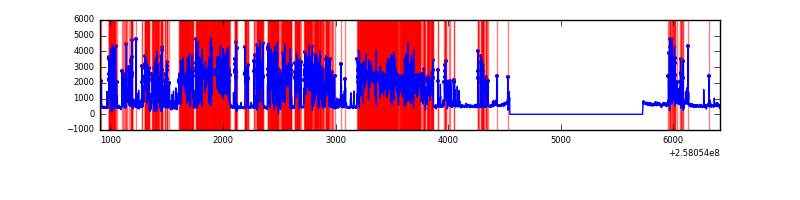 |
| C | 5506 | 4327 | 0 | 0 | 0.00% | 0.00% | 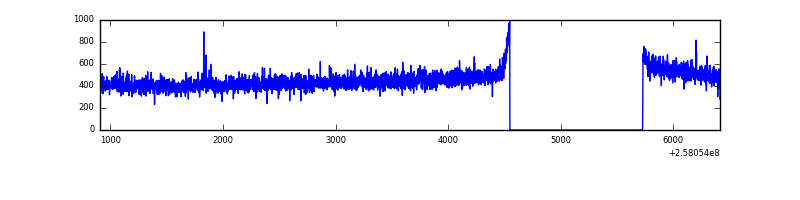 |
| D | 5506 | 4327 | 134 | 134 | 2.43% | 3.10% | 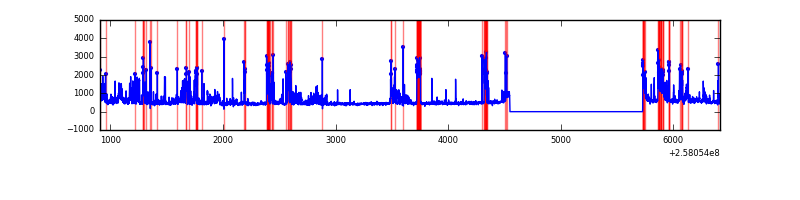 |
Top three noisy pixels from each quadrant. If the there are fewer than three noisy pixels in the level2.evt file, extra rows are filled as -1
| Pixel properties | Quadrant properties | ||||||
|---|---|---|---|---|---|---|---|
| Quadrant | DetID | PixID | Counts | Sigma | Mean | Median | Sigma |
| A | 12 | 189 | 51177 | 484.15 | 509 | 498 | 104.7 |
| A | 4 | 2 | 7915 | 70.86 | 509 | 498 | 104.7 |
| A | 1 | 162 | 6816 | 60.36 | 509 | 498 | 104.7 |
| B | 4 | 239 | 4508210 | 65010.68 | 356 | 347 | 69.3 |
| B | 0 | 189 | 30615 | 436.51 | 356 | 347 | 69.3 |
| B | 0 | 214 | 18252 | 258.22 | 356 | 347 | 69.3 |
| C | 15 | 208 | 3705 | 27.47 | 500 | 502 | 116.6 |
| C | 13 | 61 | 3657 | 27.06 | 500 | 502 | 116.6 |
| C | 3 | 202 | 1209 | 6.06 | 500 | 502 | 116.6 |
| D | 13 | 122 | 866458 | 7238.89 | 490 | 475 | 119.6 |
| D | 1 | 52 | 70876 | 588.49 | 490 | 475 | 119.6 |
| D | 12 | 222 | 41741 | 344.95 | 490 | 475 | 119.6 |
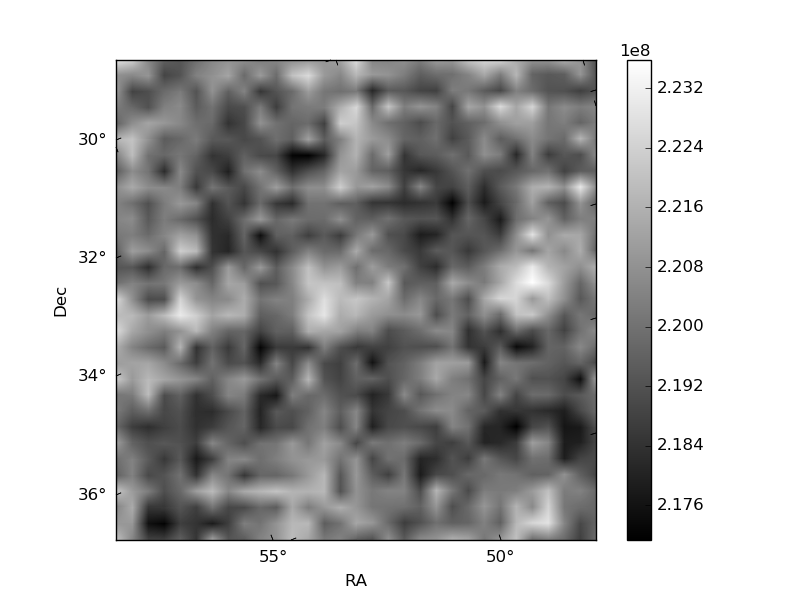
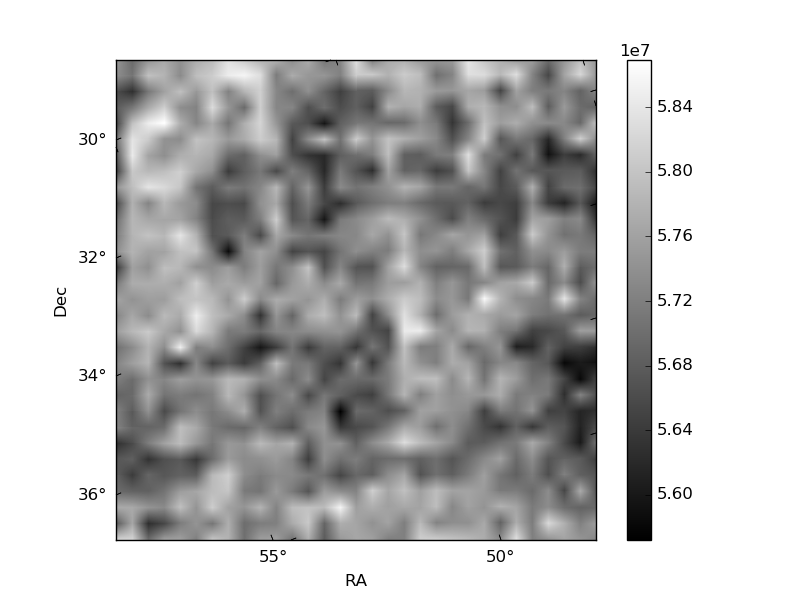
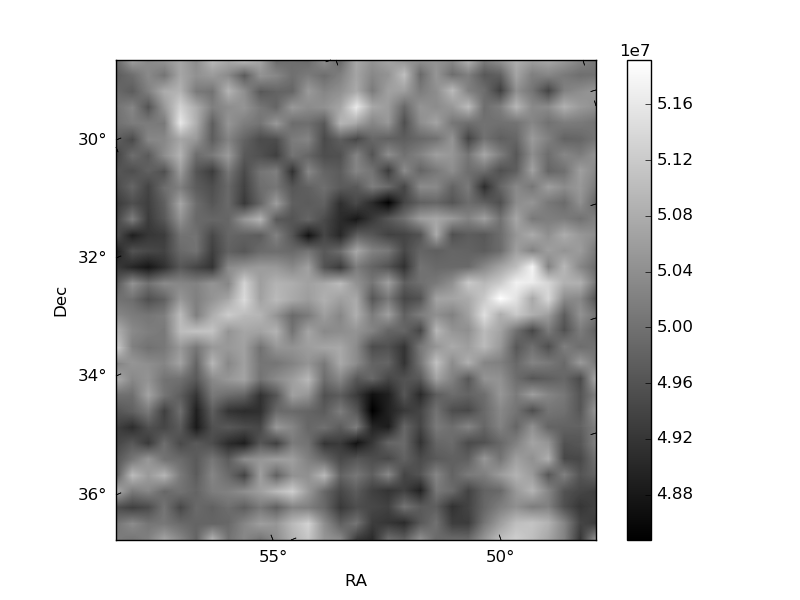
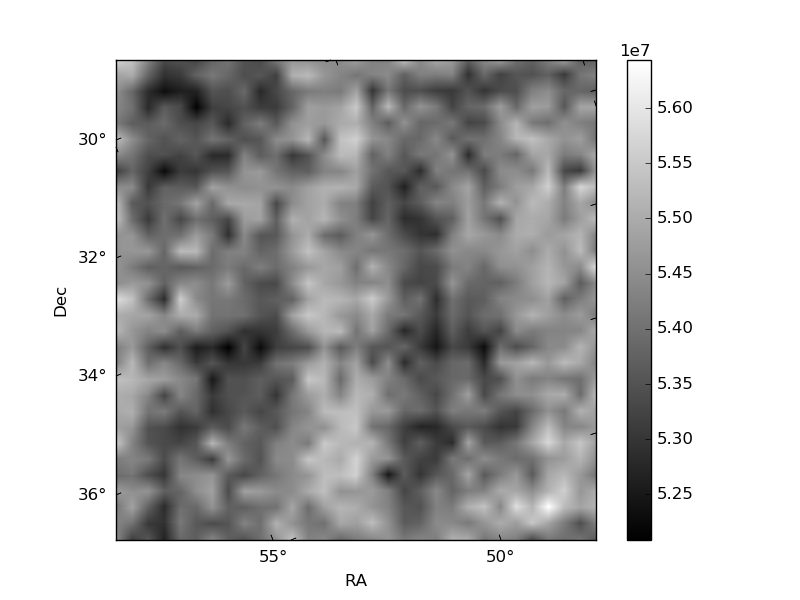
Histogram calculated using DETX and DETY for each event in the final _common_clean file
| Quadrant A | 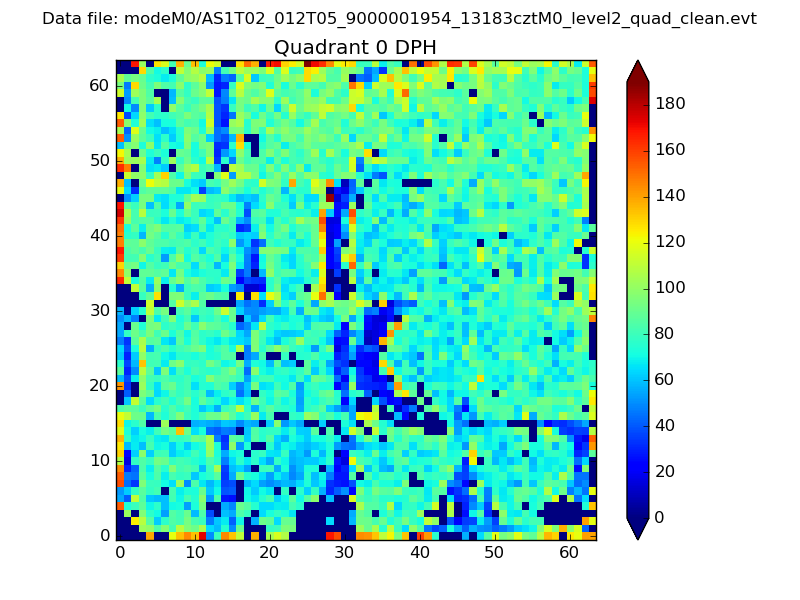 |
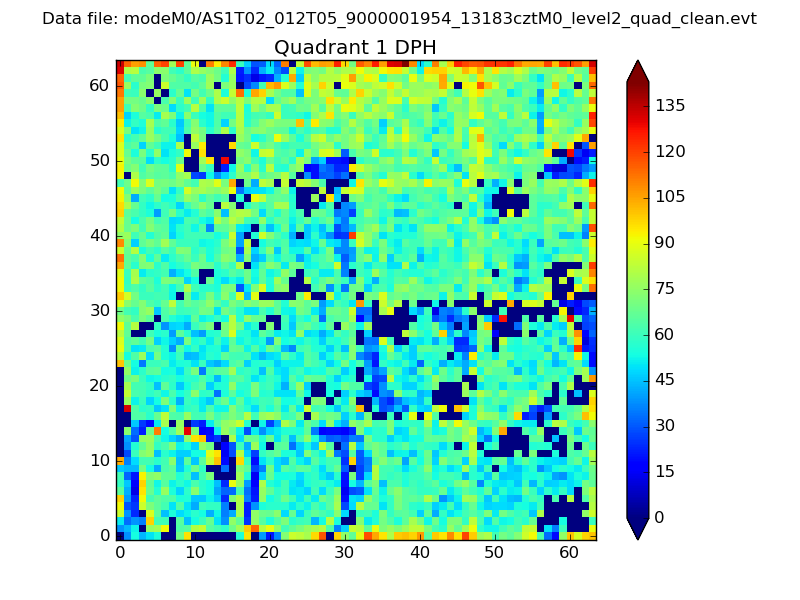 |
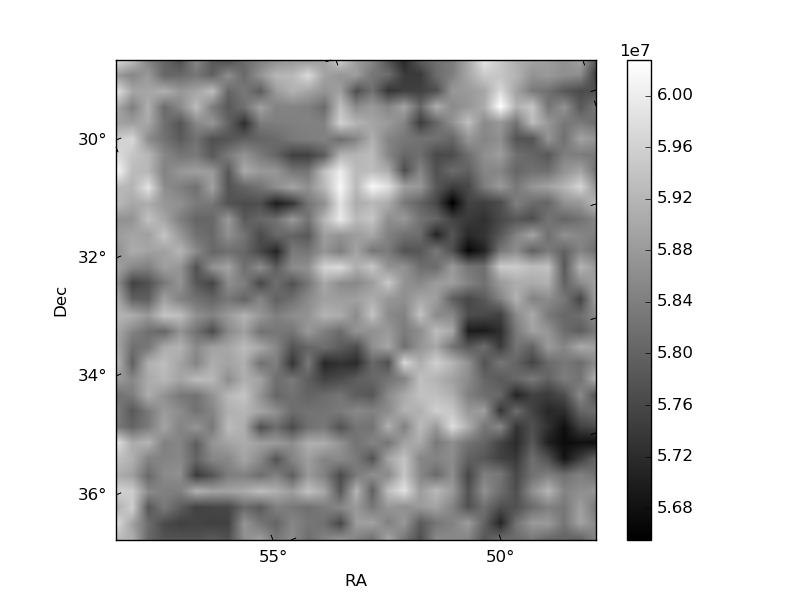
Quadrant B |
|---|---|---|---|
| Quadrant D | 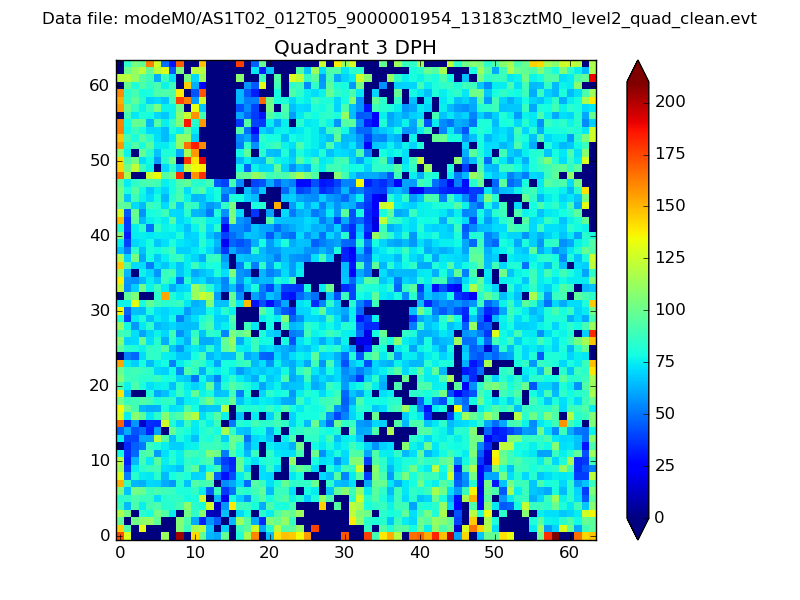 |
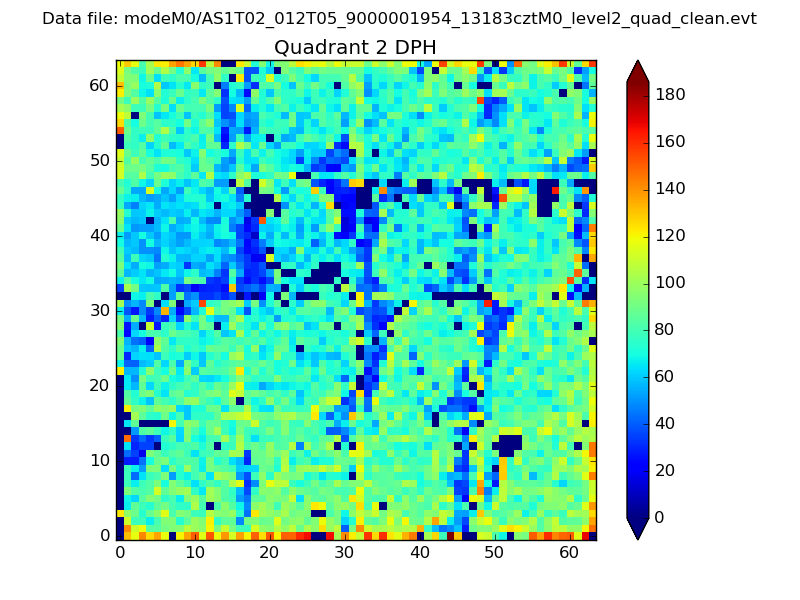 |
Quadrant C |
| Plot type | Count rate plots | Images |
|---|---|---|
| Comparison with Poisson distribution Blue bars denote a histogram of data divided into 1 sec bins. Red curve is a Poisson curve with rate = median count rate of data. |
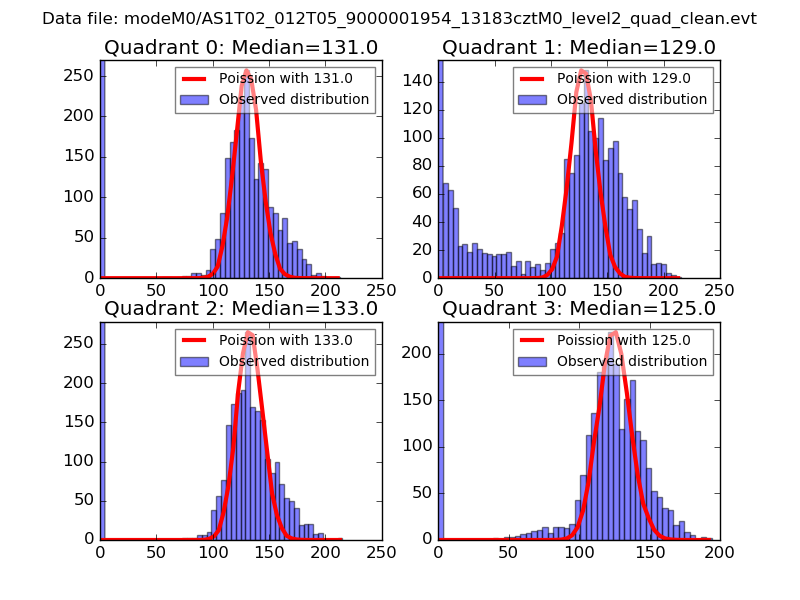 |
 |
| Quadrant-wise count rates Data is divided into 100 sec bins |
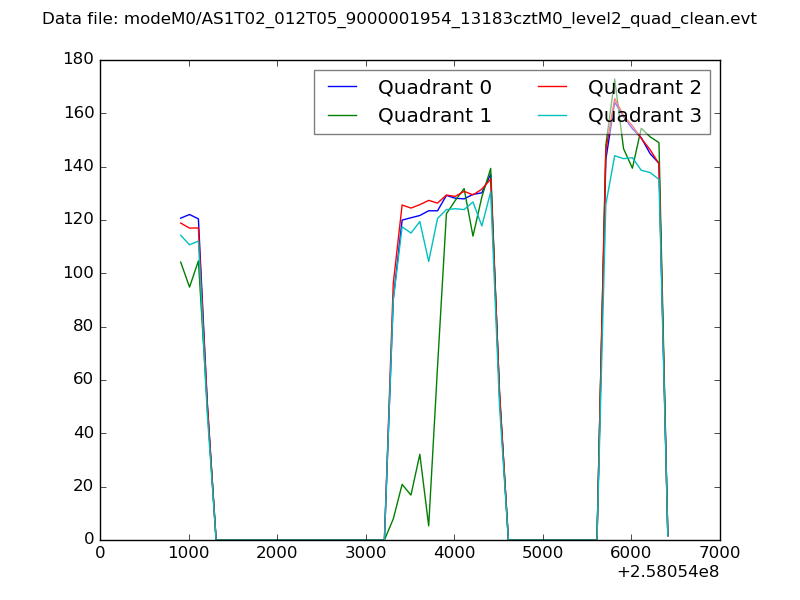 |
|
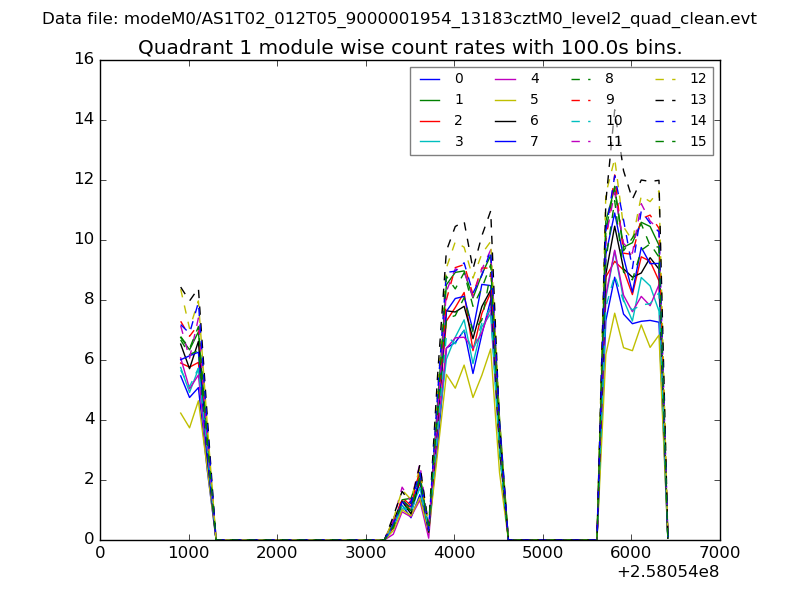
| Module-wise count rates for Quadrant A Data is divided into 100 sec bins |
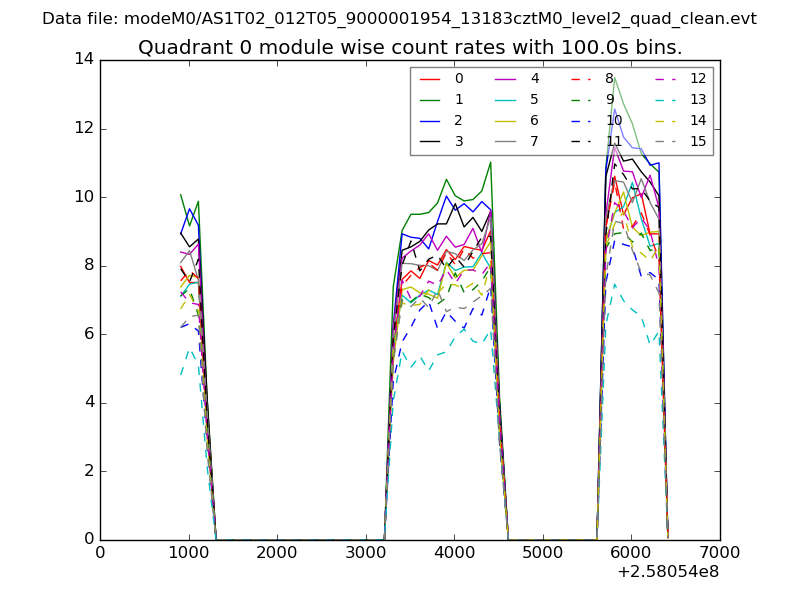 |
 |
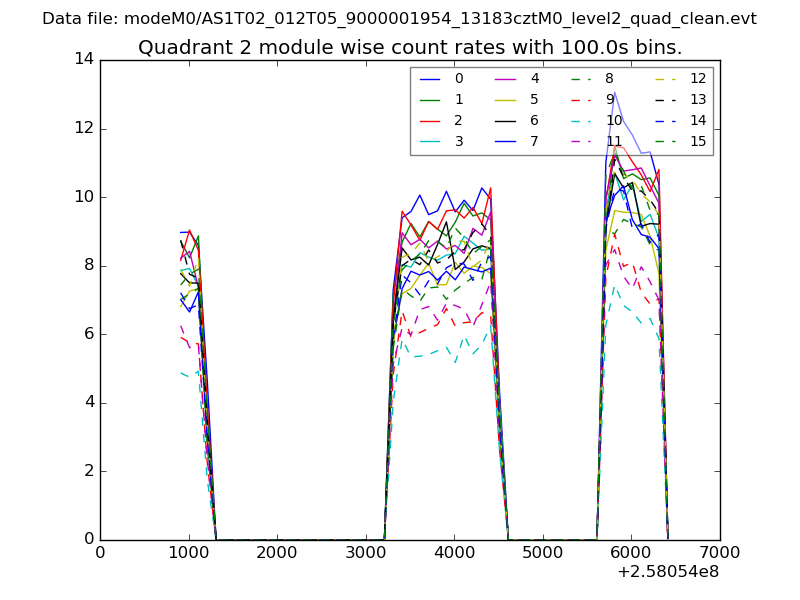
| Module-wise count rates for Quadrant B Data is divided into 100 sec bins |
 |
 |
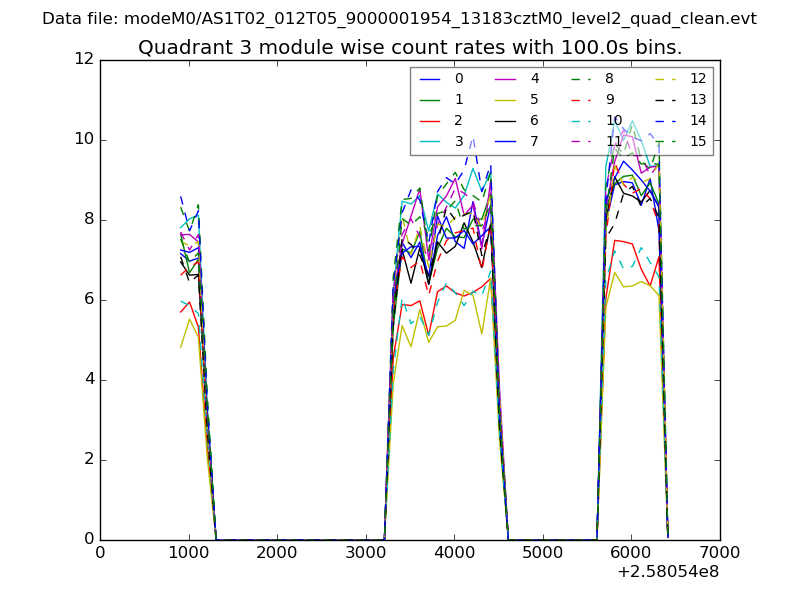
| Module-wise count rates for Quadrant C Data is divided into 100 sec bins |
 |
 |
| Module-wise count rates for Quadrant D Data is divided into 100 sec bins |
 |
 |
| Parameter | Plot |
|---|---|
| CZT HV Monitor | 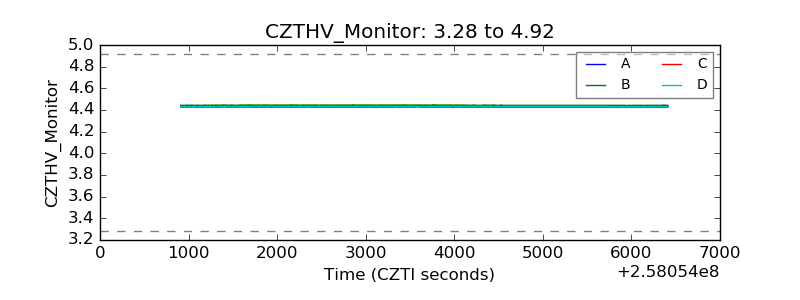 |
| D_VDD | 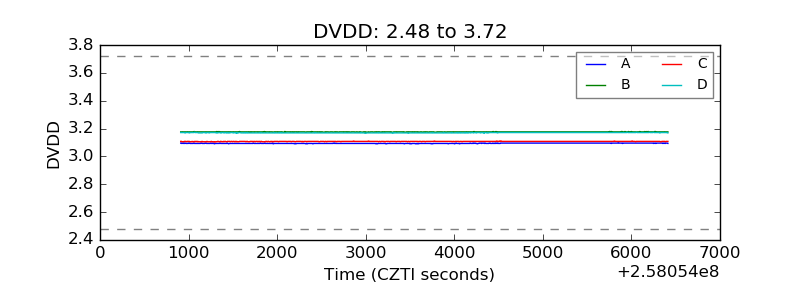 |
| Temperature 1 | 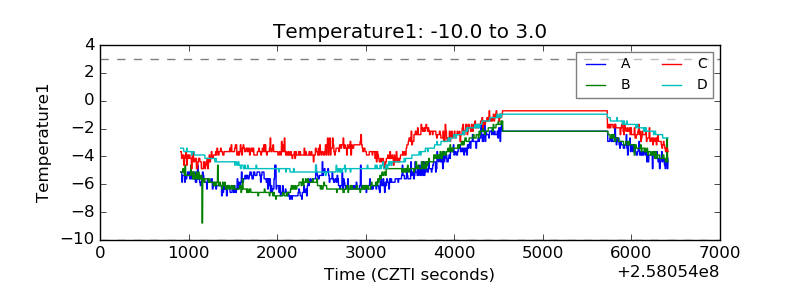 |
| Veto HV Monitor | 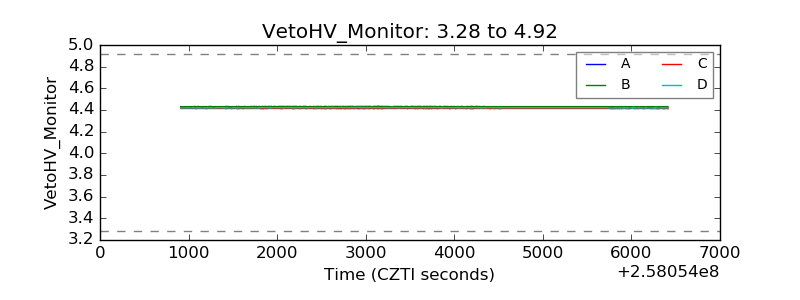 |
| Veto LLD | 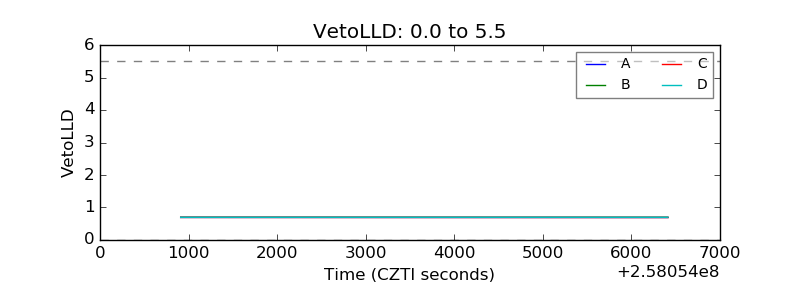 |
| Alpha Counter | 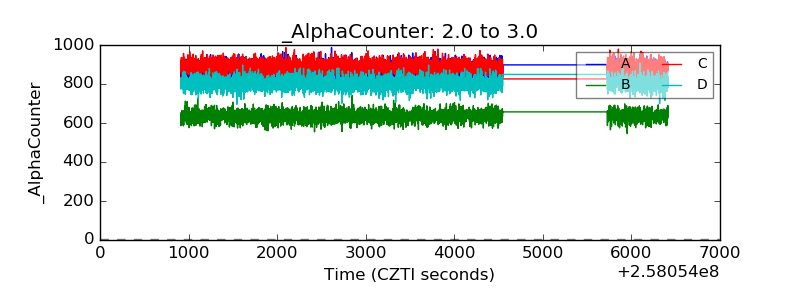 |
| _CPM_Rate | 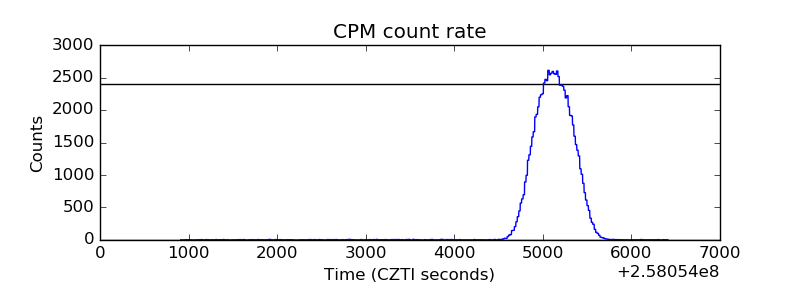 |
| CZT Counter | 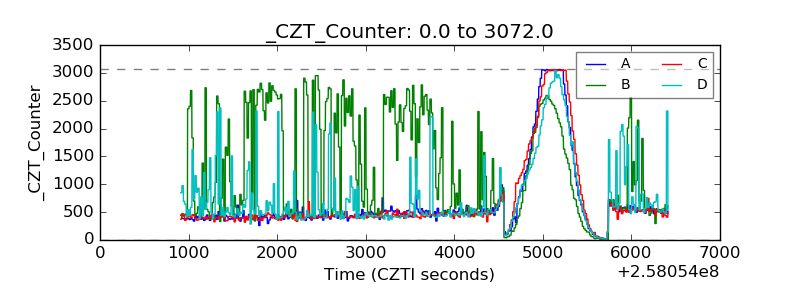 |
| +2.5 Volts monitor |  |
| +5 Volts monitor | 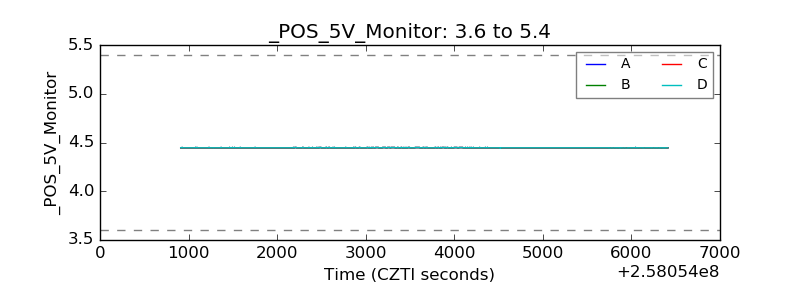 |
| _ROLL_ROT | 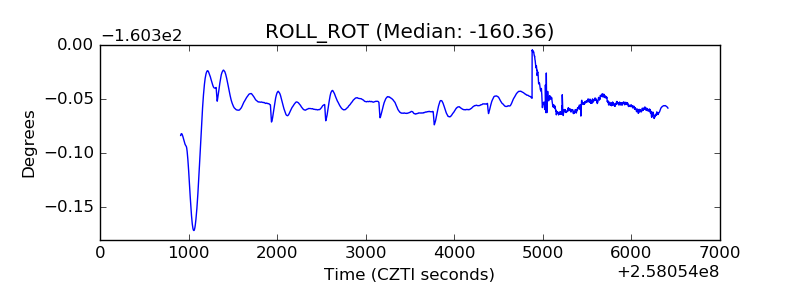 |
| _Roll_DEC | 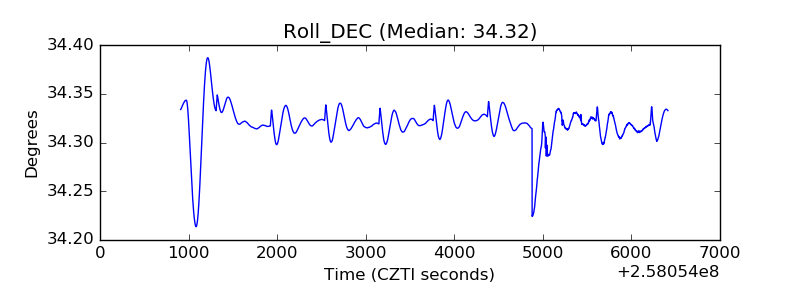 |
| _Roll_RA | 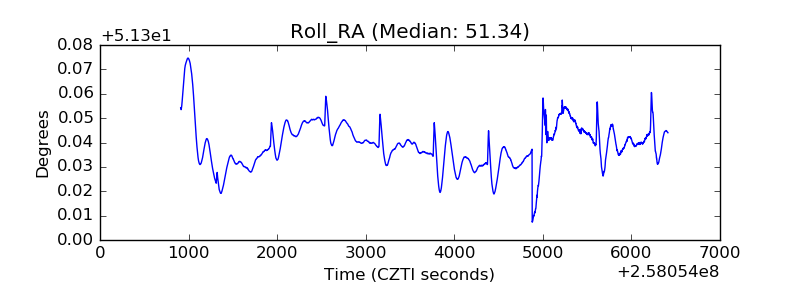 |
| Veto Counter | 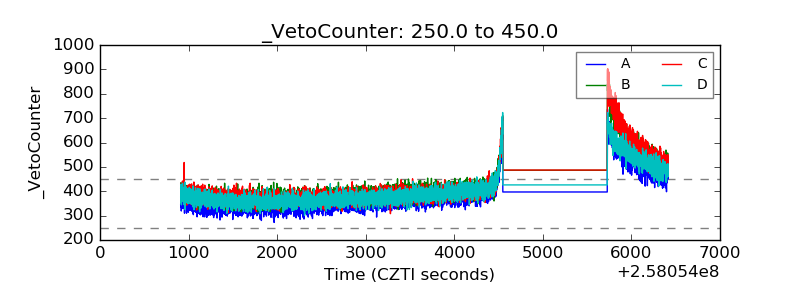 |