| Param | Original file | Final file |
|---|---|---|
| Filename | modeM0/AS1T02_012T05_9000001954_13184cztM0_level2.evt | modeM0/AS1T02_012T05_9000001954_13184cztM0_level2_quad_clean.evt |
| Size (bytes) | 63,518,400 | 15,609,600 |
| Size | 60.6 MB | 14.9 MB |
| Events in quadrant A | 376,513 | 106,151 |
| Events in quadrant B | 542,335 | 106,486 |
| Events in quadrant C | 369,519 | 106,775 |
| Events in quadrant D | 585,328 | 97,110 |
| Mode M0 | |||
|---|---|---|---|
| Quadrant | BADHDUFLAG | Total packets | Discarded packets |
| A | 0 | 1511 | 1 |
| B | 0 | 2085 | 1 |
| C | 0 | 1482 | 1 |
| D | 0 | 2200 | 1 |
| Mode SS | |||
|---|---|---|---|
| Quadrant | BADHDUFLAG | Total packets | Discarded packets |
| A | 0 | 14 | 0 |
| B | 0 | 14 | 0 |
| C | 0 | 14 | 0 |
| D | 0 | 14 | 0 |
| Mode M9 | |||
|---|---|---|---|
| Quadrant | BADHDUFLAG | Total packets | Discarded packets |
| A | 0 | 3 | 0 |
| B | 0 | 3 | 0 |
| C | 0 | 3 | 0 |
| D | 0 | 4 | 0 |
| Quadrant | Total seconds | Saturated seconds | Saturation percentage |
|---|---|---|---|
| A | 686 | 1 | 0.145773% |
| B | 686 | 52 | 7.580175% |
| C | 686 | 1 | 0.145773% |
| D | 686 | 51 | 7.434402% |
Noise dominated data is calculated using 1-second bins in cleaned event files. If a bin has >2000 counts, and if more than 50% of those come from <1% of pixels, then it is considered to be noise-dominated and hence unusable.
| Quadrant | # 1 sec bins | Bins with >0 counts | Bins with >2000 counts | High rate bins dominated by noise | Noise dominated (total time) | Noise dominated (detector-on time) | Marked lightcurve |
|---|---|---|---|---|---|---|---|
| A | 687 | 687 | 0 | 0 | 0.00% | 0.00% | 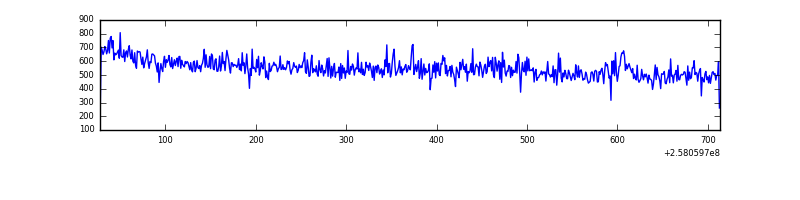 |
| B | 687 | 687 | 27 | 27 | 3.93% | 3.93% | 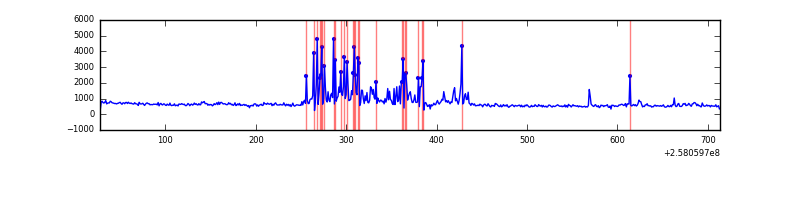 |
| C | 687 | 687 | 0 | 0 | 0.00% | 0.00% | 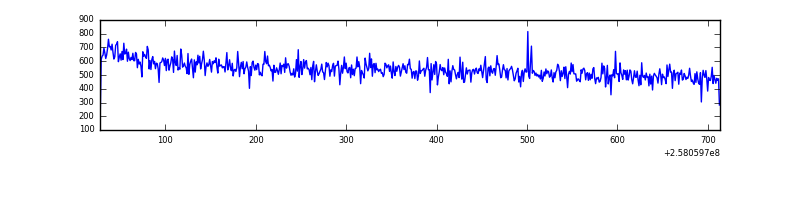 |
| D | 687 | 687 | 35 | 35 | 5.09% | 5.09% | 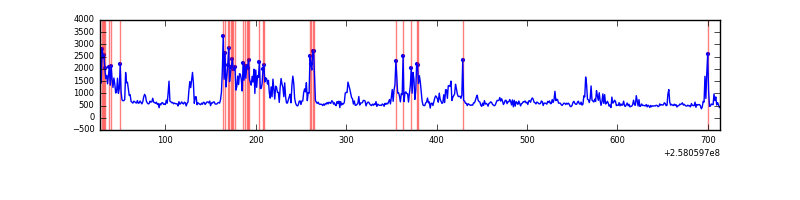 |
Top three noisy pixels from each quadrant. If the there are fewer than three noisy pixels in the level2.evt file, extra rows are filled as -1
| Pixel properties | Quadrant properties | ||||||
|---|---|---|---|---|---|---|---|
| Quadrant | DetID | PixID | Counts | Sigma | Mean | Median | Sigma |
| A | 1 | 162 | 3780 | 176.81 | 95 | 93 | 20.9 |
| A | 2 | 79 | 2010 | 91.93 | 95 | 93 | 20.9 |
| A | 1 | 178 | 1283 | 57.07 | 95 | 93 | 20.9 |
| B | 4 | 239 | 126024 | 6402.56 | 93 | 91 | 19.7 |
| B | 0 | 189 | 29764 | 1508.61 | 93 | 91 | 19.7 |
| B | 4 | 216 | 9567 | 481.77 | 93 | 91 | 19.7 |
| C | 13 | 61 | 670 | 24.26 | 94 | 94 | 23.7 |
| C | 14 | 234 | 473 | 15.97 | 94 | 94 | 23.7 |
| C | 7 | 159 | 242 | 6.23 | 94 | 94 | 23.7 |
| D | 13 | 122 | 157505 | 6581.78 | 91 | 88 | 23.9 |
| D | 12 | 222 | 37473 | 1563.11 | 91 | 88 | 23.9 |
| D | 1 | 52 | 17008 | 707.44 | 91 | 88 | 23.9 |
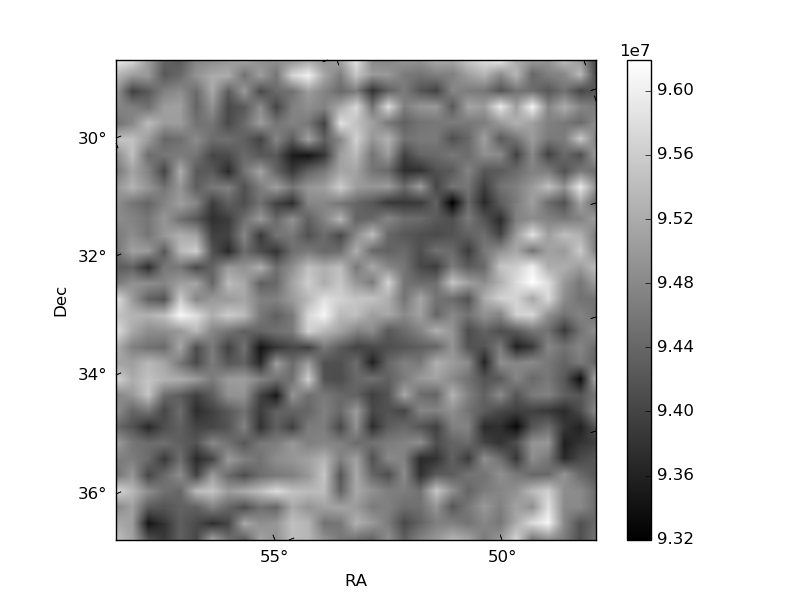
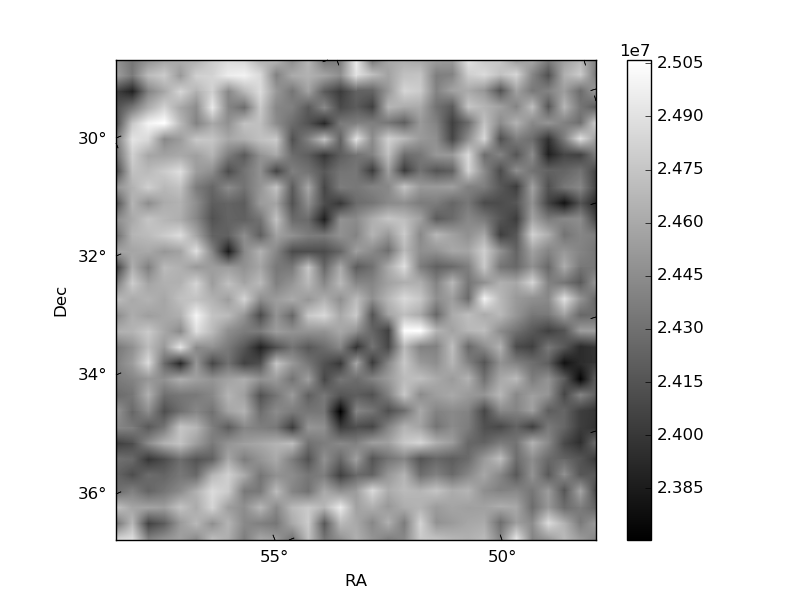
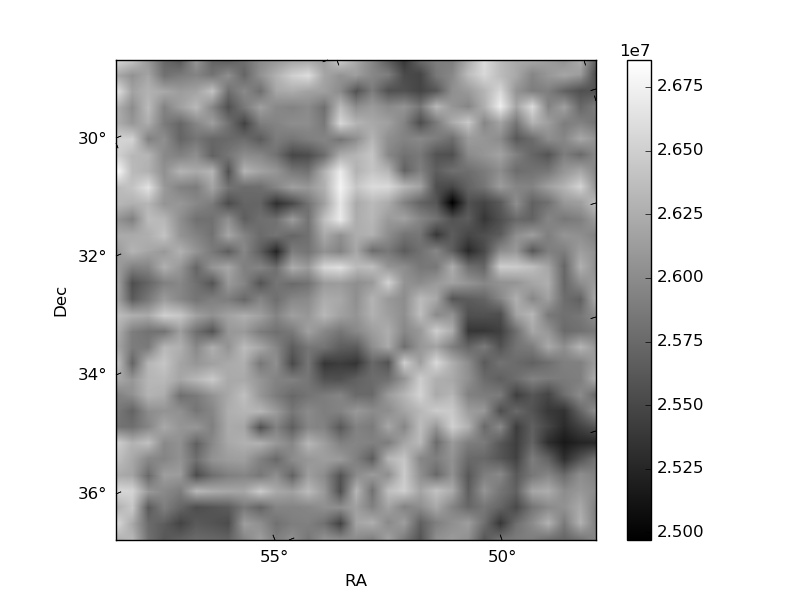
Histogram calculated using DETX and DETY for each event in the final _common_clean file
| Quadrant A | 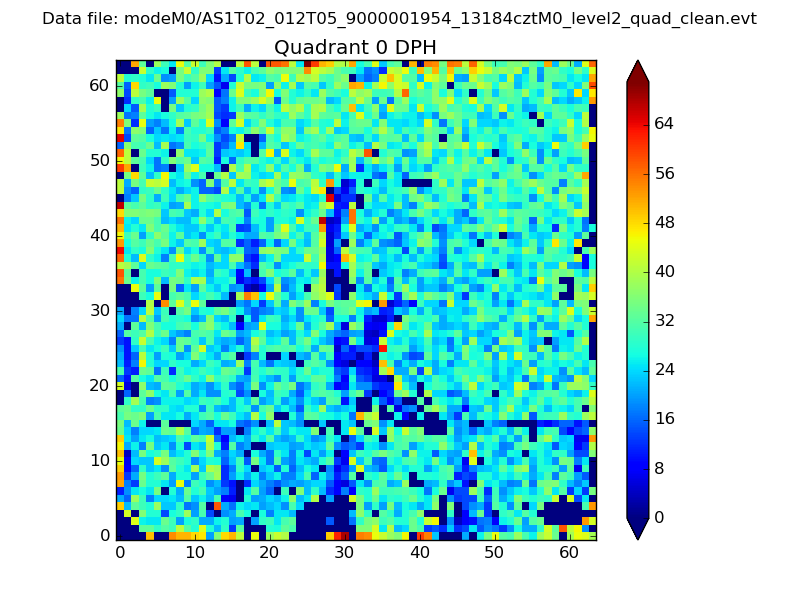 |
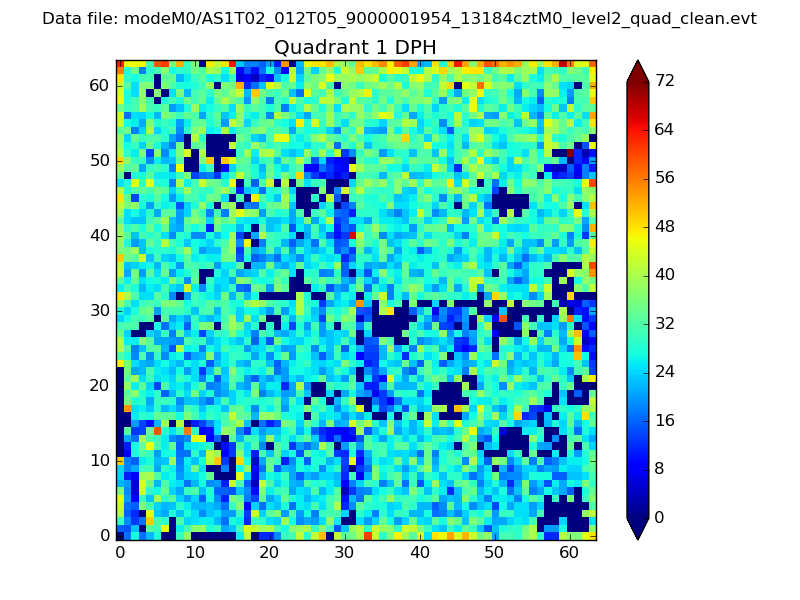 |
Quadrant B |
|---|---|---|---|
| Quadrant D | 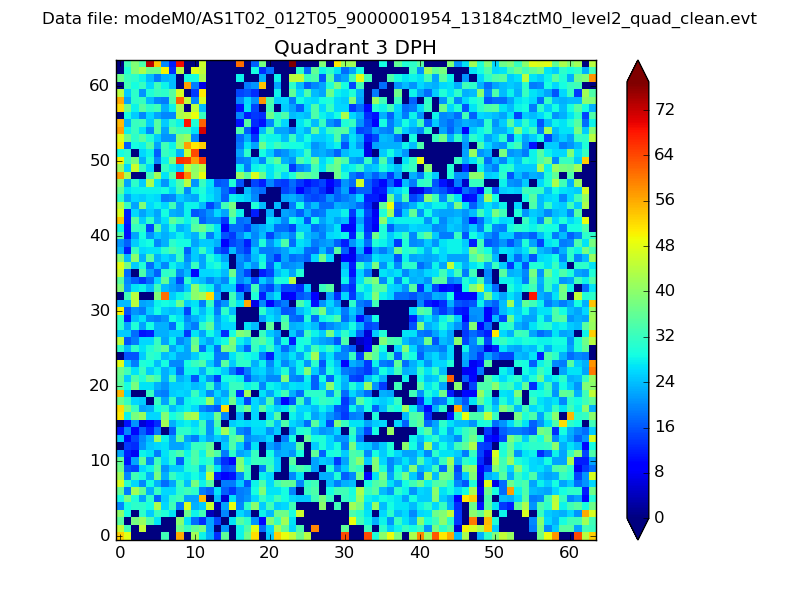 |
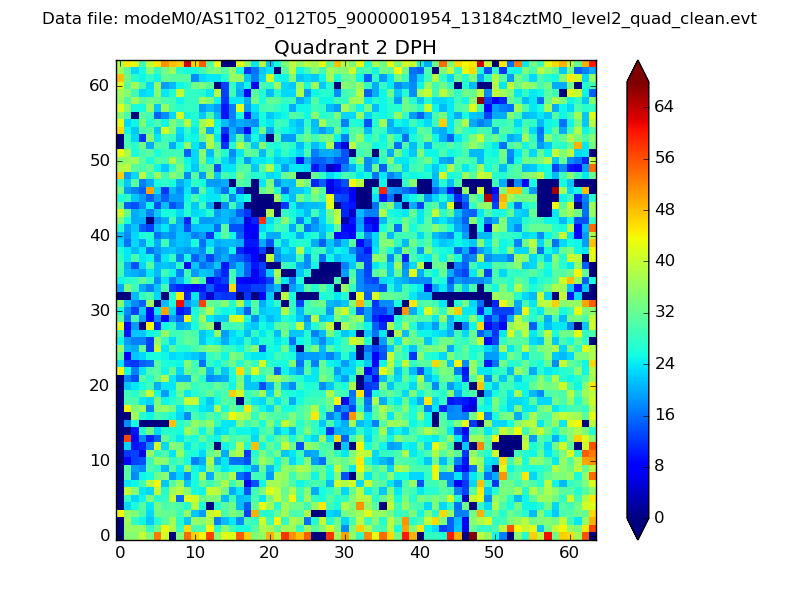 |
Quadrant C |
| Plot type | Count rate plots | Images |
|---|---|---|
| Comparison with Poisson distribution Blue bars denote a histogram of data divided into 1 sec bins. Red curve is a Poisson curve with rate = median count rate of data. |
 |
 |
| Quadrant-wise count rates Data is divided into 100 sec bins |
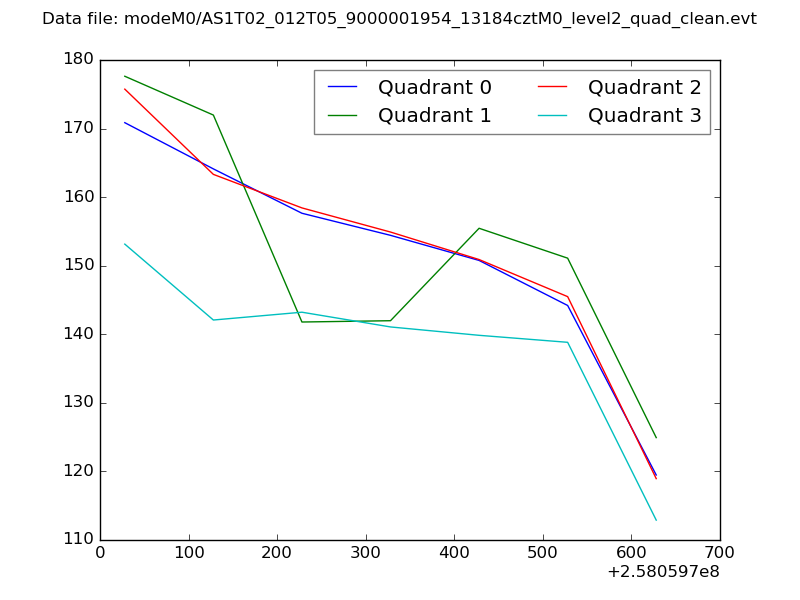 |
|
| Module-wise count rates for Quadrant A Data is divided into 100 sec bins |
 |
 |
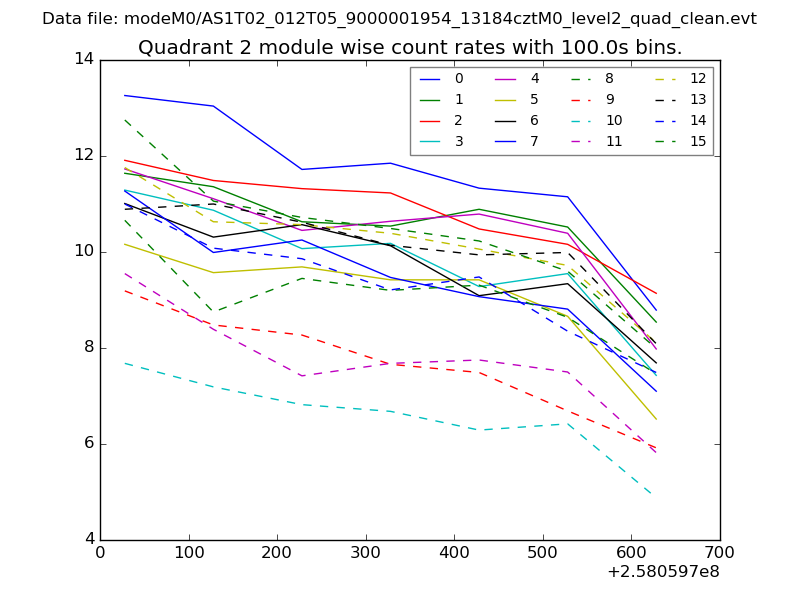
| Module-wise count rates for Quadrant B Data is divided into 100 sec bins |
 |
 |
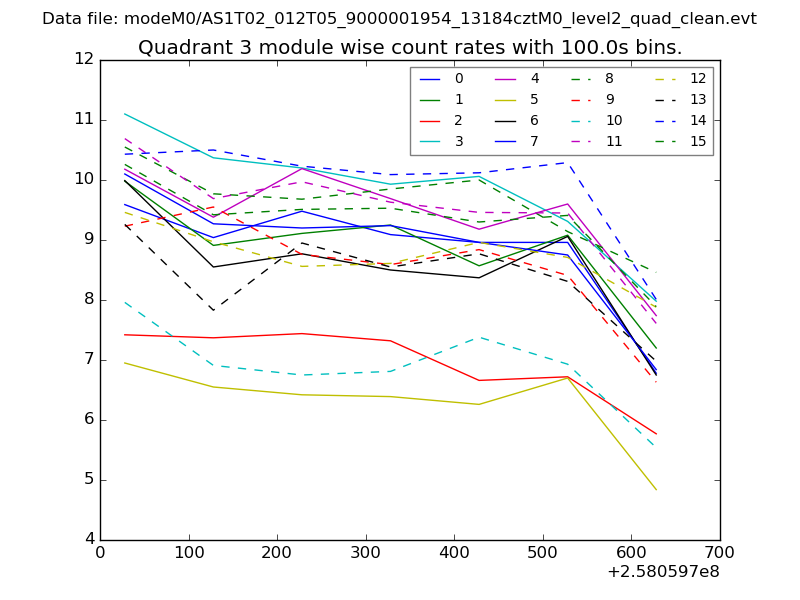
| Module-wise count rates for Quadrant C Data is divided into 100 sec bins |
 |
 |
| Module-wise count rates for Quadrant D Data is divided into 100 sec bins |
 |
 |
| Parameter | Plot |
|---|---|
| CZT HV Monitor | 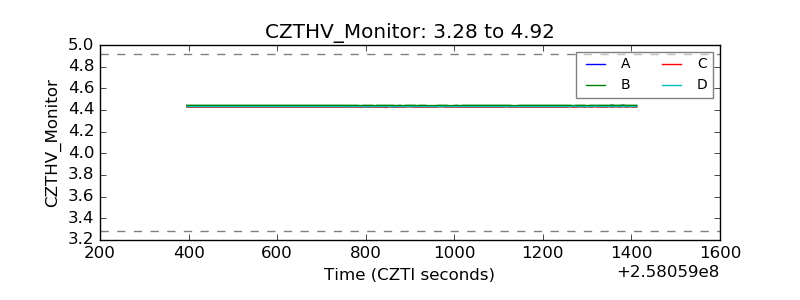 |
| D_VDD | 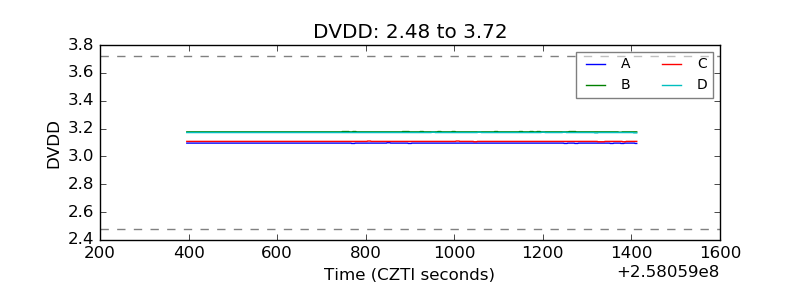 |
| Temperature 1 | 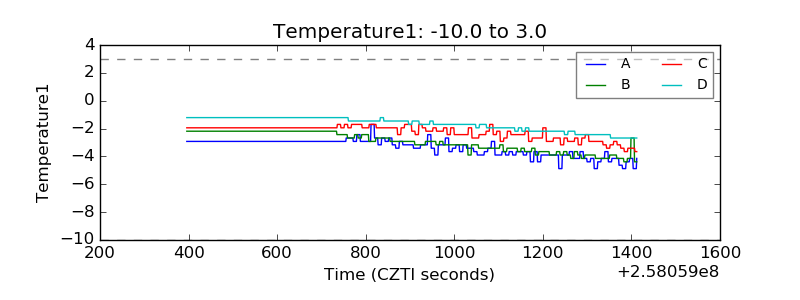 |
| Veto HV Monitor | 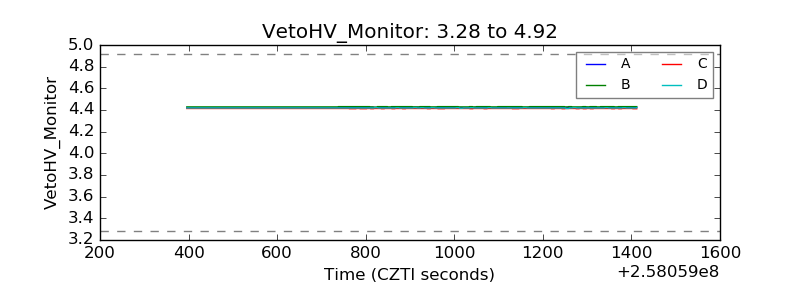 |
| Veto LLD | 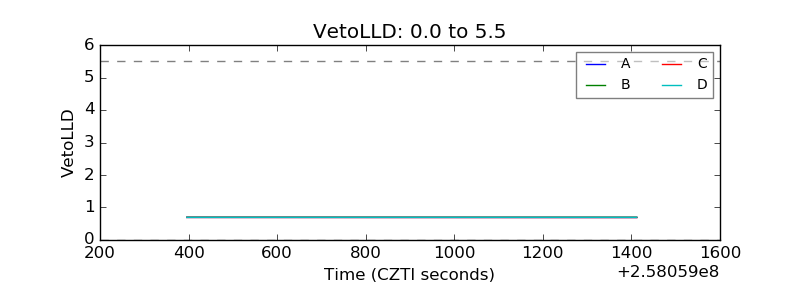 |
| Alpha Counter | 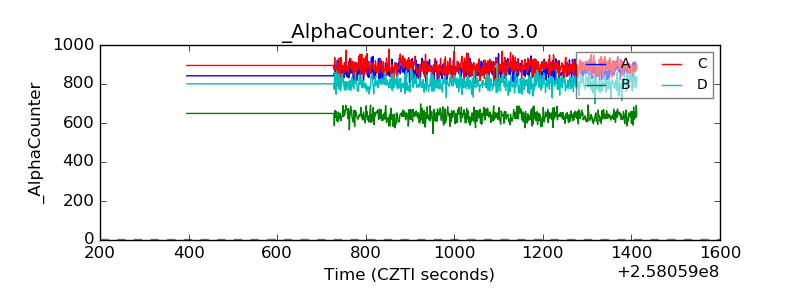 |
| _CPM_Rate | 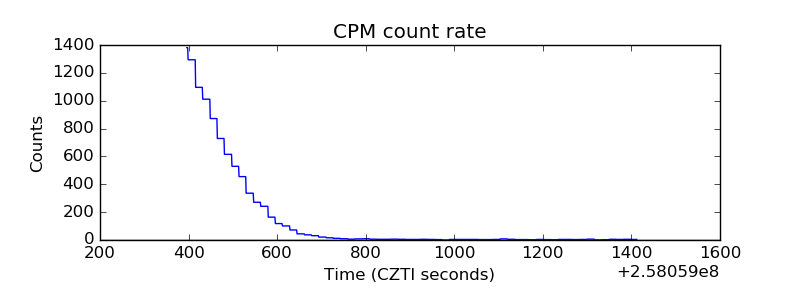 |
| CZT Counter | 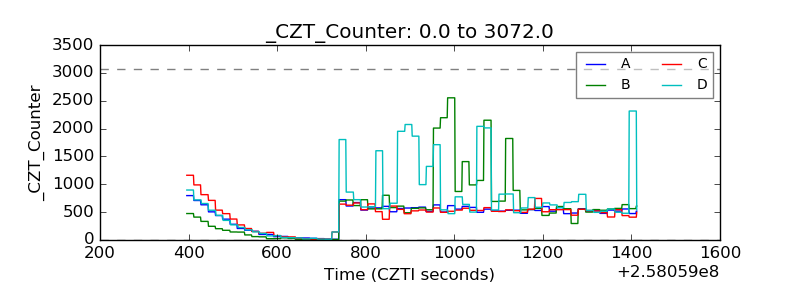 |
| +2.5 Volts monitor | 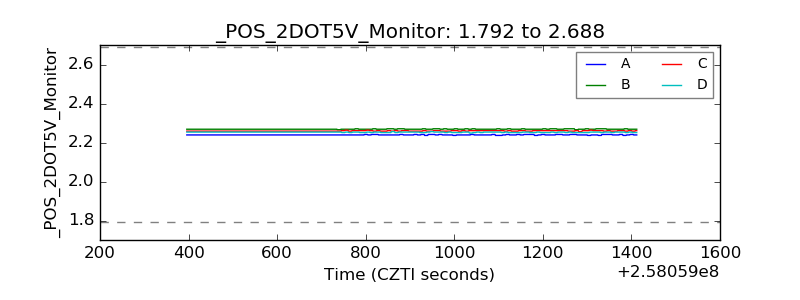 |
| +5 Volts monitor |  |
| _ROLL_ROT | 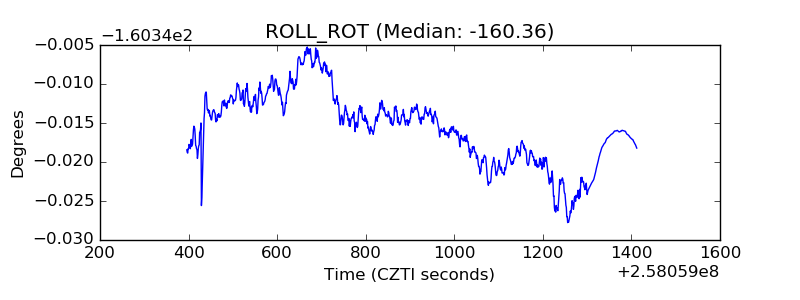 |
| _Roll_DEC | 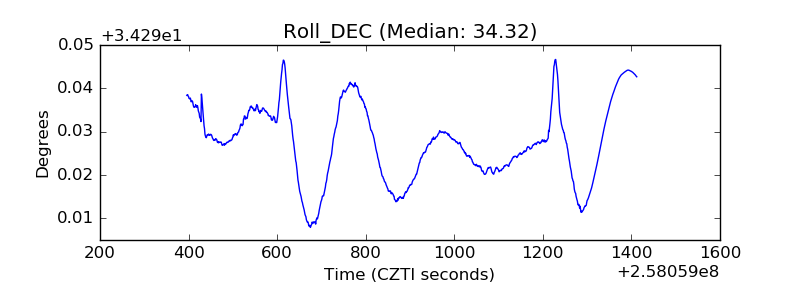 |
| _Roll_RA | 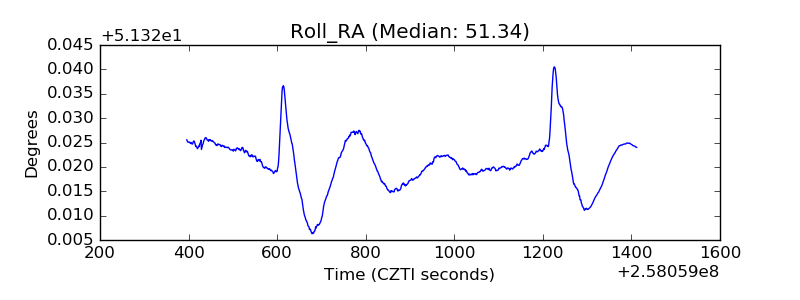 |
| Veto Counter | 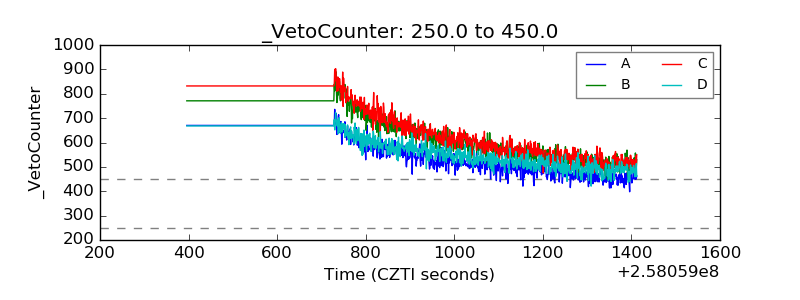 |