| Param | Original file | Final file |
|---|---|---|
| Filename | modeM0/AS1T02_012T06_9000001956cztM0_level2.fits | modeM0/AS1T02_012T06_9000001956cztM0_level2_quad_clean.evt |
| Size (bytes) | 42,675,840 | 27,538,560 |
| Size | 40.7 MB | 26.3 MB |
| Events in quadrant A | 276,386 | 144,485 |
| Events in quadrant B | 174,468 | 94,967 |
| Events in quadrant C | 277,372 | 139,518 |
| Events in quadrant D | 238,434 | 128,839 |
| Mode SS | |||
|---|---|---|---|
| Quadrant | BADHDUFLAG | Total packets | Discarded packets |
| A | 0 | 94 | 0 |
| B | 0 | 94 | 0 |
| C | 0 | 94 | 0 |
| D | 0 | 94 | 0 |
| Mode M0 | |||
|---|---|---|---|
| Quadrant | BADHDUFLAG | Total packets | Discarded packets |
| A | 0 | 9761 | 0 |
| B | 0 | 19015 | 0 |
| C | 0 | 9549 | 0 |
| D | 0 | 10433 | 0 |
| Mode M9 | |||
|---|---|---|---|
| Quadrant | BADHDUFLAG | Total packets | Discarded packets |
| A | 0 | 12 | 0 |
| B | 0 | 12 | 0 |
| C | 0 | 12 | 0 |
| D | 0 | 12 | 0 |
| Quadrant | Total seconds | Saturated seconds | Saturation percentage |
|---|---|---|---|
| A | 4625 | 41 | 0.886486% |
| B | 4625 | 2064 | 44.627027% |
| C | 4625 | 27 | 0.583784% |
| D | 4625 | 55 | 1.189189% |
Noise dominated data is calculated using 1-second bins in cleaned event files. If a bin has >2000 counts, and if more than 50% of those come from <1% of pixels, then it is considered to be noise-dominated and hence unusable.
| Quadrant | # 1 sec bins | Bins with >0 counts | Bins with >2000 counts | High rate bins dominated by noise | Noise dominated (total time) | Noise dominated (detector-on time) | Marked lightcurve |
|---|---|---|---|---|---|---|---|
| A | 5865 | 4625 | 0 | 0 | 0.00% | 0.00% |  |
| B | 5864 | 3652 | 0 | 0 | 0.00% | 0.00% |  |
| C | 5865 | 4625 | 0 | 0 | 0.00% | 0.00% |  |
| D | 5865 | 4625 | 0 | 0 | 0.00% | 0.00% |  |
Top three noisy pixels from each quadrant. If the there are fewer than three noisy pixels in the level2.evt file, extra rows are filled as -1
| Pixel properties | Quadrant properties | ||||||
|---|---|---|---|---|---|---|---|
| Quadrant | DetID | PixID | Counts | Sigma | Mean | Median | Sigma |
| A | 0 | 29 | 283 | 10.9 | 72 | 68 | 19.7 |
| A | 7 | 110 | 227 | 8.06 | 72 | 68 | 19.7 |
| A | 0 | 28 | 221 | 7.76 | 72 | 68 | 19.7 |
| B | 2 | 9 | 146 | 9.02 | 46 | 44 | 11.3 |
| B | 3 | 17 | 129 | 7.52 | 46 | 44 | 11.3 |
| B | 5 | 255 | 123 | 6.99 | 46 | 44 | 11.3 |
| C | 12 | 250 | 224 | 7.56 | 73 | 69 | 20.5 |
| C | 3 | 202 | 220 | 7.37 | 73 | 69 | 20.5 |
| C | 12 | 241 | 209 | 6.83 | 73 | 69 | 20.5 |
| D | 3 | 14 | 185 | 6.21 | 68 | 62 | 19.8 |
| D | 10 | 189 | 172 | 5.55 | 68 | 62 | 19.8 |
| D | 1 | 19 | 172 | 5.55 | 68 | 62 | 19.8 |
Histogram calculated using DETX and DETY for each event in the final _common_clean file
| Quadrant A | 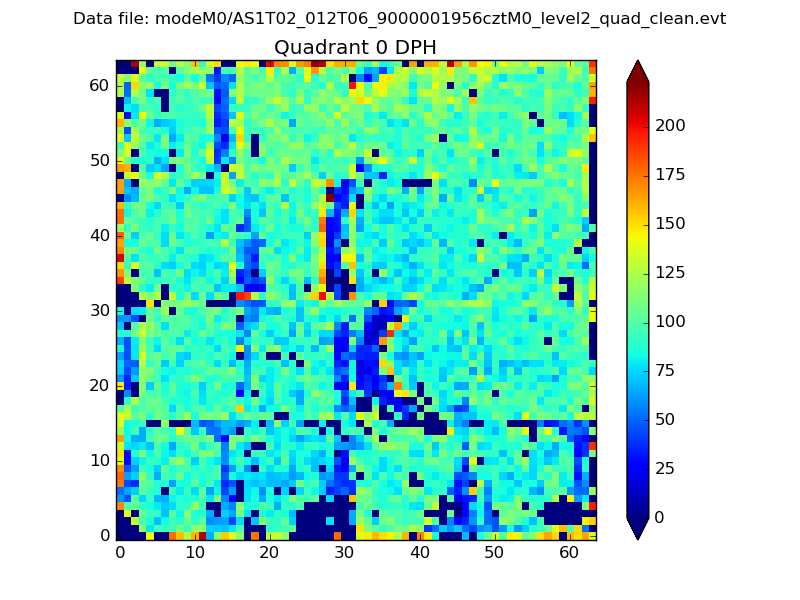 |
 |
Quadrant B |
|---|---|---|---|
| Quadrant D |  |
 |
Quadrant C |
| Plot type | Count rate plots | Images |
|---|---|---|
| Comparison with Poisson distribution Blue bars denote a histogram of data divided into 1 sec bins. Red curve is a Poisson curve with rate = median count rate of data. |
 |
 |
| Quadrant-wise count rates Data is divided into 100 sec bins |
 |
|
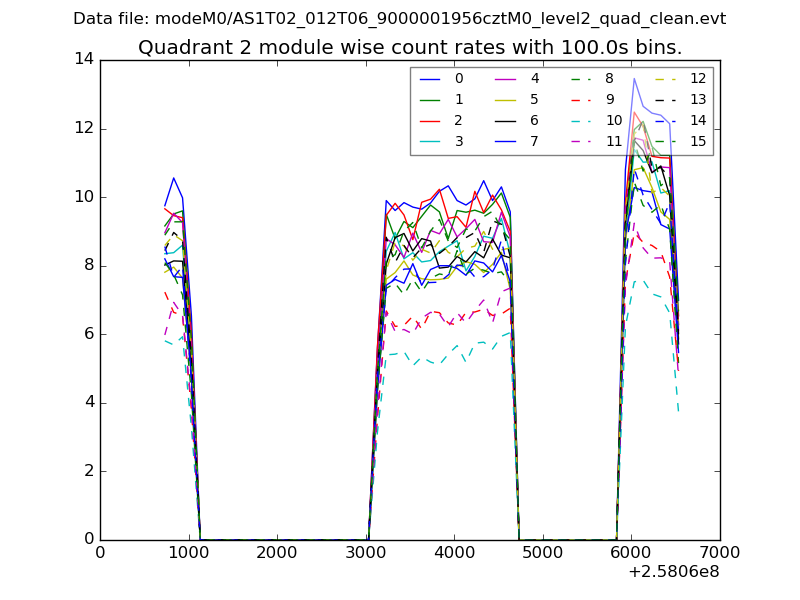
| Module-wise count rates for Quadrant A Data is divided into 100 sec bins |
 |
 |
| Module-wise count rates for Quadrant B Data is divided into 100 sec bins |
 |
 |
| Module-wise count rates for Quadrant C Data is divided into 100 sec bins |
 |
 |
| Module-wise count rates for Quadrant D Data is divided into 100 sec bins |
 |
 |
| Parameter | Plot |
|---|---|
| CZT HV Monitor |  |
| D_VDD | 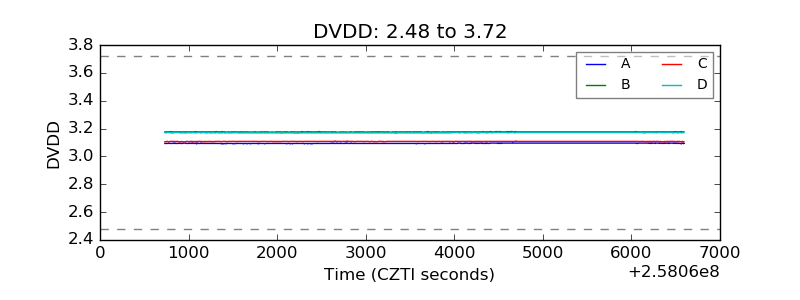 |
| Temperature 1 |  |
| Veto HV Monitor |  |
| Veto LLD |  |
| Alpha Counter |  |
| _CPM_Rate |  |
| CZT Counter |  |
| +2.5 Volts monitor |  |
| +5 Volts monitor |  |
| _ROLL_ROT |  |
| _Roll_DEC |  |
| _Roll_RA |  |
| Veto Counter |  |