| Param | Original file | Final file |
|---|---|---|
| Filename | modeM0/AS1T02_012T06_9000001956_13183cztM0_level2.evt | modeM0/AS1T02_012T06_9000001956_13183cztM0_level2_quad_clean.evt |
| Size (bytes) | 22,587,840 | 4,561,920 |
| Size | 21.5 MB | 4.4 MB |
| Events in quadrant A | 104,058 | 30,505 |
| Events in quadrant B | 326,395 | 23,147 |
| Events in quadrant C | 110,060 | 30,285 |
| Events in quadrant D | 124,362 | 29,180 |
| Mode SS | |||
|---|---|---|---|
| Quadrant | BADHDUFLAG | Total packets | Discarded packets |
| A | 0 | 4 | 0 |
| B | 0 | 4 | 0 |
| C | 0 | 4 | 0 |
| D | 0 | 4 | 0 |
| Mode M0 | |||
|---|---|---|---|
| Quadrant | BADHDUFLAG | Total packets | Discarded packets |
| A | 0 | 463 | 1 |
| B | 0 | 1123 | 0 |
| C | 0 | 471 | 0 |
| D | 0 | 517 | 0 |
| Quadrant | Total seconds | Saturated seconds | Saturation percentage |
|---|---|---|---|
| A | 231 | 0 | 0.000000% |
| B | 231 | 93 | 40.259740% |
| C | 231 | 0 | 0.000000% |
| D | 231 | 0 | 0.000000% |
Noise dominated data is calculated using 1-second bins in cleaned event files. If a bin has >2000 counts, and if more than 50% of those come from <1% of pixels, then it is considered to be noise-dominated and hence unusable.
| Quadrant | # 1 sec bins | Bins with >0 counts | Bins with >2000 counts | High rate bins dominated by noise | Noise dominated (total time) | Noise dominated (detector-on time) | Marked lightcurve |
|---|---|---|---|---|---|---|---|
| A | 232 | 232 | 0 | 0 | 0.00% | 0.00% | 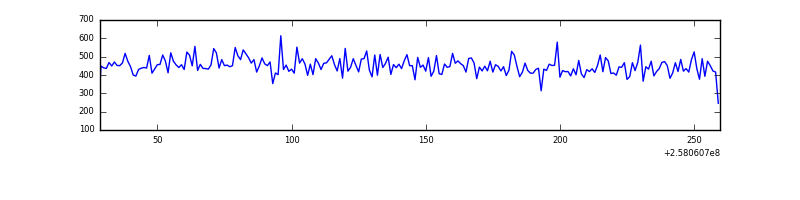 |
| B | 232 | 232 | 64 | 64 | 27.59% | 27.59% | 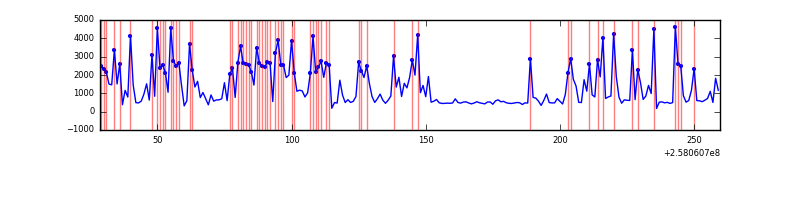 |
| C | 232 | 232 | 0 | 0 | 0.00% | 0.00% | 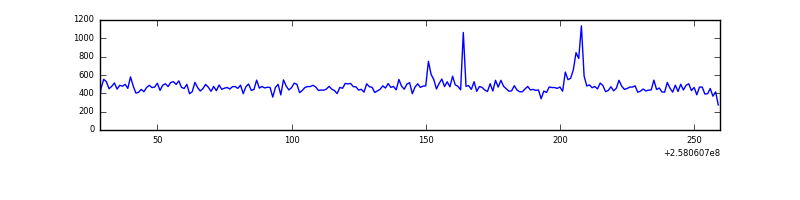 |
| D | 232 | 232 | 0 | 0 | 0.00% | 0.00% | 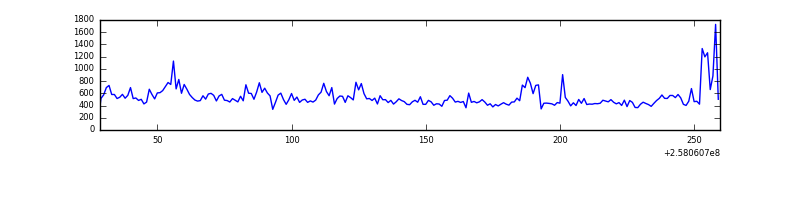 |
Top three noisy pixels from each quadrant. If the there are fewer than three noisy pixels in the level2.evt file, extra rows are filled as -1
| Pixel properties | Quadrant properties | ||||||
|---|---|---|---|---|---|---|---|
| Quadrant | DetID | PixID | Counts | Sigma | Mean | Median | Sigma |
| A | 15 | 239 | 241 | 28.66 | 26 | 26 | 7.5 |
| A | 0 | 226 | 221 | 25.99 | 26 | 26 | 7.5 |
| A | 12 | 194 | 197 | 22.79 | 26 | 26 | 7.5 |
| B | 4 | 239 | 240264 | 40805.52 | 20 | 20 | 5.9 |
| B | 0 | 214 | 2599 | 438.04 | 20 | 20 | 5.9 |
| B | 0 | 189 | 2046 | 344.12 | 20 | 20 | 5.9 |
| C | 15 | 208 | 4101 | 490.83 | 27 | 27 | 8.3 |
| C | 13 | 61 | 180 | 18.43 | 27 | 27 | 8.3 |
| C | 12 | 4 | 130 | 12.41 | 27 | 27 | 8.3 |
| D | 13 | 122 | 15640 | 1896.84 | 26 | 25 | 8.2 |
| D | 1 | 52 | 5082 | 614.3 | 26 | 25 | 8.2 |
| D | 14 | 34 | 1766 | 211.49 | 26 | 25 | 8.2 |
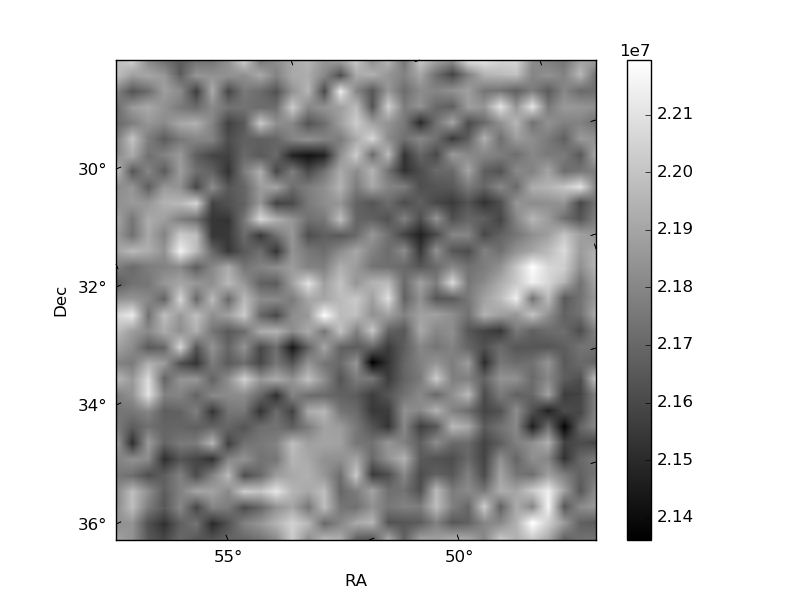
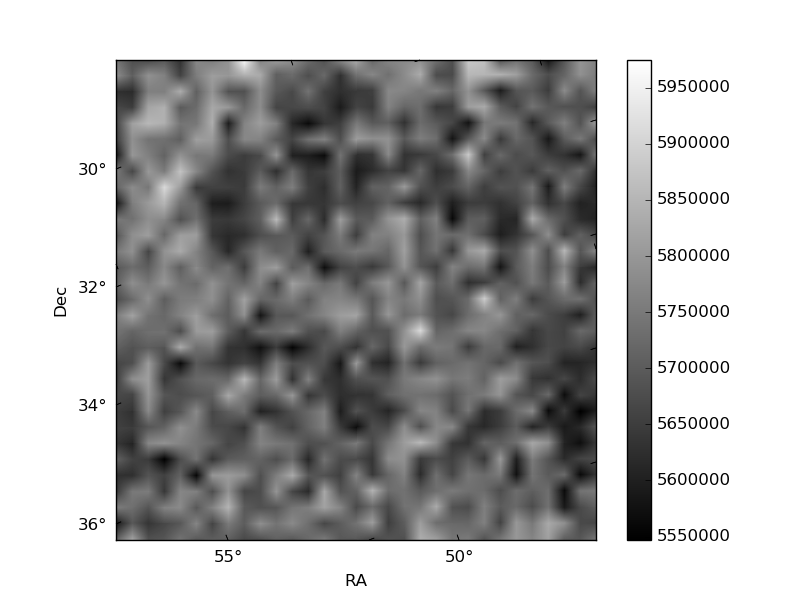
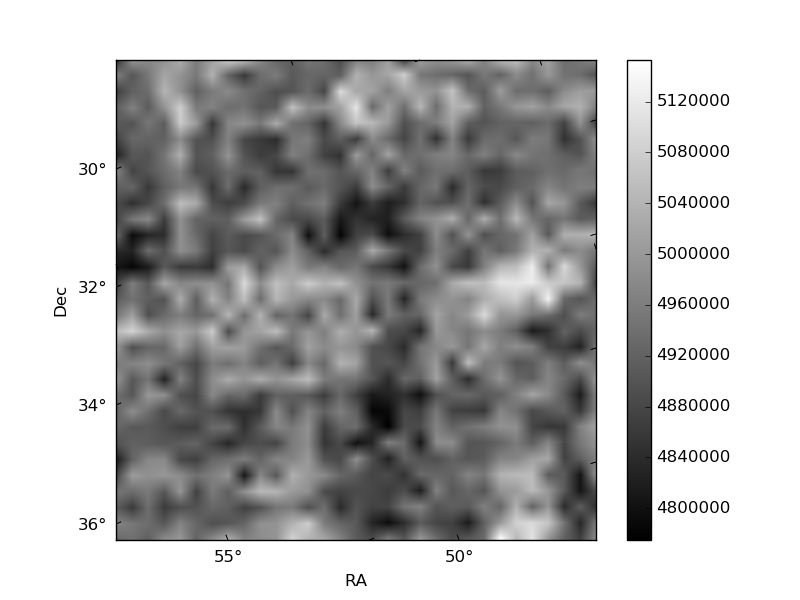
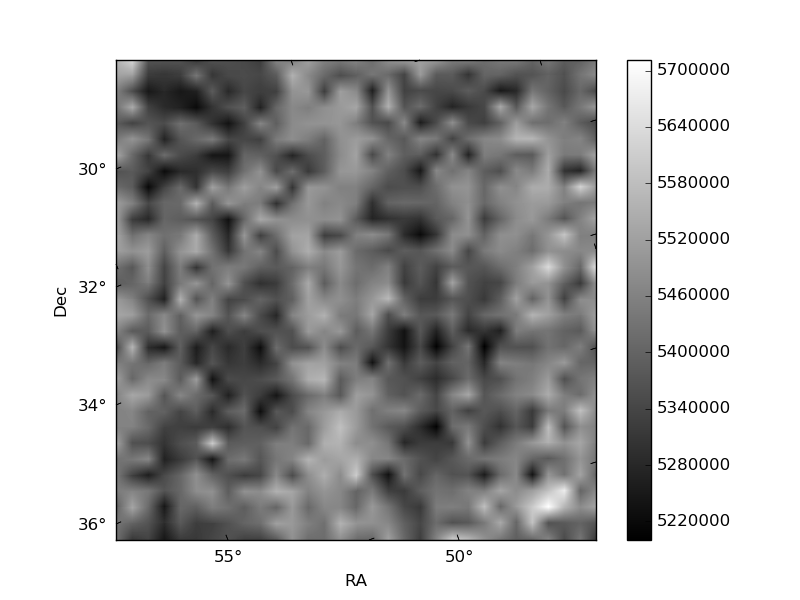
Histogram calculated using DETX and DETY for each event in the final _common_clean file
| Quadrant A | 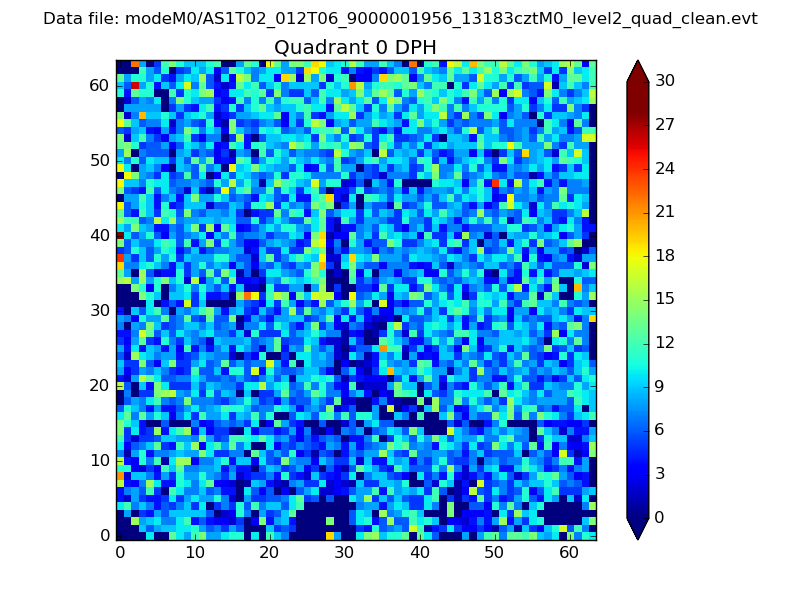 |
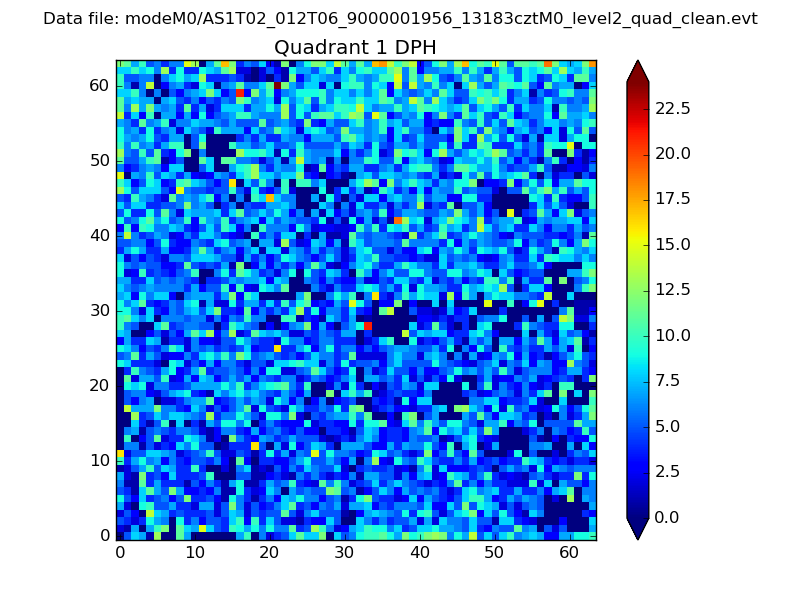 |
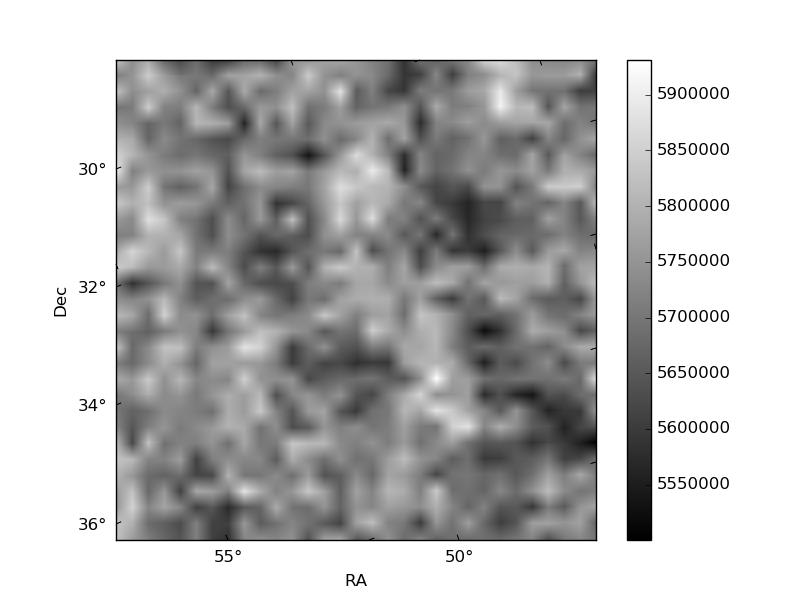
Quadrant B |
|---|---|---|---|
| Quadrant D | 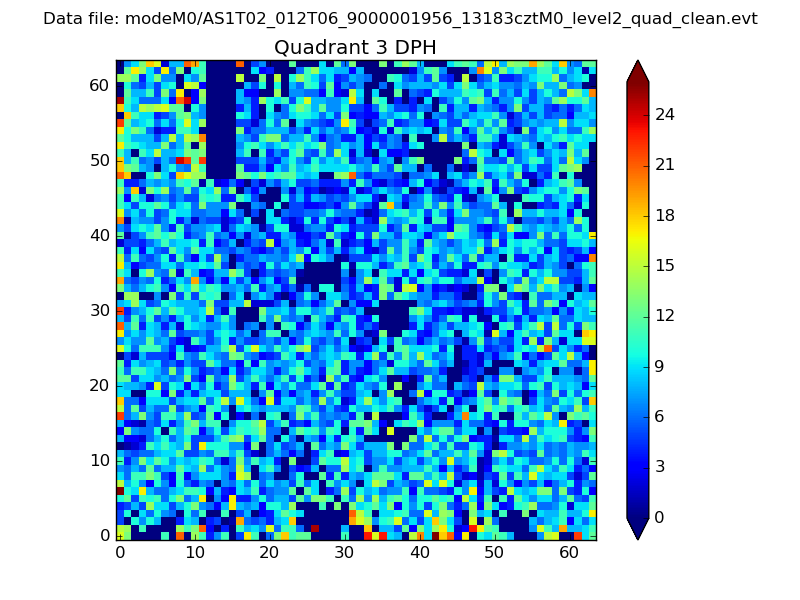 |
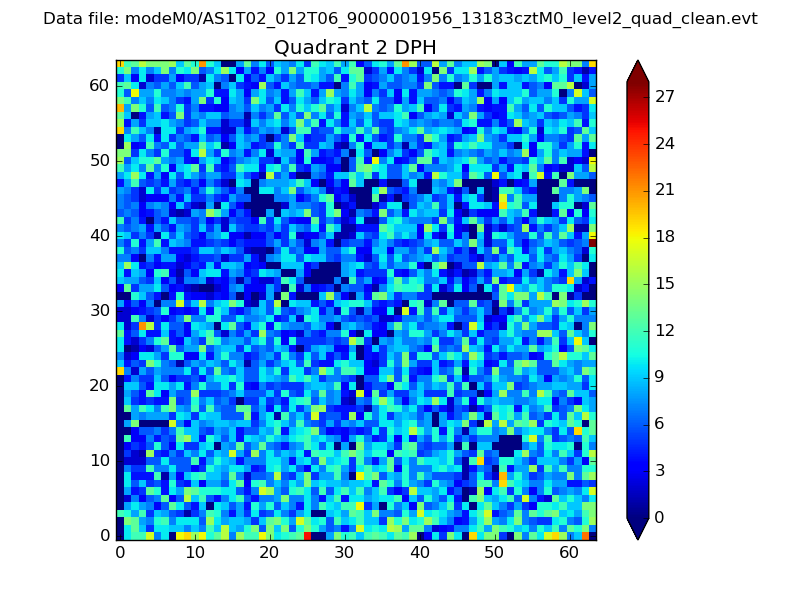 |
Quadrant C |
| Plot type | Count rate plots | Images |
|---|---|---|
| Comparison with Poisson distribution Blue bars denote a histogram of data divided into 1 sec bins. Red curve is a Poisson curve with rate = median count rate of data. |
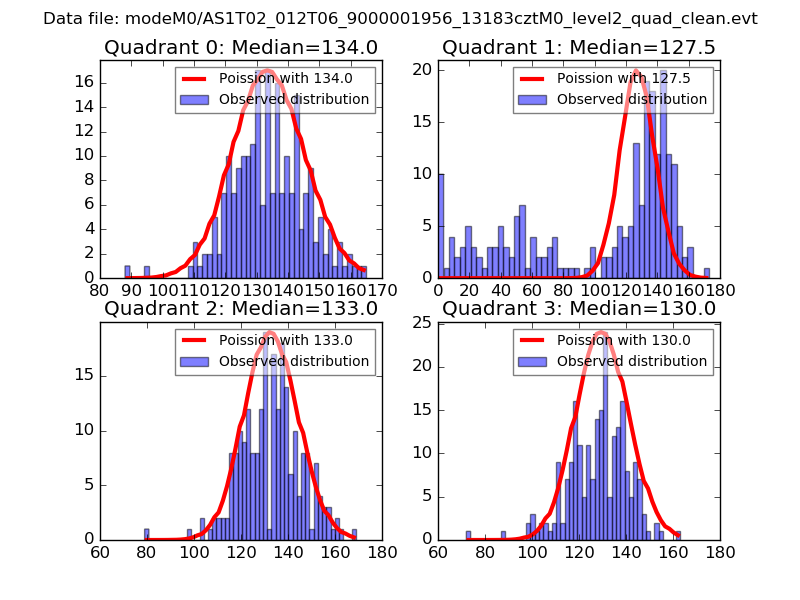 |
 |
| Quadrant-wise count rates Data is divided into 100 sec bins |
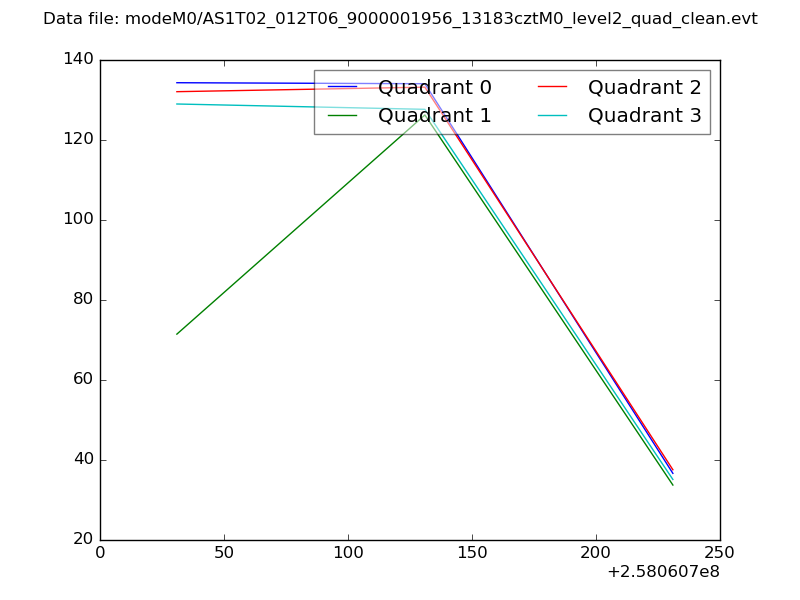 |
|
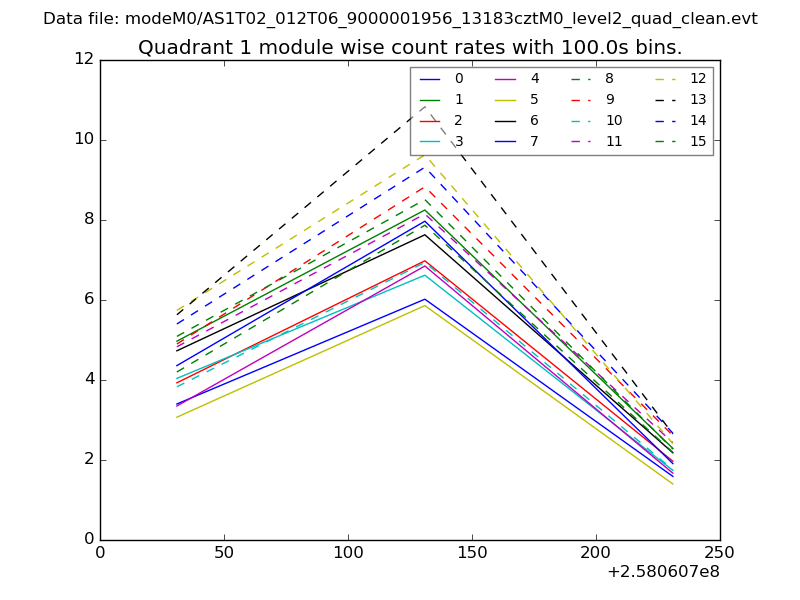
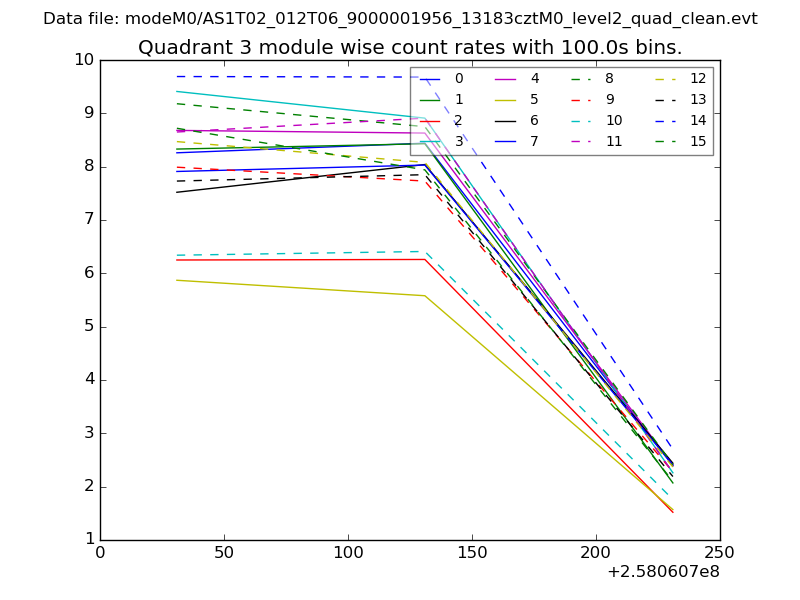
| Module-wise count rates for Quadrant A Data is divided into 100 sec bins |
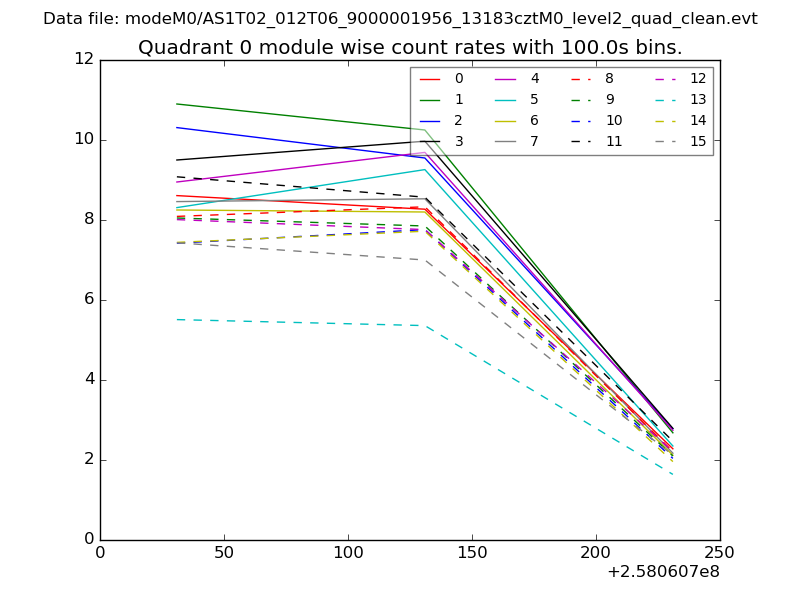 |
 |
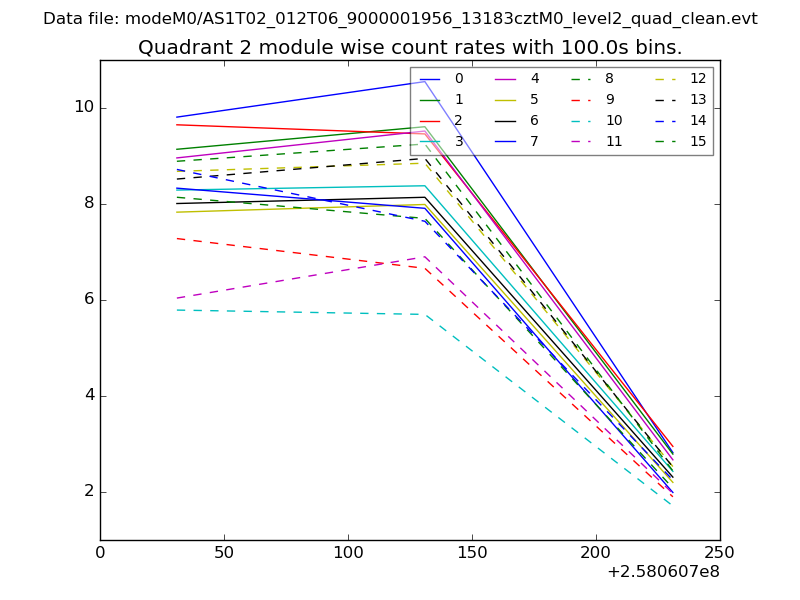
| Module-wise count rates for Quadrant B Data is divided into 100 sec bins |
 |
 |
| Module-wise count rates for Quadrant C Data is divided into 100 sec bins |
 |
 |
| Module-wise count rates for Quadrant D Data is divided into 100 sec bins |
 |
 |
| Parameter | Plot |
|---|---|
| CZT HV Monitor | 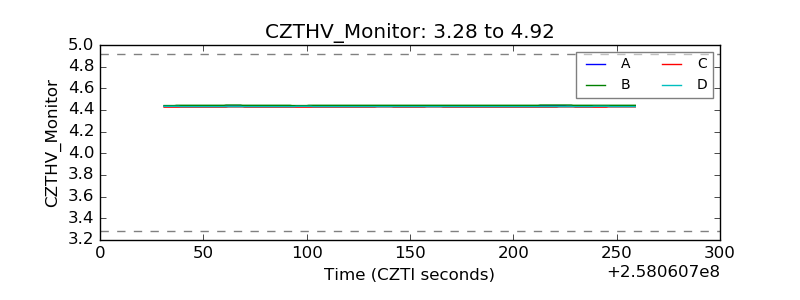 |
| D_VDD | 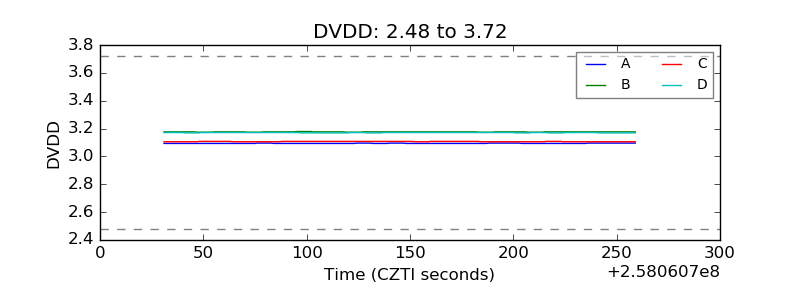 |
| Temperature 1 | 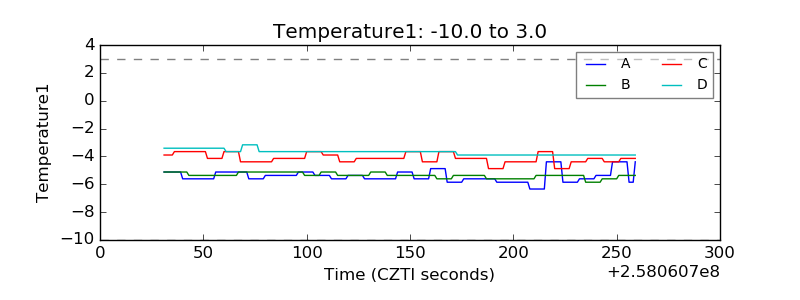 |
| Veto HV Monitor | 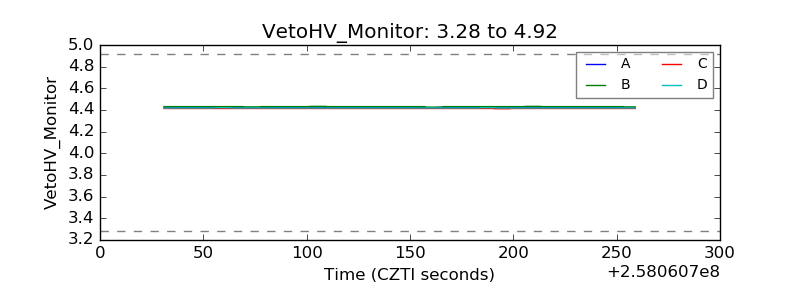 |
| Veto LLD | 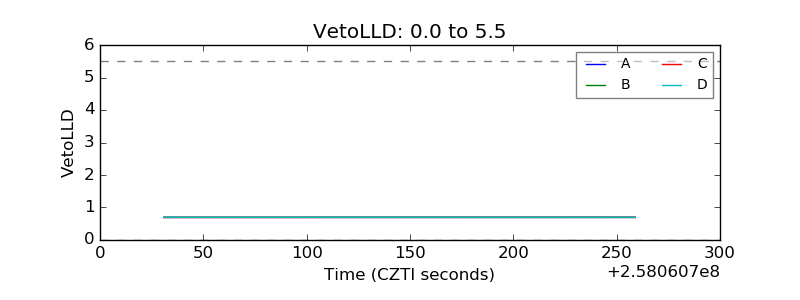 |
| Alpha Counter | 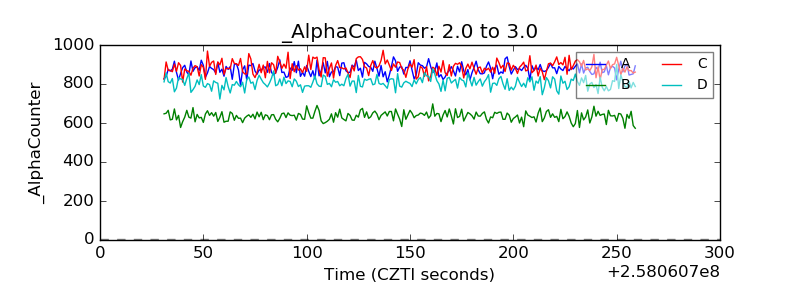 |
| _CPM_Rate | 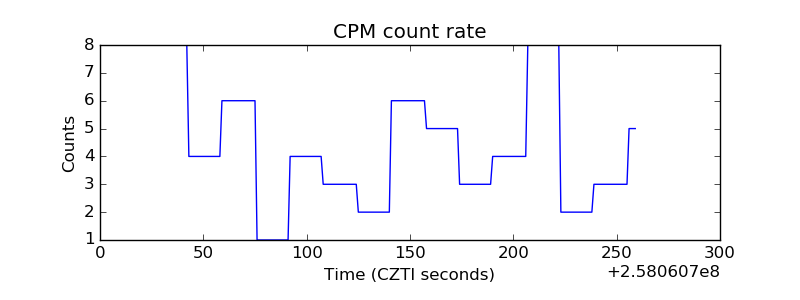 |
| CZT Counter | 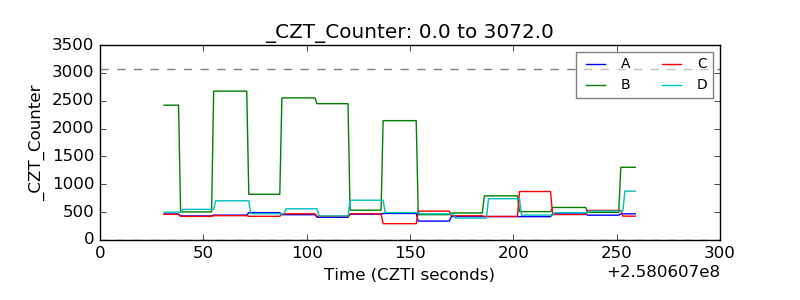 |
| +2.5 Volts monitor |  |
| +5 Volts monitor |  |
| _ROLL_ROT | 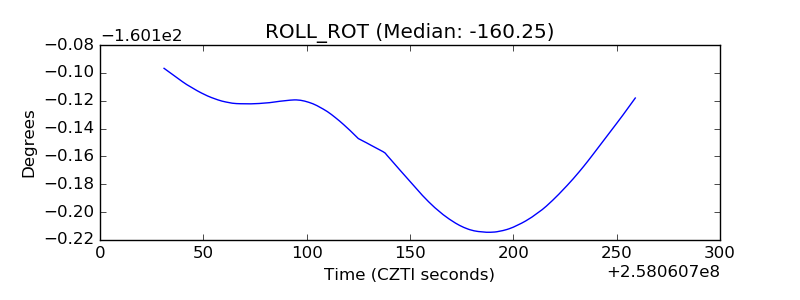 |
| _Roll_DEC | 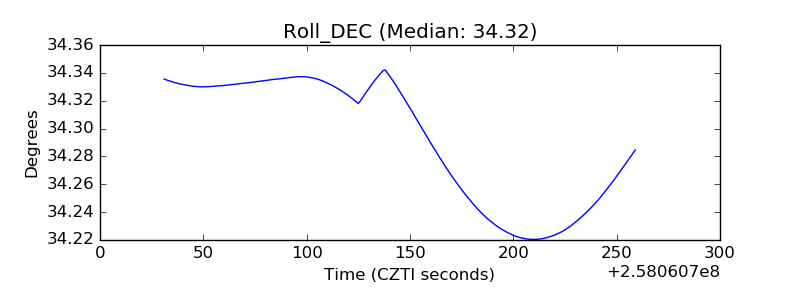 |
| _Roll_RA | 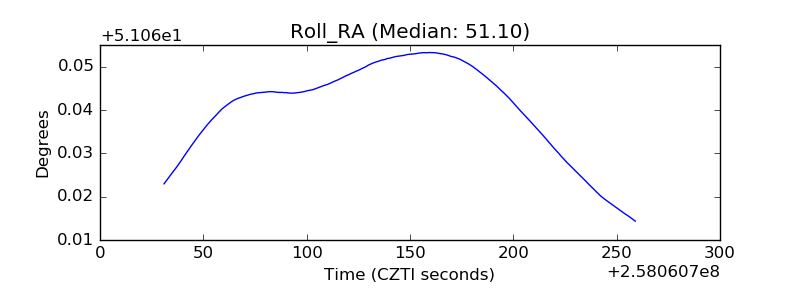 |
| Veto Counter | 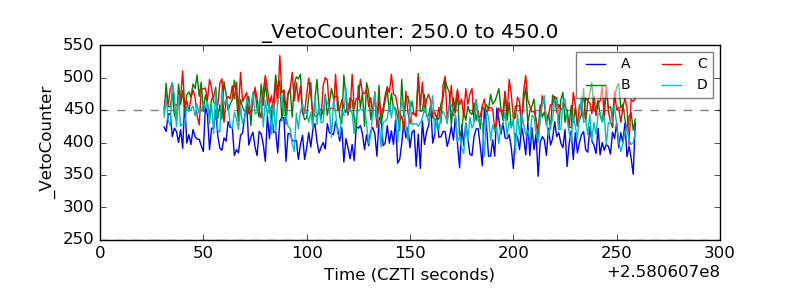 |