| Param | Original file | Final file |
|---|---|---|
| Filename | modeM0/AS1T02_012T06_9000001956_13184cztM0_level2.evt | modeM0/AS1T02_012T06_9000001956_13184cztM0_level2_quad_clean.evt |
| Size (bytes) | 412,456,320 | 54,786,240 |
| Size | 393.3 MB | 52.2 MB |
| Events in quadrant A | 2,261,590 | 353,152 |
| Events in quadrant B | 5,349,443 | 288,047 |
| Events in quadrant C | 2,160,744 | 356,675 |
| Events in quadrant D | 2,403,851 | 335,539 |
| Mode SS | |||
|---|---|---|---|
| Quadrant | BADHDUFLAG | Total packets | Discarded packets |
| A | 0 | 94 | 0 |
| B | 0 | 94 | 0 |
| C | 0 | 94 | 0 |
| D | 0 | 94 | 0 |
| Mode M0 | |||
|---|---|---|---|
| Quadrant | BADHDUFLAG | Total packets | Discarded packets |
| A | 0 | 9762 | 1 |
| B | 0 | 19016 | 1 |
| C | 0 | 9550 | 1 |
| D | 0 | 10434 | 1 |
| Mode M9 | |||
|---|---|---|---|
| Quadrant | BADHDUFLAG | Total packets | Discarded packets |
| A | 0 | 12 | 0 |
| B | 0 | 12 | 0 |
| C | 0 | 12 | 0 |
| D | 0 | 12 | 0 |
| Quadrant | Total seconds | Saturated seconds | Saturation percentage |
|---|---|---|---|
| A | 4625 | 41 | 0.886486% |
| B | 4625 | 2064 | 44.627027% |
| C | 4625 | 27 | 0.583784% |
| D | 4625 | 55 | 1.189189% |
Noise dominated data is calculated using 1-second bins in cleaned event files. If a bin has >2000 counts, and if more than 50% of those come from <1% of pixels, then it is considered to be noise-dominated and hence unusable.
| Quadrant | # 1 sec bins | Bins with >0 counts | Bins with >2000 counts | High rate bins dominated by noise | Noise dominated (total time) | Noise dominated (detector-on time) | Marked lightcurve |
|---|---|---|---|---|---|---|---|
| A | 5866 | 4627 | 8 | 8 | 0.14% | 0.17% | 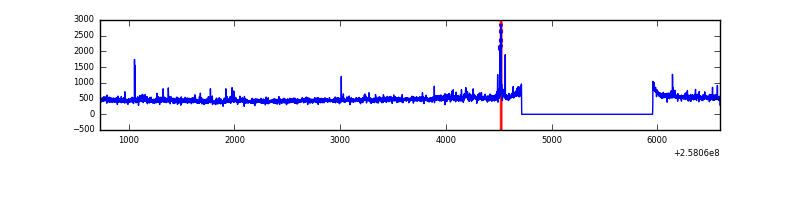 |
| B | 5866 | 4627 | 975 | 975 | 16.62% | 21.07% | 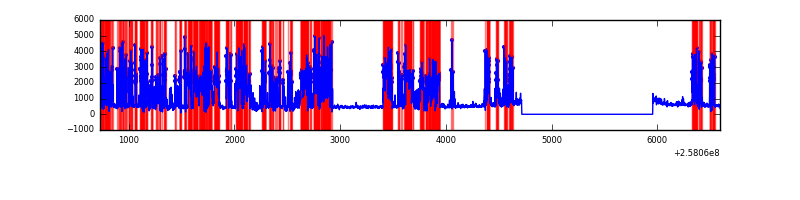 |
| C | 5866 | 4627 | 0 | 0 | 0.00% | 0.00% | 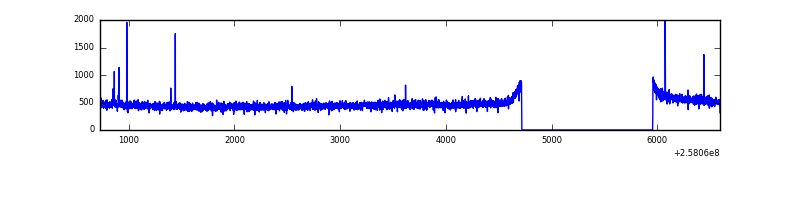 |
| D | 5866 | 4627 | 17 | 17 | 0.29% | 0.37% | 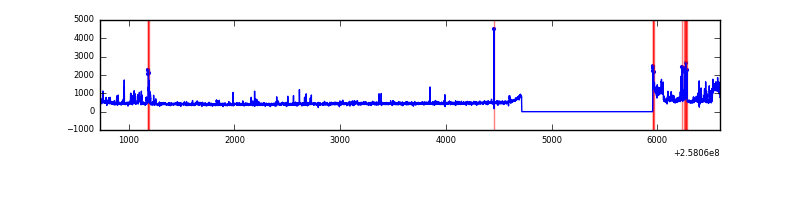 |
Top three noisy pixels from each quadrant. If the there are fewer than three noisy pixels in the level2.evt file, extra rows are filled as -1
| Pixel properties | Quadrant properties | ||||||
|---|---|---|---|---|---|---|---|
| Quadrant | DetID | PixID | Counts | Sigma | Mean | Median | Sigma |
| A | 12 | 189 | 50181 | 439.97 | 557 | 546 | 112.8 |
| A | 4 | 2 | 39439 | 344.75 | 557 | 546 | 112.8 |
| A | 1 | 162 | 8956 | 74.55 | 557 | 546 | 112.8 |
| B | 4 | 239 | 3815249 | 52738.08 | 377 | 369 | 72.3 |
| B | 0 | 214 | 18039 | 244.28 | 377 | 369 | 72.3 |
| B | 0 | 189 | 12968 | 174.17 | 377 | 369 | 72.3 |
| C | 15 | 208 | 11023 | 82.12 | 550 | 553 | 127.5 |
| C | 13 | 61 | 3937 | 26.54 | 550 | 553 | 127.5 |
| C | 14 | 234 | 3760 | 25.15 | 550 | 553 | 127.5 |
| D | 13 | 122 | 211659 | 1627.79 | 541 | 526 | 129.7 |
| D | 1 | 52 | 50796 | 387.57 | 541 | 526 | 129.7 |
| D | 14 | 34 | 34306 | 260.44 | 541 | 526 | 129.7 |
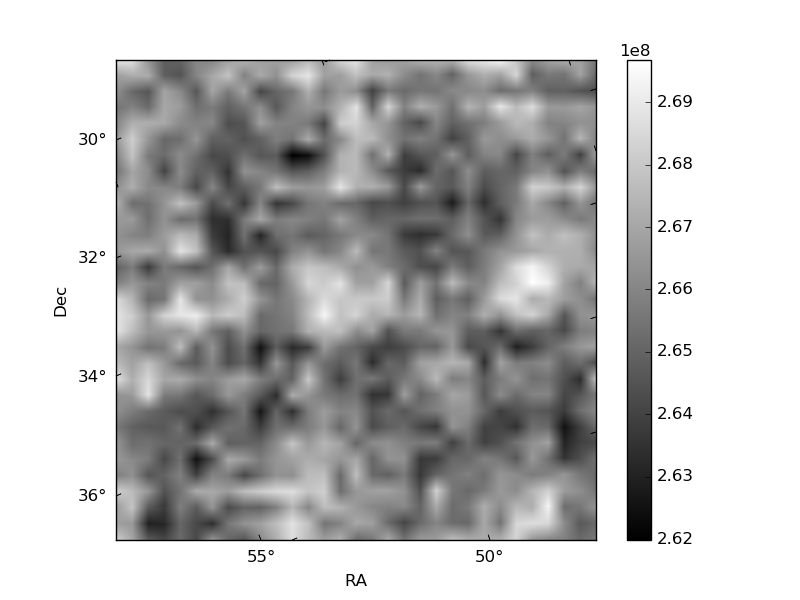
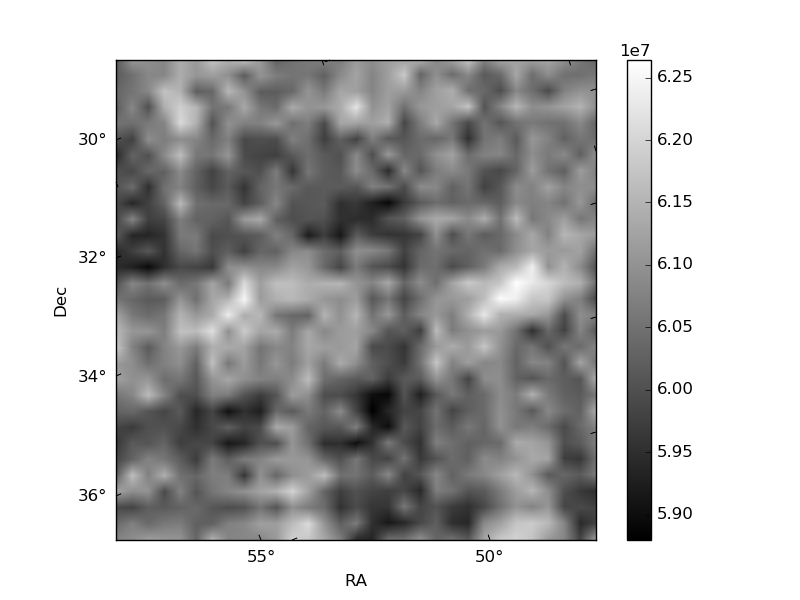
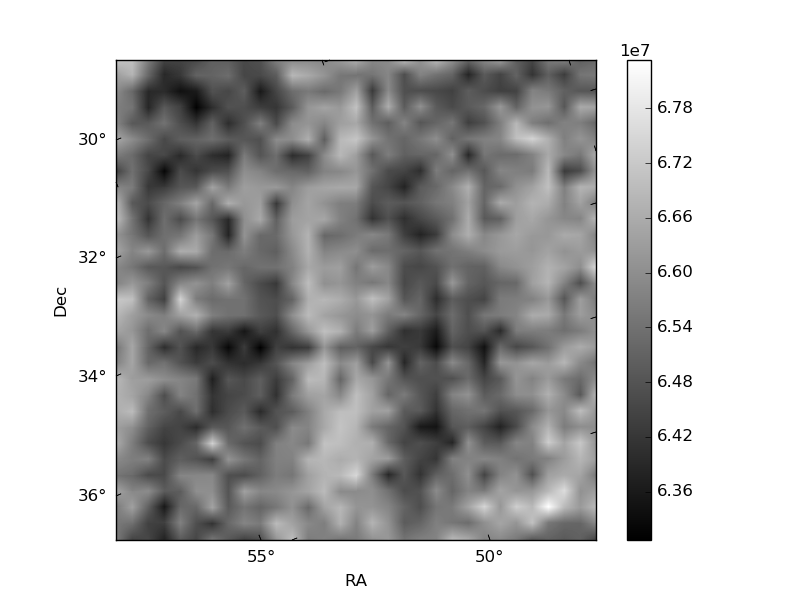
Histogram calculated using DETX and DETY for each event in the final _common_clean file
| Quadrant A | 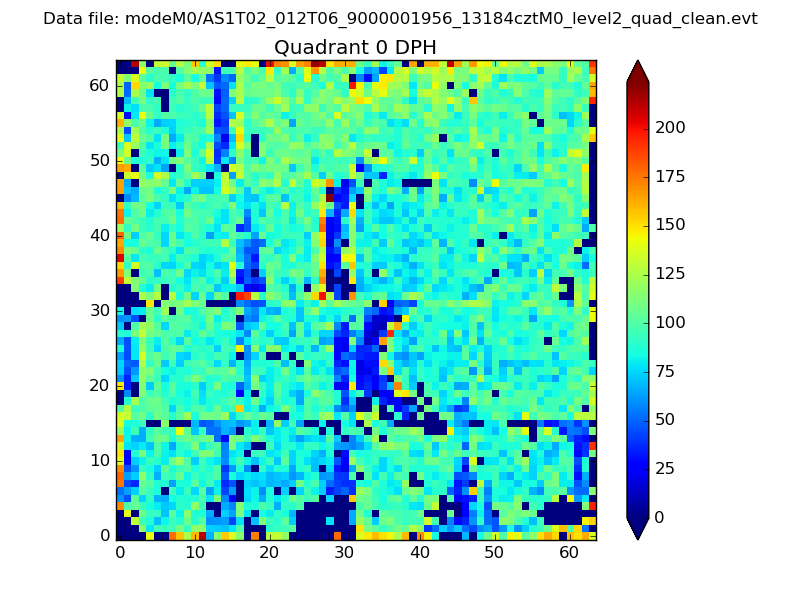 |
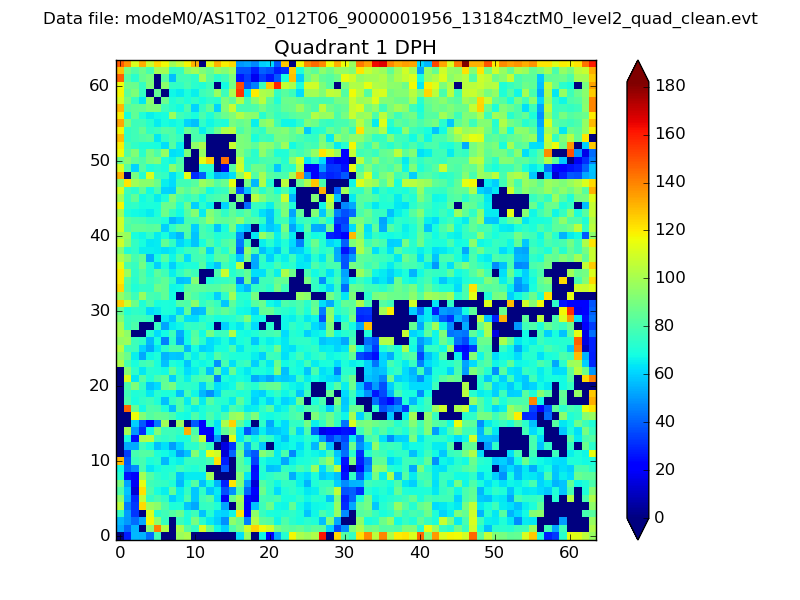 |
Quadrant B |
|---|---|---|---|
| Quadrant D | 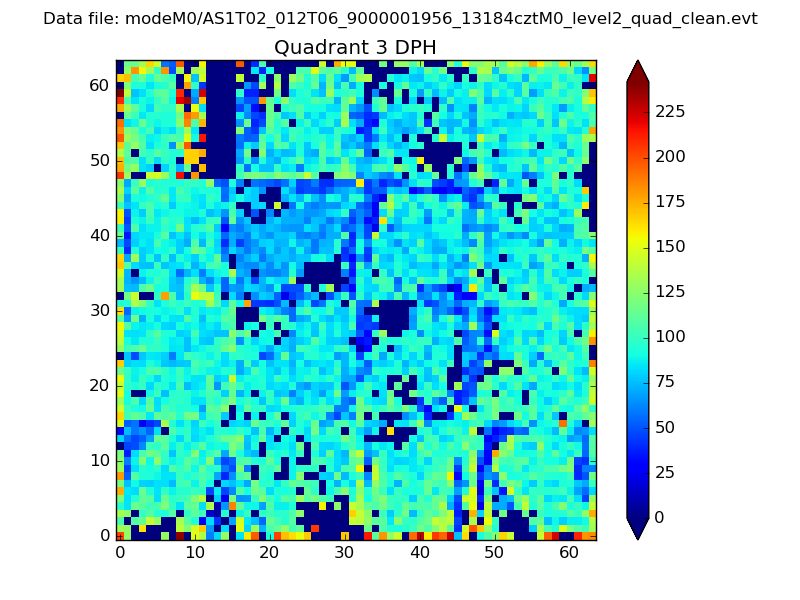 |
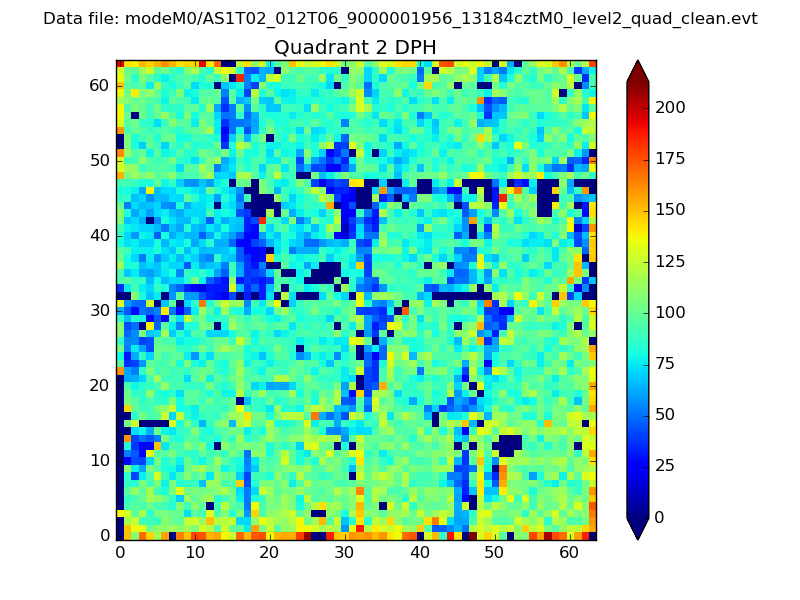 |
Quadrant C |
| Plot type | Count rate plots | Images |
|---|---|---|
| Comparison with Poisson distribution Blue bars denote a histogram of data divided into 1 sec bins. Red curve is a Poisson curve with rate = median count rate of data. |
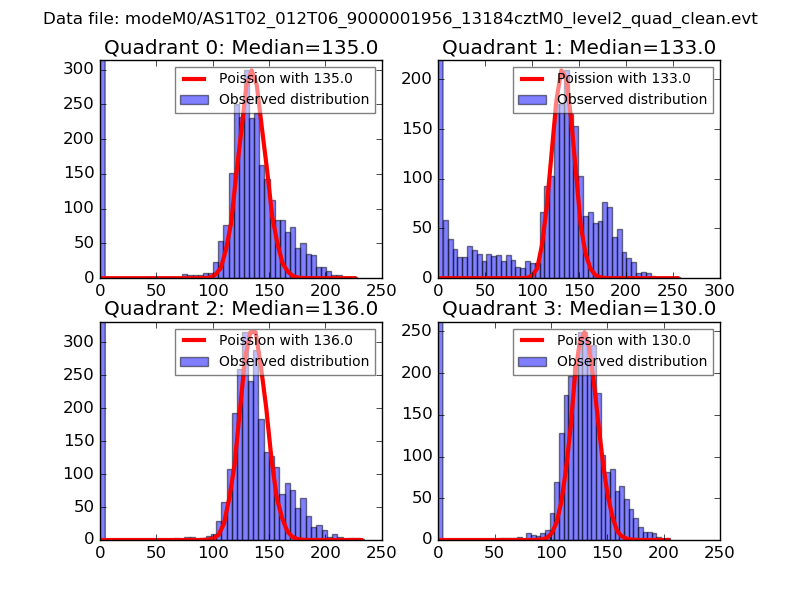 |
 |
| Quadrant-wise count rates Data is divided into 100 sec bins |
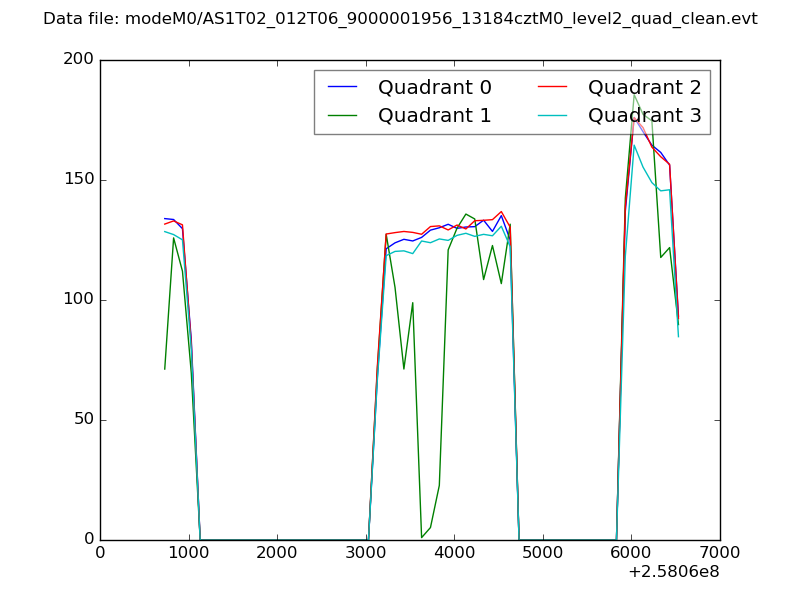 |
|
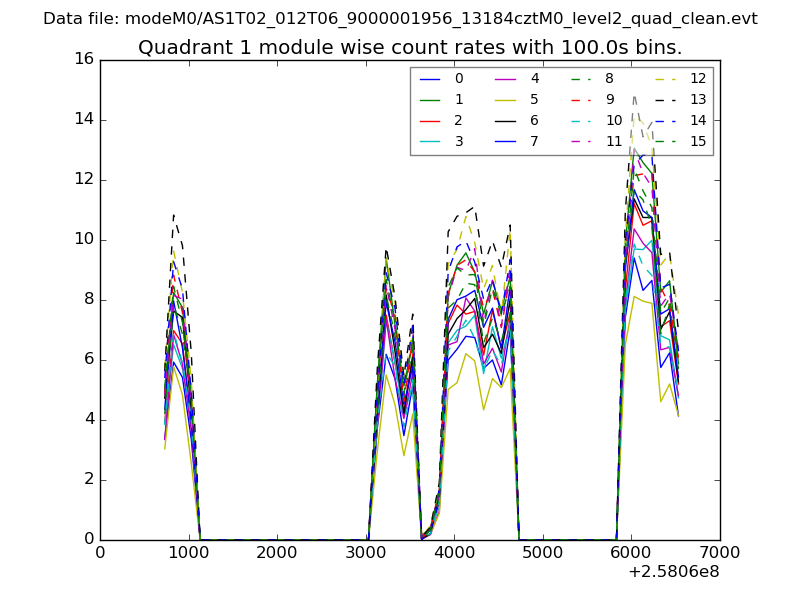
| Module-wise count rates for Quadrant A Data is divided into 100 sec bins |
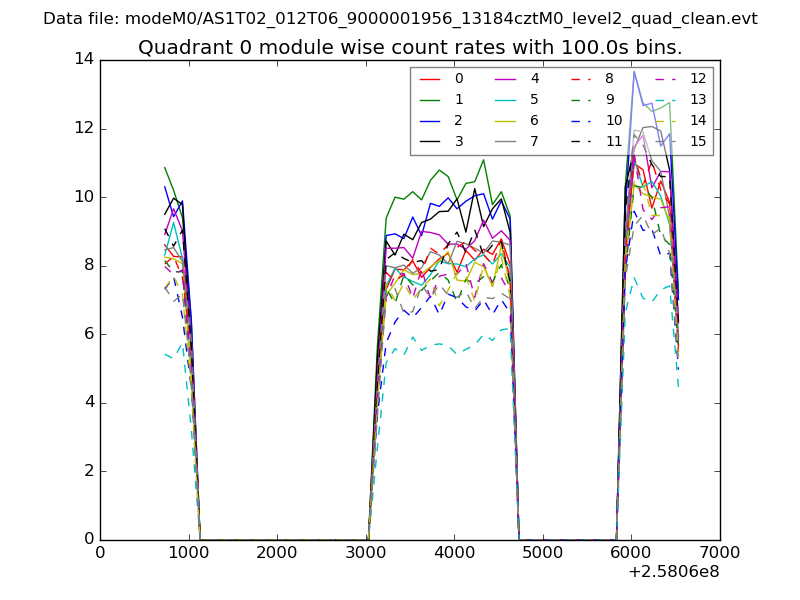 |
 |
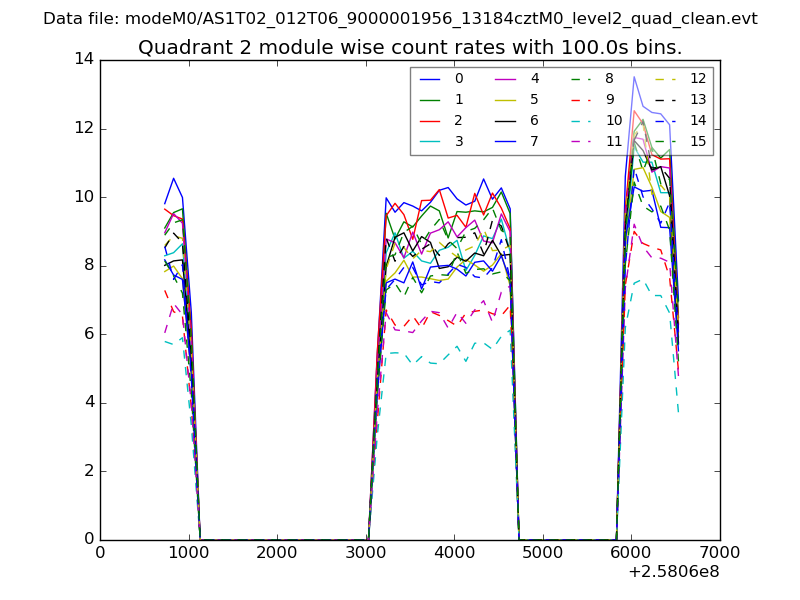
| Module-wise count rates for Quadrant B Data is divided into 100 sec bins |
 |
 |
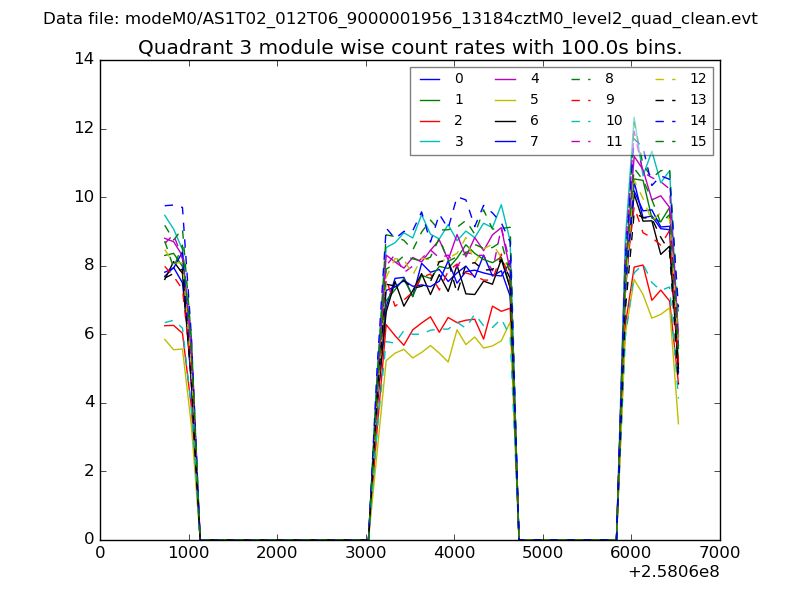
| Module-wise count rates for Quadrant C Data is divided into 100 sec bins |
 |
 |
| Module-wise count rates for Quadrant D Data is divided into 100 sec bins |
 |
 |
| Parameter | Plot |
|---|---|
| CZT HV Monitor | 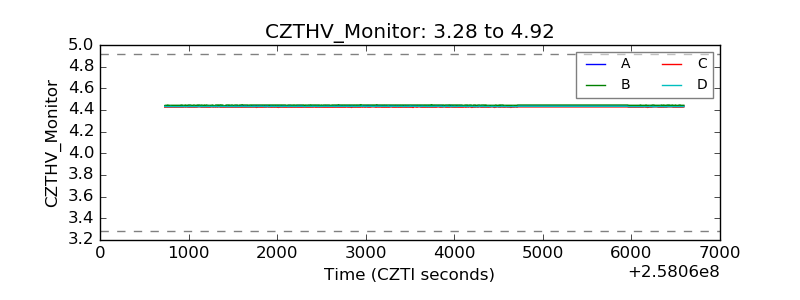 |
| D_VDD | 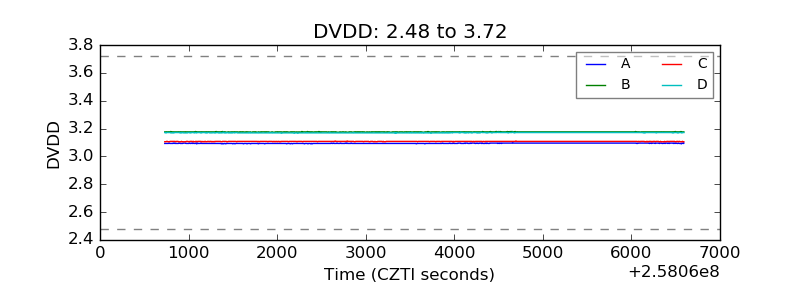 |
| Temperature 1 | 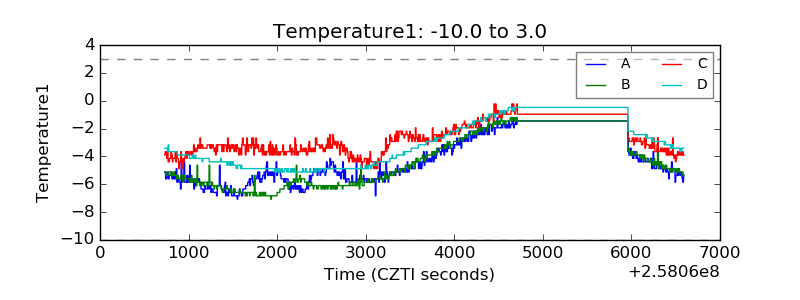 |
| Veto HV Monitor | 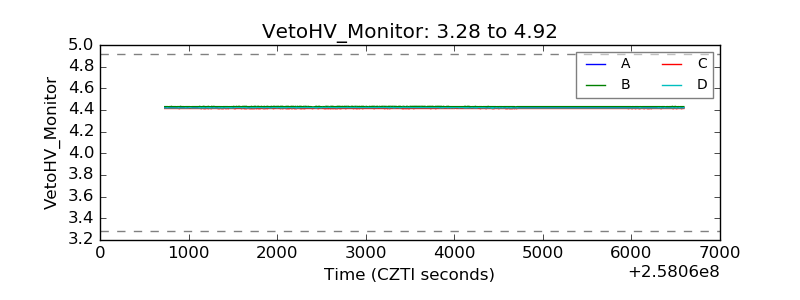 |
| Veto LLD | 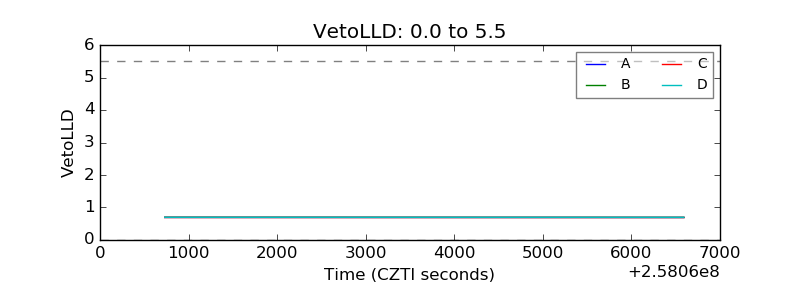 |
| Alpha Counter | 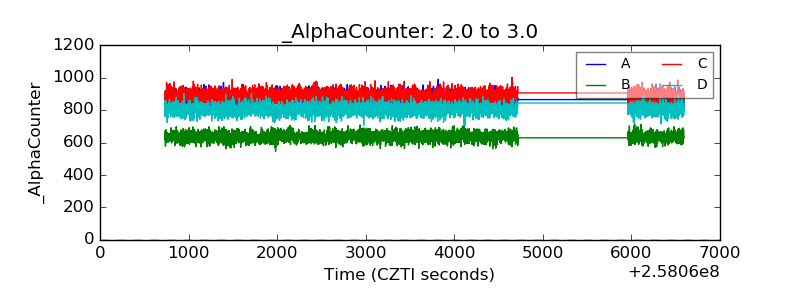 |
| _CPM_Rate | 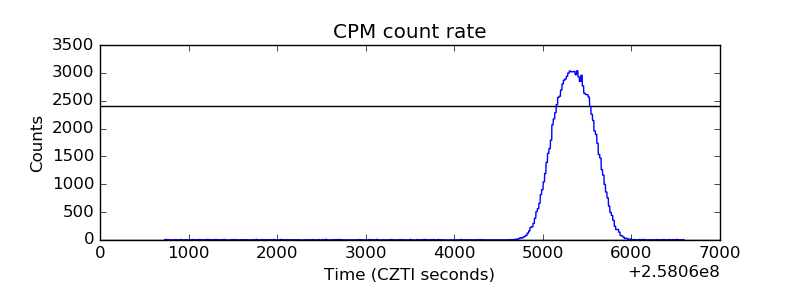 |
| CZT Counter | 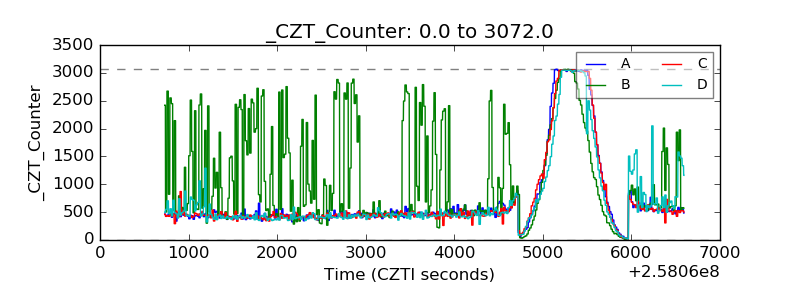 |
| +2.5 Volts monitor | 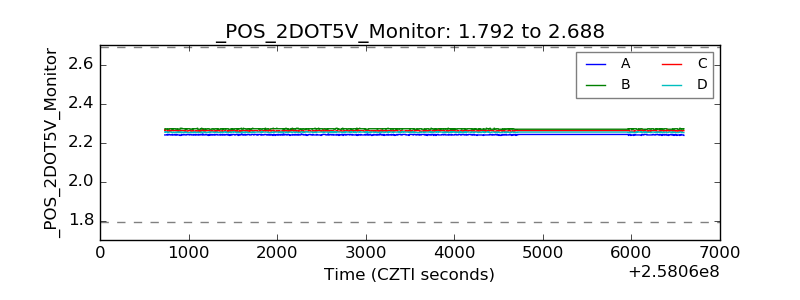 |
| +5 Volts monitor |  |
| _ROLL_ROT | 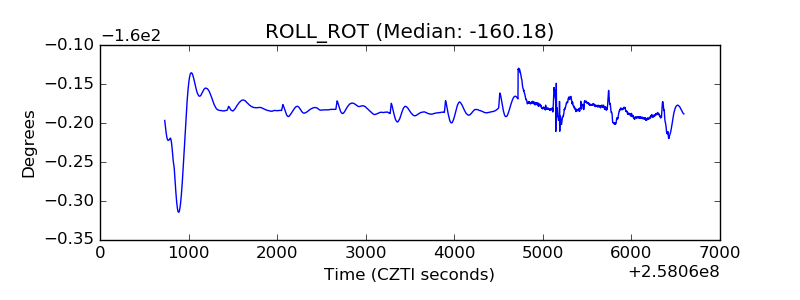 |
| _Roll_DEC | 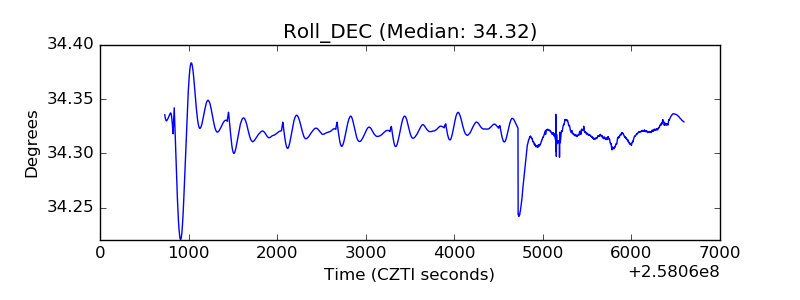 |
| _Roll_RA | 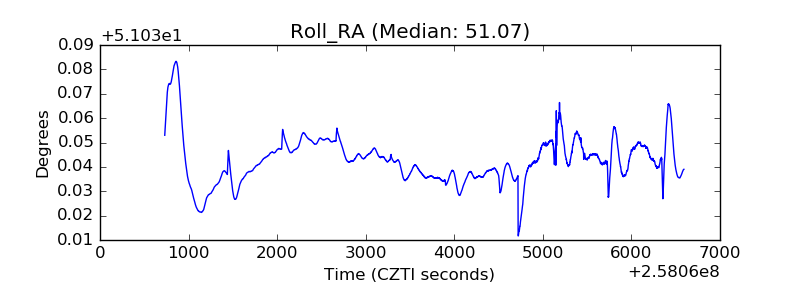 |
| Veto Counter | 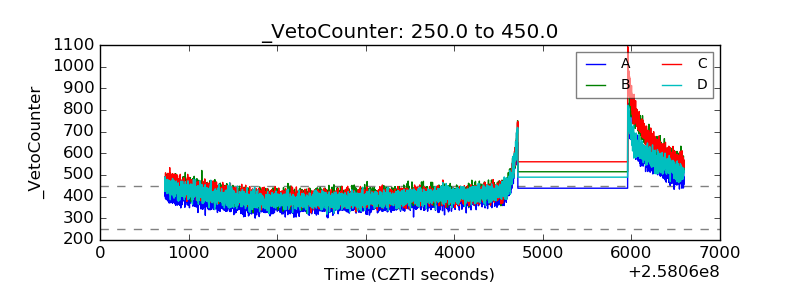 |