| Param | Original file | Final file |
|---|---|---|
| Filename | modeM0/AS1T02_012T06_9000001956_13185cztM0_level2.evt | modeM0/AS1T02_012T06_9000001956_13185cztM0_level2_quad_clean.evt |
| Size (bytes) | 63,077,760 | 15,261,120 |
| Size | 60.2 MB | 14.6 MB |
| Events in quadrant A | 368,837 | 105,830 |
| Events in quadrant B | 565,900 | 100,919 |
| Events in quadrant C | 367,476 | 106,109 |
| Events in quadrant D | 561,810 | 96,790 |
| Mode SS | |||
|---|---|---|---|
| Quadrant | BADHDUFLAG | Total packets | Discarded packets |
| A | 0 | 12 | 0 |
| B | 0 | 12 | 0 |
| C | 0 | 12 | 0 |
| D | 0 | 12 | 0 |
| Mode M0 | |||
|---|---|---|---|
| Quadrant | BADHDUFLAG | Total packets | Discarded packets |
| A | 0 | 1469 | 1 |
| B | 0 | 2132 | 1 |
| C | 0 | 1469 | 1 |
| D | 0 | 2128 | 1 |
| Mode M9 | |||
|---|---|---|---|
| Quadrant | BADHDUFLAG | Total packets | Discarded packets |
| A | 0 | 4 | 0 |
| B | 0 | 4 | 0 |
| C | 0 | 4 | 0 |
| D | 0 | 5 | 0 |
| Quadrant | Total seconds | Saturated seconds | Saturation percentage |
|---|---|---|---|
| A | 636 | 8 | 1.257862% |
| B | 636 | 99 | 15.566038% |
| C | 636 | 6 | 0.943396% |
| D | 636 | 30 | 4.716981% |
Noise dominated data is calculated using 1-second bins in cleaned event files. If a bin has >2000 counts, and if more than 50% of those come from <1% of pixels, then it is considered to be noise-dominated and hence unusable.
| Quadrant | # 1 sec bins | Bins with >0 counts | Bins with >2000 counts | High rate bins dominated by noise | Noise dominated (total time) | Noise dominated (detector-on time) | Marked lightcurve |
|---|---|---|---|---|---|---|---|
| A | 637 | 637 | 0 | 0 | 0.00% | 0.00% | 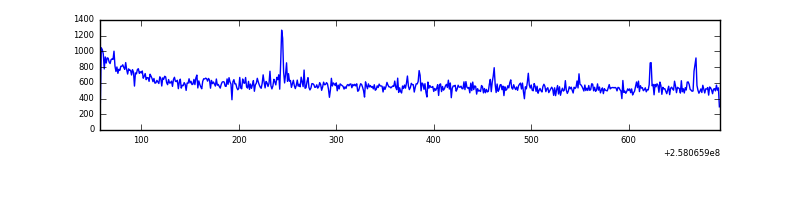 |
| B | 637 | 637 | 55 | 55 | 8.63% | 8.63% | 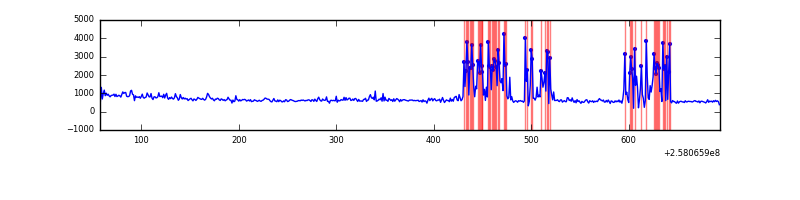 |
| C | 637 | 637 | 0 | 0 | 0.00% | 0.00% | 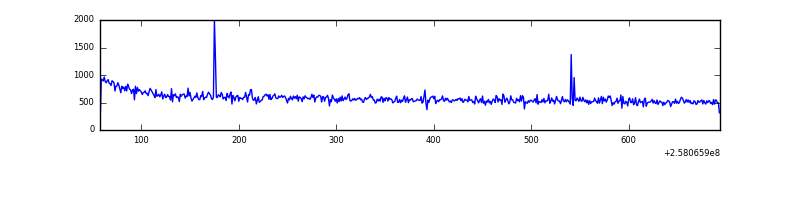 |
| D | 637 | 637 | 12 | 12 | 1.88% | 1.88% | 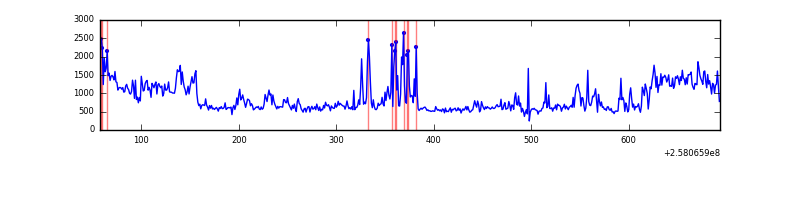 |
Top three noisy pixels from each quadrant. If the there are fewer than three noisy pixels in the level2.evt file, extra rows are filled as -1
| Pixel properties | Quadrant properties | ||||||
|---|---|---|---|---|---|---|---|
| Quadrant | DetID | PixID | Counts | Sigma | Mean | Median | Sigma |
| A | 2 | 79 | 4614 | 218.75 | 93 | 91 | 20.7 |
| A | 13 | 248 | 2300 | 106.83 | 93 | 91 | 20.7 |
| A | 0 | 226 | 891 | 38.69 | 93 | 91 | 20.7 |
| B | 4 | 239 | 197330 | 10675.72 | 87 | 86 | 18.5 |
| B | 0 | 189 | 10358 | 555.97 | 87 | 86 | 18.5 |
| B | 0 | 219 | 5572 | 296.93 | 87 | 86 | 18.5 |
| C | 14 | 234 | 2606 | 106.86 | 93 | 94 | 23.5 |
| C | 13 | 61 | 674 | 24.67 | 93 | 94 | 23.5 |
| C | -1 | -1 | -1 | -1.0 | 93 | 94 | 23.5 |
| D | 13 | 122 | 157012 | 6726.11 | 90 | 87 | 23.3 |
| D | 14 | 34 | 31945 | 1365.5 | 90 | 87 | 23.3 |
| D | 12 | 222 | 10689 | 454.42 | 90 | 87 | 23.3 |
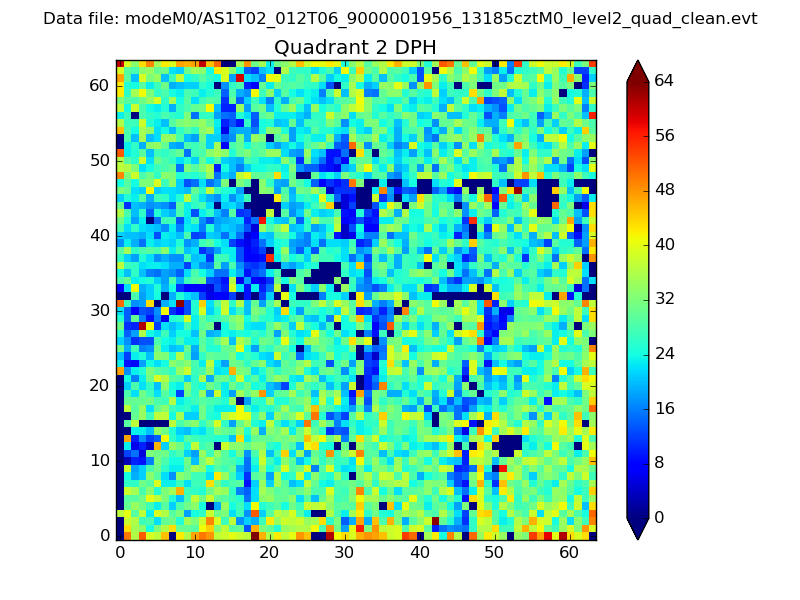
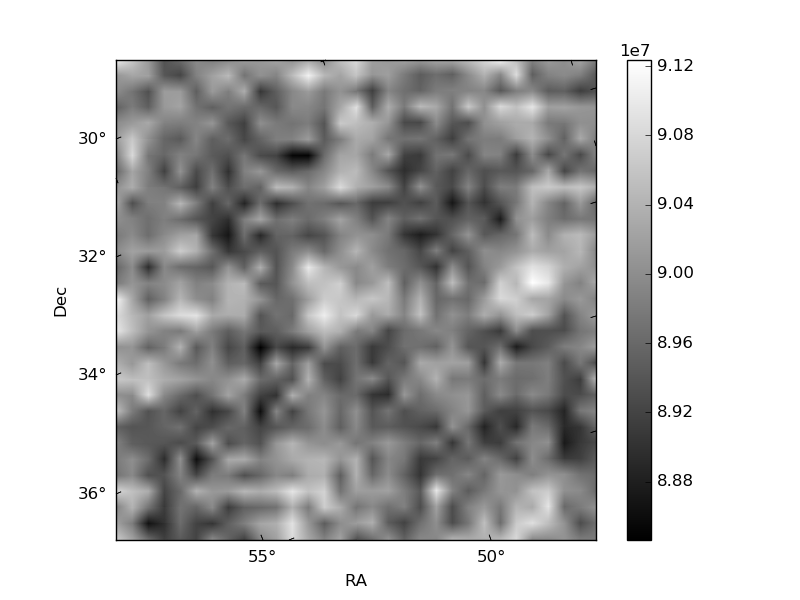
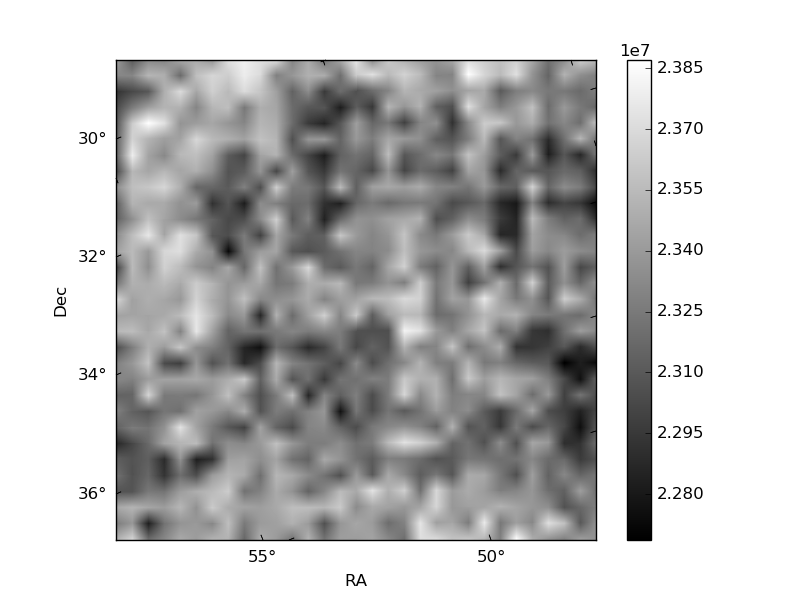
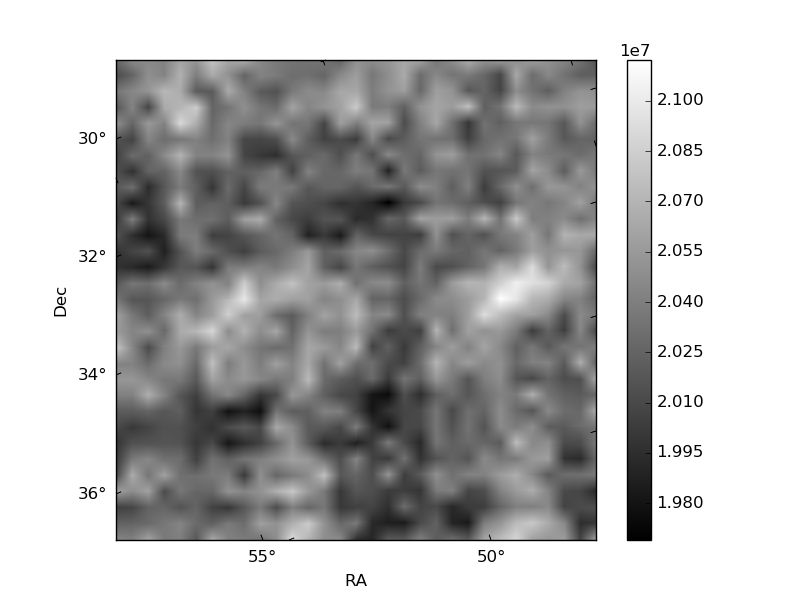
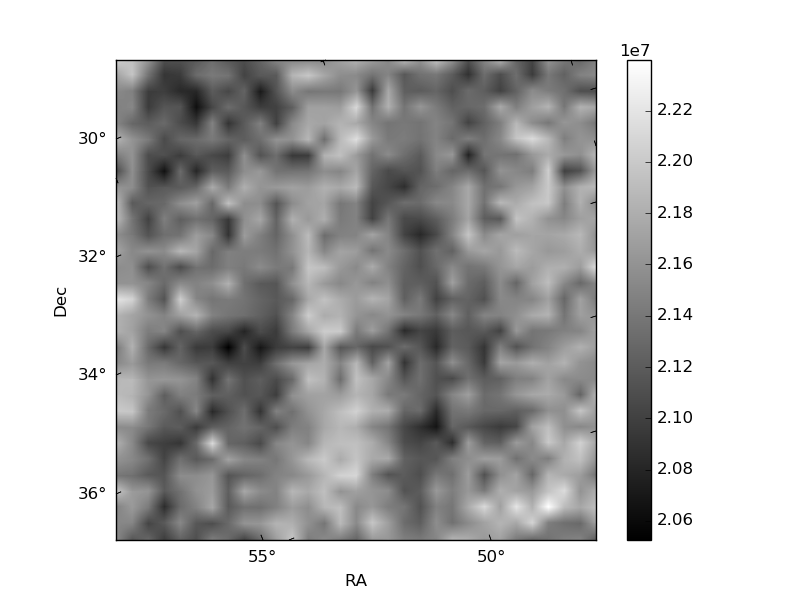
Histogram calculated using DETX and DETY for each event in the final _common_clean file
| Quadrant A | 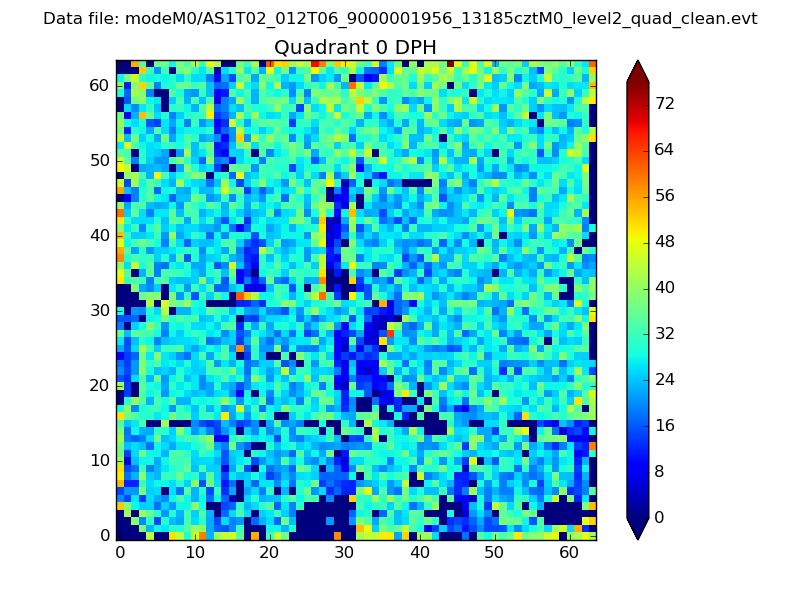 |
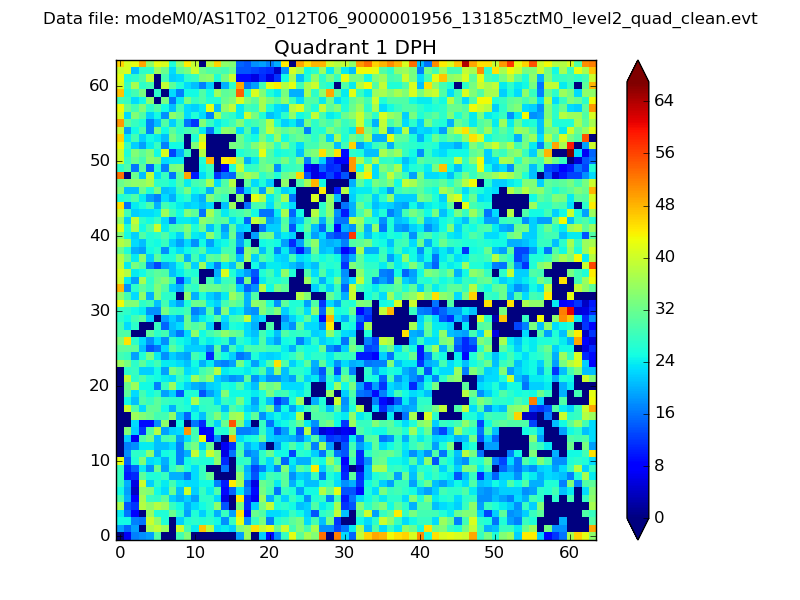 |
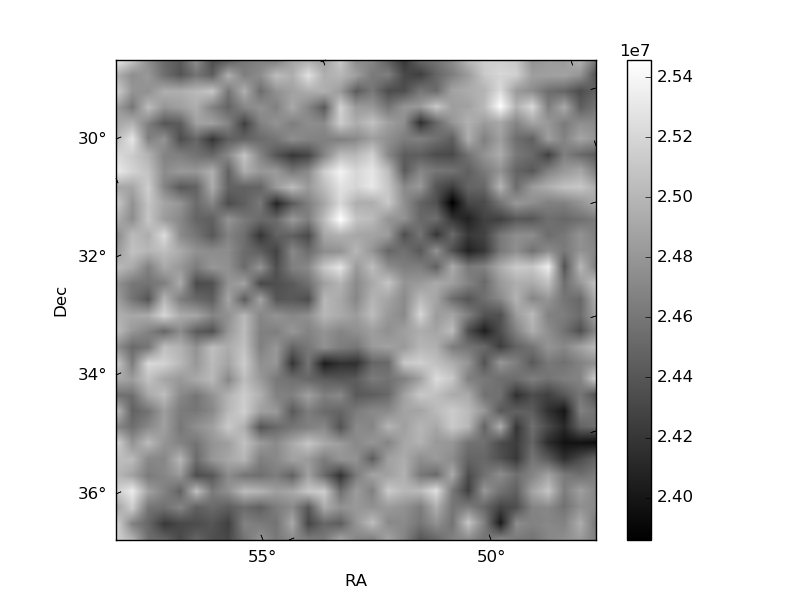
Quadrant B |
|---|---|---|---|
| Quadrant D | 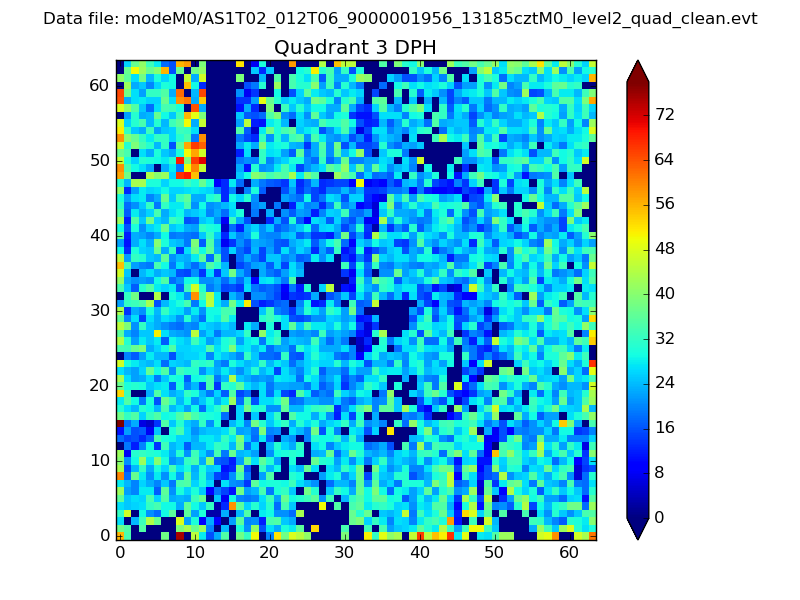 |
 |
Quadrant C |
| Plot type | Count rate plots | Images |
|---|---|---|
| Comparison with Poisson distribution Blue bars denote a histogram of data divided into 1 sec bins. Red curve is a Poisson curve with rate = median count rate of data. |
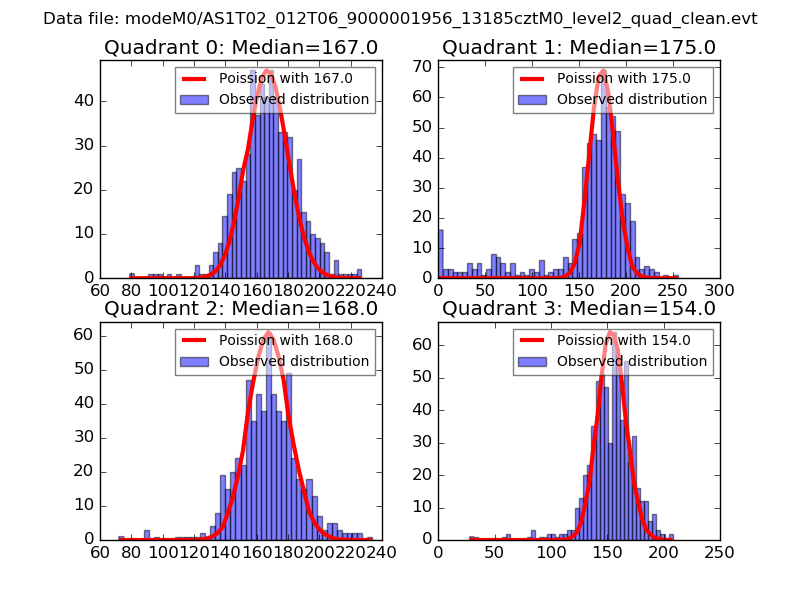 |
 |
| Quadrant-wise count rates Data is divided into 100 sec bins |
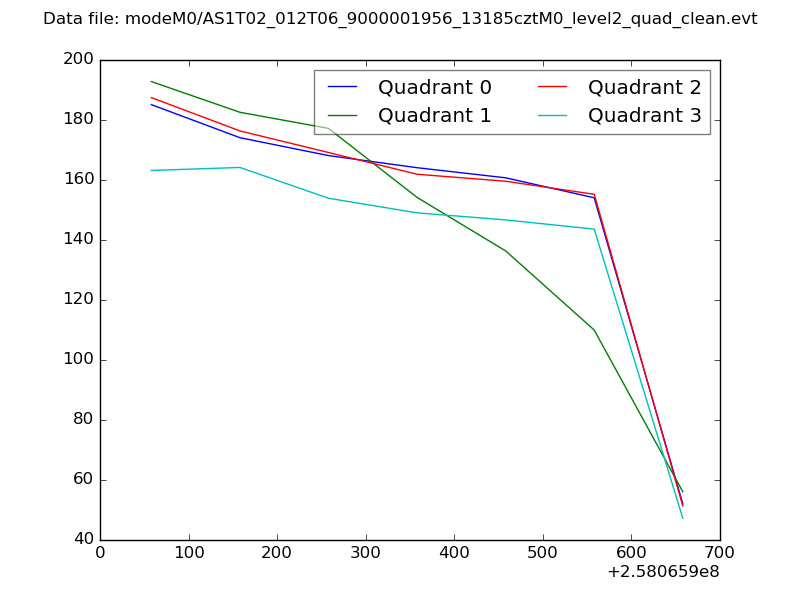 |
|
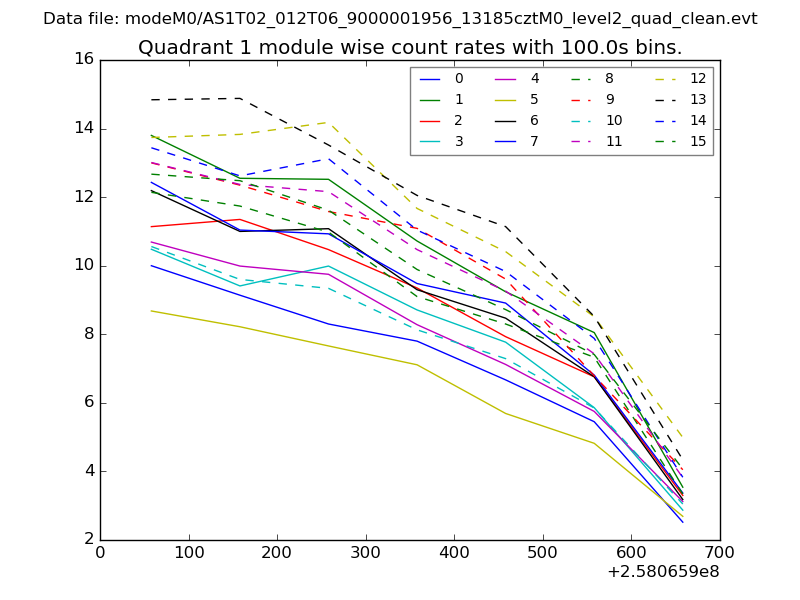
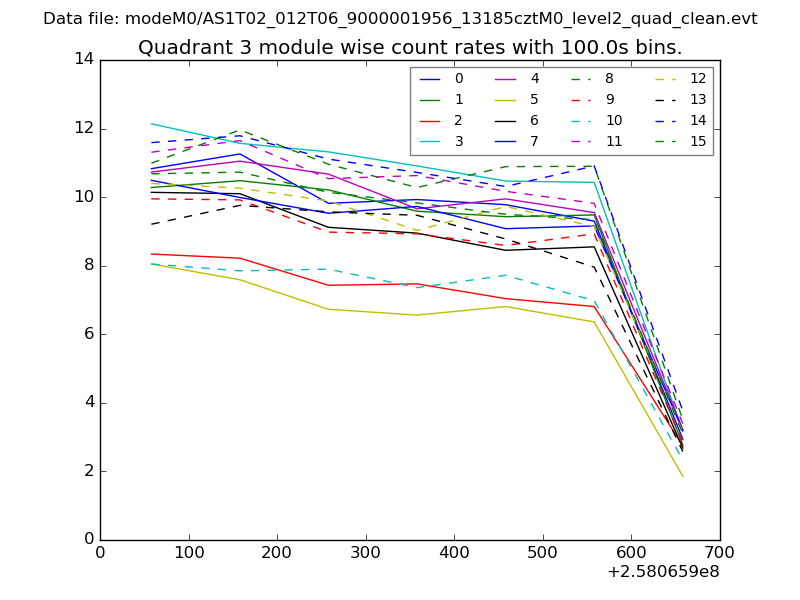
| Module-wise count rates for Quadrant A Data is divided into 100 sec bins |
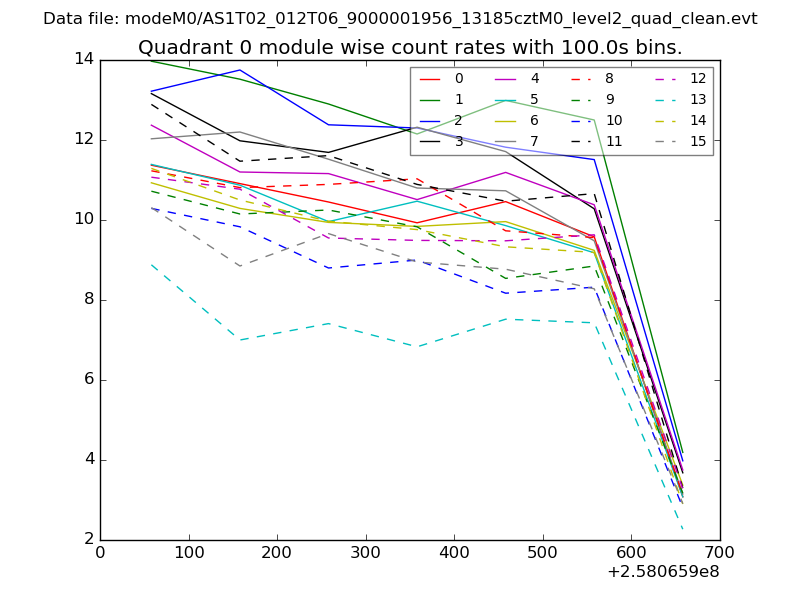 |
 |
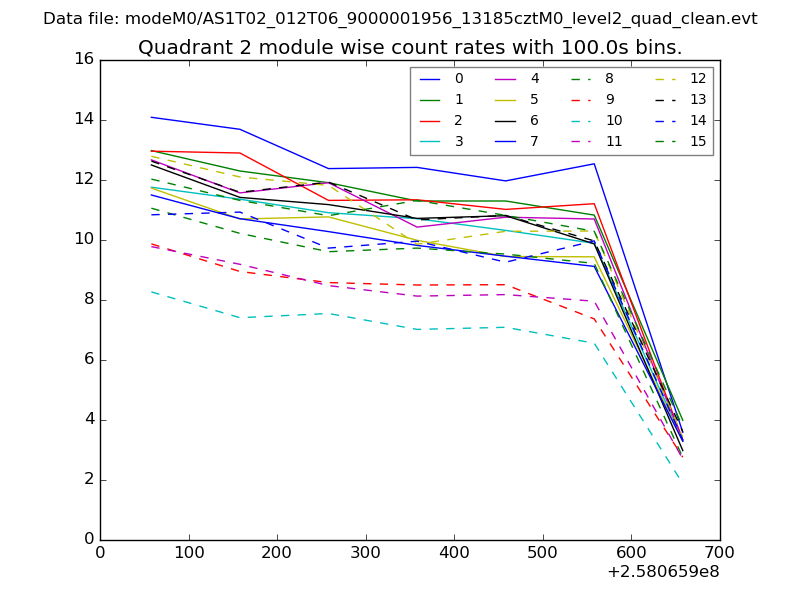
| Module-wise count rates for Quadrant B Data is divided into 100 sec bins |
 |
 |
| Module-wise count rates for Quadrant C Data is divided into 100 sec bins |
 |
 |
| Module-wise count rates for Quadrant D Data is divided into 100 sec bins |
 |
 |
| Parameter | Plot |
|---|---|
| CZT HV Monitor | 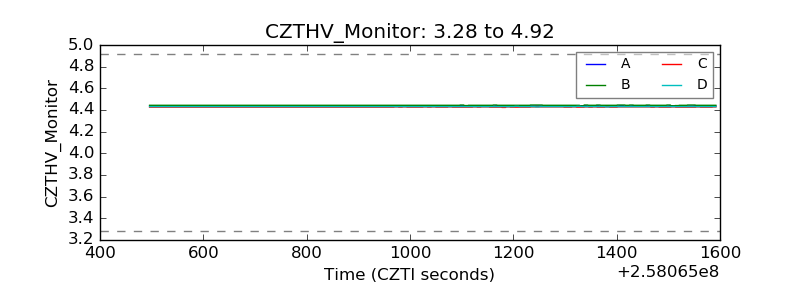 |
| D_VDD | 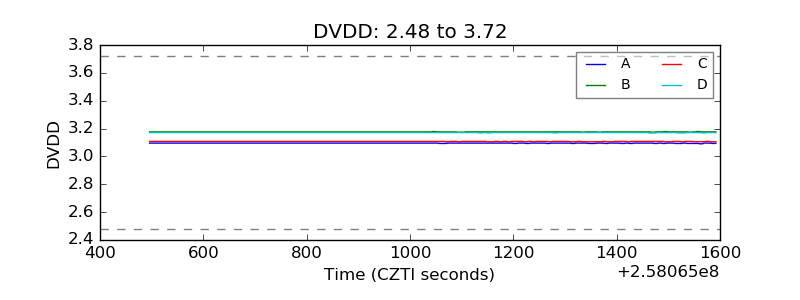 |
| Temperature 1 | 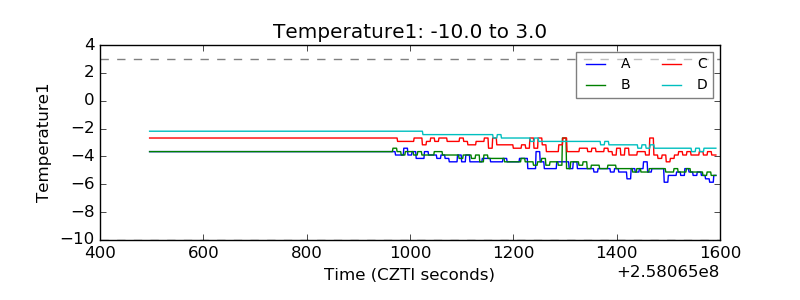 |
| Veto HV Monitor |  |
| Veto LLD | 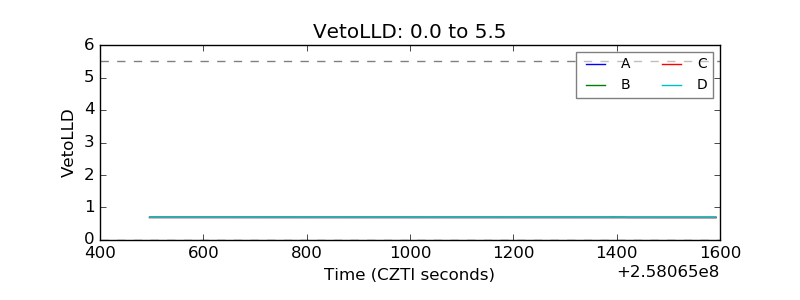 |
| Alpha Counter | 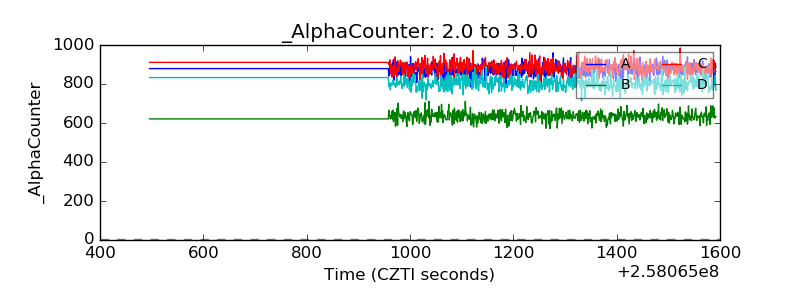 |
| _CPM_Rate | 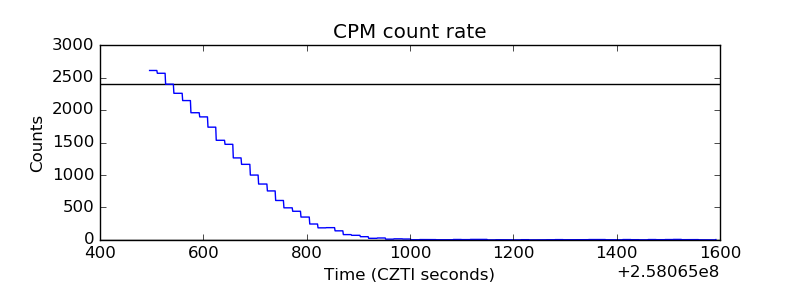 |
| CZT Counter | 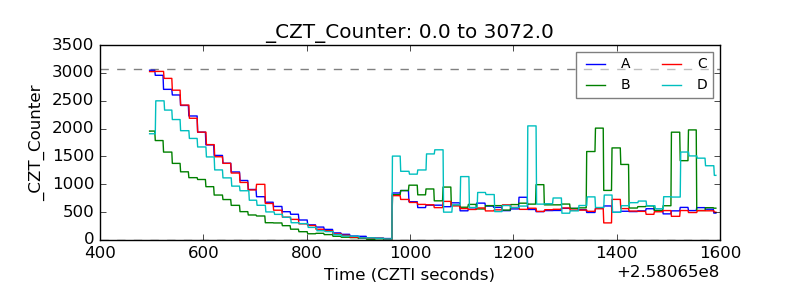 |
| +2.5 Volts monitor |  |
| +5 Volts monitor |  |
| _ROLL_ROT | 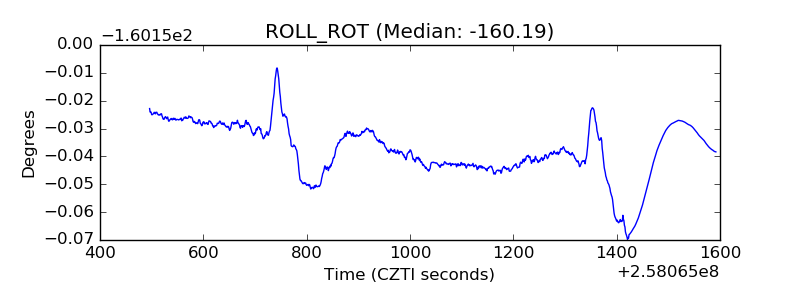 |
| _Roll_DEC | 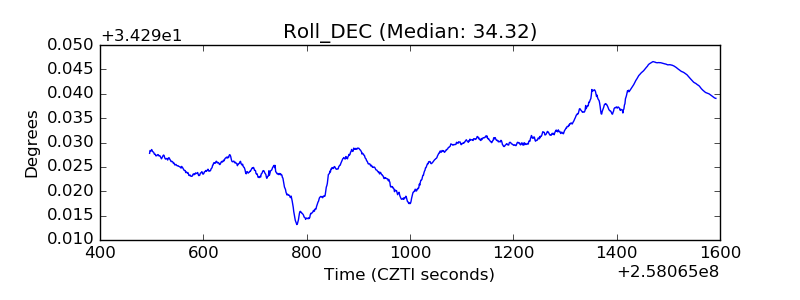 |
| _Roll_RA | 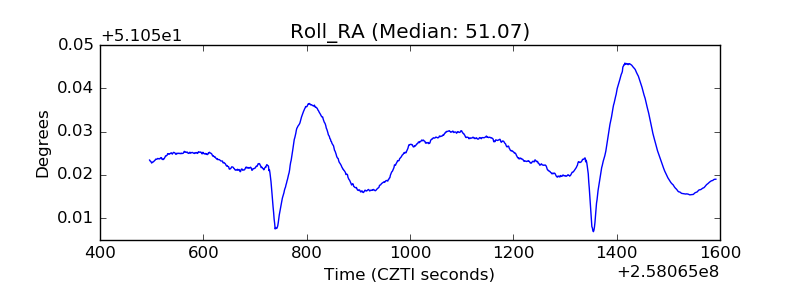 |
| Veto Counter | 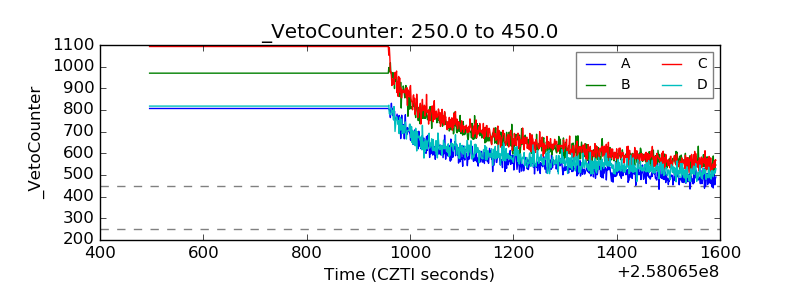 |