| Param | Original file | Final file |
|---|---|---|
| Filename | modeM0/AS1T02_012T07_9000001958cztM0_level2.fits | modeM0/AS1T02_012T07_9000001958cztM0_level2_quad_clean.evt |
| Size (bytes) | 228,121,920 | 209,580,480 |
| Size | 217.6 MB | 199.9 MB |
| Events in quadrant A | 1,420,602 | 1,280,257 |
| Events in quadrant B | 1,294,496 | 1,143,928 |
| Events in quadrant C | 1,400,012 | 1,232,051 |
| Events in quadrant D | 1,161,728 | 1,059,743 |
| Mode M0 | |||
|---|---|---|---|
| Quadrant | BADHDUFLAG | Total packets | Discarded packets |
| A | 0 | 50211 | 0 |
| B | 0 | 64934 | 0 |
| C | 0 | 48878 | 0 |
| D | 0 | 70519 | 0 |
| Mode M9 | |||
|---|---|---|---|
| Quadrant | BADHDUFLAG | Total packets | Discarded packets |
| A | 0 | 50 | 0 |
| B | 0 | 50 | 0 |
| C | 0 | 50 | 0 |
| D | 0 | 50 | 0 |
| Mode SS | |||
|---|---|---|---|
| Quadrant | BADHDUFLAG | Total packets | Discarded packets |
| A | 0 | 480 | 0 |
| B | 0 | 480 | 0 |
| C | 0 | 480 | 0 |
| D | 0 | 480 | 0 |
| Quadrant | Total seconds | Saturated seconds | Saturation percentage |
|---|---|---|---|
| A | 23702 | 208 | 0.877563% |
| B | 23702 | 2491 | 10.509662% |
| C | 23702 | 143 | 0.603325% |
| D | 23702 | 1861 | 7.851658% |
Noise dominated data is calculated using 1-second bins in cleaned event files. If a bin has >2000 counts, and if more than 50% of those come from <1% of pixels, then it is considered to be noise-dominated and hence unusable.
| Quadrant | # 1 sec bins | Bins with >0 counts | Bins with >2000 counts | High rate bins dominated by noise | Noise dominated (total time) | Noise dominated (detector-on time) | Marked lightcurve |
|---|---|---|---|---|---|---|---|
| A | 28607 | 23697 | 0 | 0 | 0.00% | 0.00% |  |
| B | 28607 | 23367 | 0 | 0 | 0.00% | 0.00% |  |
| C | 28607 | 23703 | 0 | 0 | 0.00% | 0.00% |  |
| D | 28607 | 23698 | 0 | 0 | 0.00% | 0.00% |  |
Top three noisy pixels from each quadrant. If the there are fewer than three noisy pixels in the level2.evt file, extra rows are filled as -1
| Pixel properties | Quadrant properties | ||||||
|---|---|---|---|---|---|---|---|
| Quadrant | DetID | PixID | Counts | Sigma | Mean | Median | Sigma |
| A | 0 | 29 | 1381 | 11.28 | 370 | 348 | 91.6 |
| A | 7 | 110 | 1160 | 8.87 | 370 | 348 | 91.6 |
| A | 0 | 30 | 1044 | 7.6 | 370 | 348 | 91.6 |
| B | 2 | 9 | 1132 | 11.64 | 342 | 327 | 69.1 |
| B | 12 | 226 | 867 | 7.8 | 342 | 327 | 69.1 |
| B | 2 | 8 | 839 | 7.4 | 342 | 327 | 69.1 |
| C | 1 | 80 | 1044 | 7.17 | 369 | 345 | 97.5 |
| C | 12 | 241 | 1011 | 6.83 | 369 | 345 | 97.5 |
| C | 1 | 81 | 1000 | 6.72 | 369 | 345 | 97.5 |
| D | 3 | 14 | 881 | 6.44 | 331 | 302 | 89.9 |
| D | 6 | 231 | 838 | 5.96 | 331 | 302 | 89.9 |
| D | 7 | 5 | 830 | 5.87 | 331 | 302 | 89.9 |
Histogram calculated using DETX and DETY for each event in the final _common_clean file
| Quadrant A |  |
 |
Quadrant B |
|---|---|---|---|
| Quadrant D |  |
 |
Quadrant C |
| Plot type | Count rate plots | Images |
|---|---|---|
| Comparison with Poisson distribution Blue bars denote a histogram of data divided into 1 sec bins. Red curve is a Poisson curve with rate = median count rate of data. |
 |
 |
| Quadrant-wise count rates Data is divided into 100 sec bins |
 |
|
| Module-wise count rates for Quadrant A Data is divided into 100 sec bins |
 |
 |
| Module-wise count rates for Quadrant B Data is divided into 100 sec bins |
 |
 |
| Module-wise count rates for Quadrant C Data is divided into 100 sec bins |
 |
 |
| Module-wise count rates for Quadrant D Data is divided into 100 sec bins |
 |
 |
| Parameter | Plot |
|---|---|
| CZT HV Monitor |  |
| D_VDD | 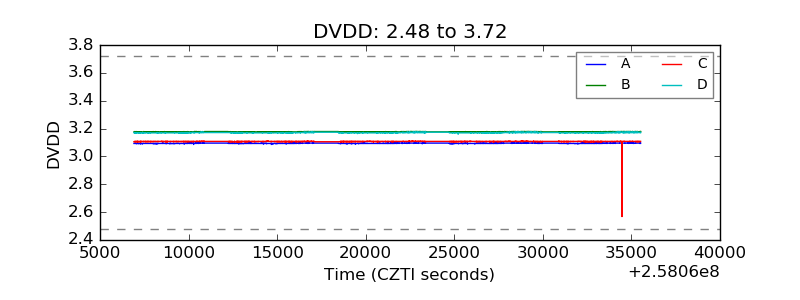 |
| Temperature 1 |  |
| Veto HV Monitor |  |
| Veto LLD |  |
| Alpha Counter |  |
| _CPM_Rate |  |
| CZT Counter |  |
| +2.5 Volts monitor |  |
| +5 Volts monitor |  |
| _ROLL_ROT |  |
| _Roll_DEC |  |
| _Roll_RA |  |
| Veto Counter |  |