| Param | Original file | Final file |
|---|---|---|
| Filename | modeM0/AS1T02_012T07_9000001958_13184cztM0_level2.evt | modeM0/AS1T02_012T07_9000001958_13184cztM0_level2_quad_clean.evt |
| Size (bytes) | 33,048,000 | 1,572,480 |
| Size | 31.5 MB | 1.5 MB |
| Events in quadrant A | 164,619 | 3,874 |
| Events in quadrant B | 458,085 | 3,193 |
| Events in quadrant C | 166,321 | 3,837 |
| Events in quadrant D | 184,674 | 3,641 |
| Mode M0 | |||
|---|---|---|---|
| Quadrant | BADHDUFLAG | Total packets | Discarded packets |
| A | 0 | 705 | 1 |
| B | 0 | 1588 | 0 |
| C | 0 | 703 | 0 |
| D | 0 | 766 | 0 |
| Mode SS | |||
|---|---|---|---|
| Quadrant | BADHDUFLAG | Total packets | Discarded packets |
| A | 0 | 6 | 0 |
| B | 0 | 6 | 0 |
| C | 0 | 6 | 0 |
| D | 0 | 6 | 0 |
| Quadrant | Total seconds | Saturated seconds | Saturation percentage |
|---|---|---|---|
| A | 350 | 0 | 0.000000% |
| B | 350 | 154 | 44.000000% |
| C | 350 | 0 | 0.000000% |
| D | 350 | 0 | 0.000000% |
Noise dominated data is calculated using 1-second bins in cleaned event files. If a bin has >2000 counts, and if more than 50% of those come from <1% of pixels, then it is considered to be noise-dominated and hence unusable.
| Quadrant | # 1 sec bins | Bins with >0 counts | Bins with >2000 counts | High rate bins dominated by noise | Noise dominated (total time) | Noise dominated (detector-on time) | Marked lightcurve |
|---|---|---|---|---|---|---|---|
| A | 351 | 351 | 0 | 0 | 0.00% | 0.00% | 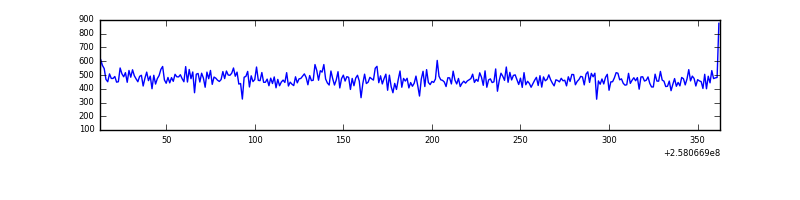 |
| B | 351 | 351 | 102 | 102 | 29.06% | 29.06% | 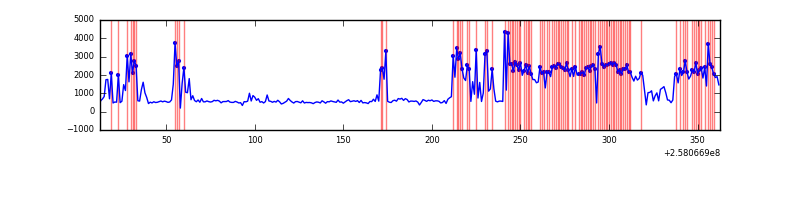 |
| C | 351 | 351 | 0 | 0 | 0.00% | 0.00% | 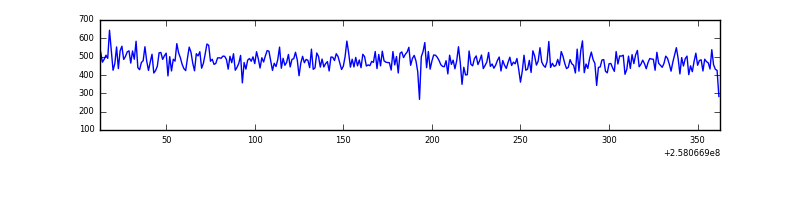 |
| D | 351 | 351 | 0 | 0 | 0.00% | 0.00% | 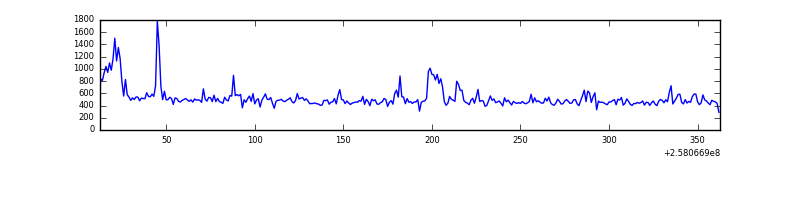 |
Top three noisy pixels from each quadrant. If the there are fewer than three noisy pixels in the level2.evt file, extra rows are filled as -1
| Pixel properties | Quadrant properties | ||||||
|---|---|---|---|---|---|---|---|
| Quadrant | DetID | PixID | Counts | Sigma | Mean | Median | Sigma |
| A | 8 | 15 | 952 | 87.45 | 42 | 41 | 10.4 |
| A | 0 | 226 | 378 | 32.35 | 42 | 41 | 10.4 |
| A | 12 | 194 | 306 | 25.44 | 42 | 41 | 10.4 |
| B | 4 | 239 | 315068 | 41494.87 | 28 | 28 | 7.6 |
| B | 3 | 64 | 18503 | 2433.4 | 28 | 28 | 7.6 |
| B | 0 | 214 | 5325 | 697.68 | 28 | 28 | 7.6 |
| C | 15 | 208 | 363 | 27.89 | 42 | 42 | 11.5 |
| C | 13 | 61 | 334 | 25.37 | 42 | 42 | 11.5 |
| C | 8 | 222 | 139 | 8.43 | 42 | 42 | 11.5 |
| D | 13 | 122 | 12551 | 1050.13 | 41 | 39 | 11.9 |
| D | 1 | 52 | 11852 | 991.46 | 41 | 39 | 11.9 |
| D | 8 | 195 | 2589 | 214.02 | 41 | 39 | 11.9 |
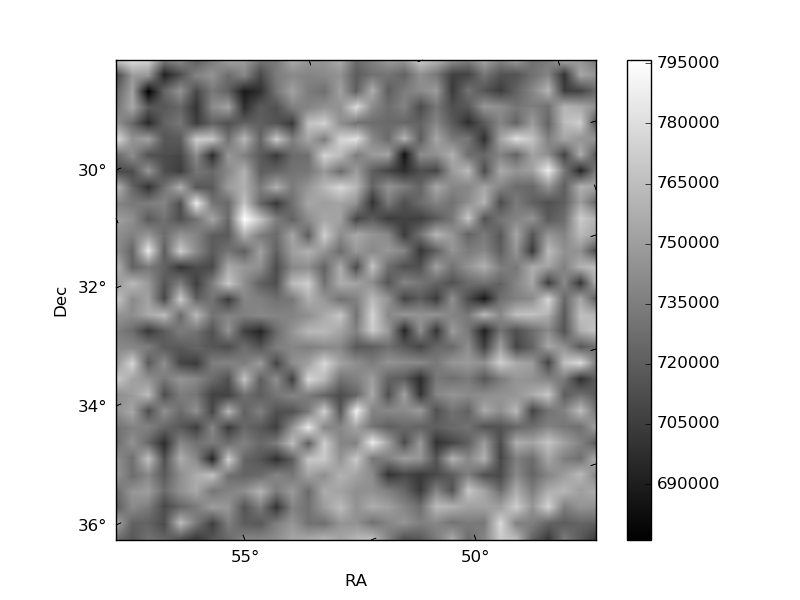
Histogram calculated using DETX and DETY for each event in the final _common_clean file
| Quadrant A | 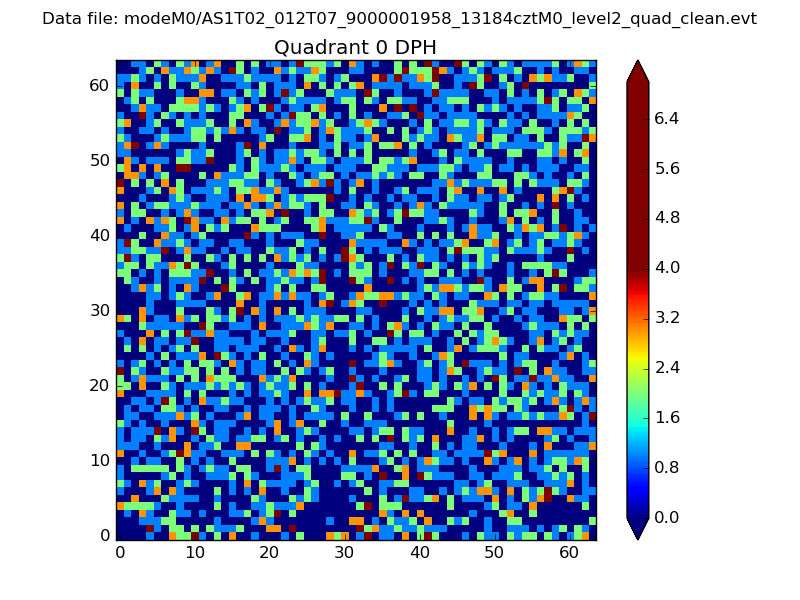 |
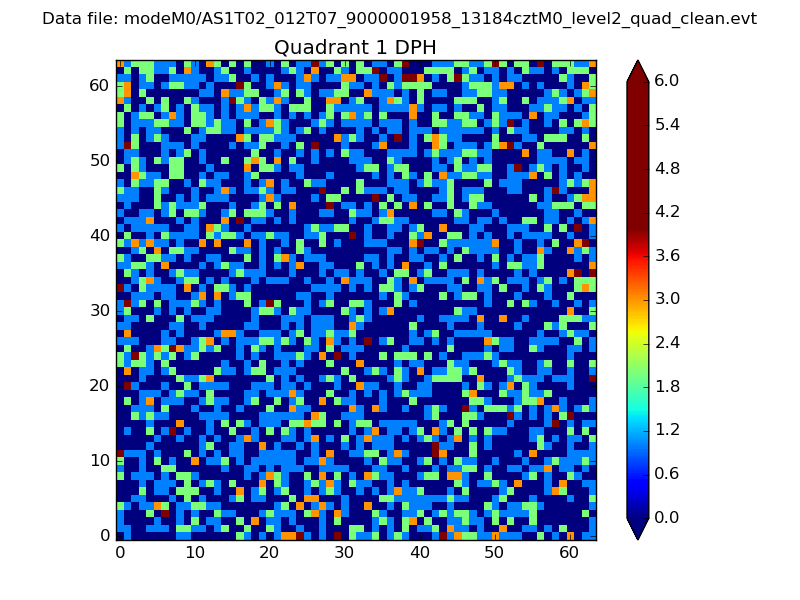 |
Quadrant B |
|---|---|---|---|
| Quadrant D | 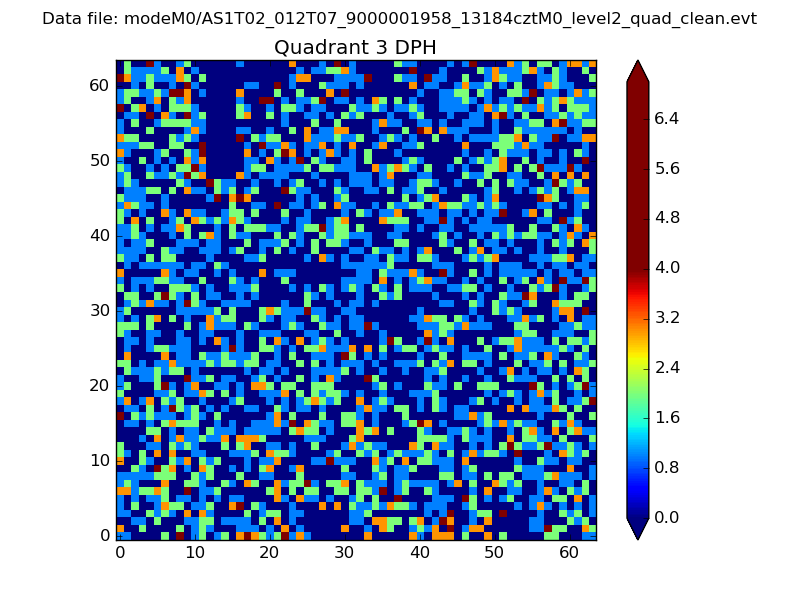 |
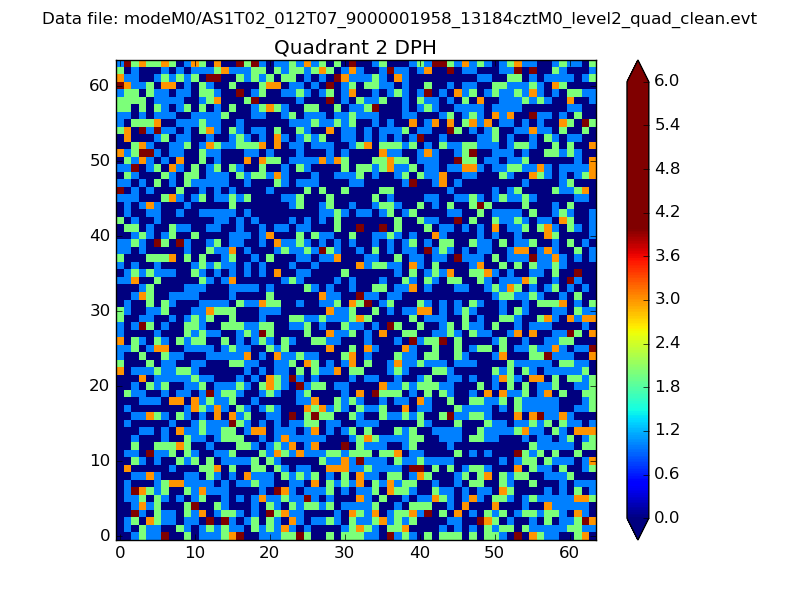 |
Quadrant C |
| Plot type | Count rate plots | Images |
|---|---|---|
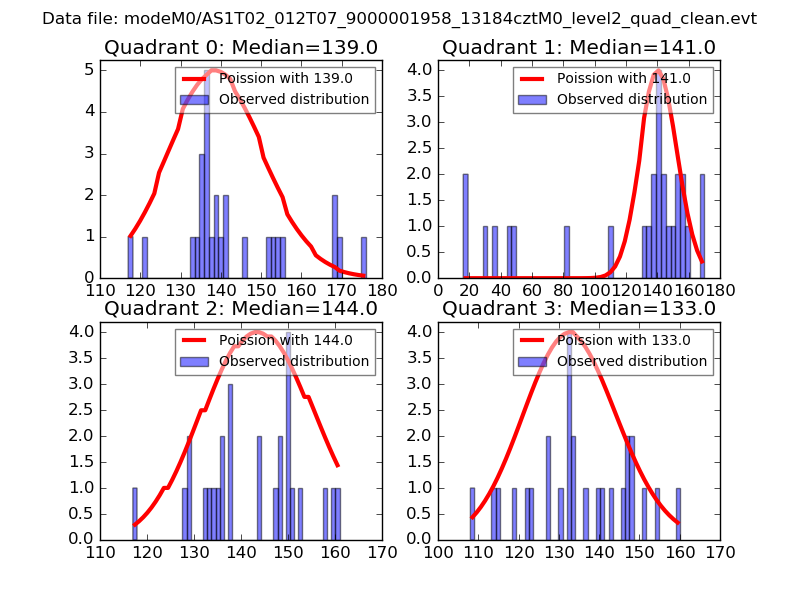
| Comparison with Poisson distribution Blue bars denote a histogram of data divided into 1 sec bins. Red curve is a Poisson curve with rate = median count rate of data. |
 |
 |
| Quadrant-wise count rates Data is divided into 100 sec bins |
 |
|
| Module-wise count rates for Quadrant A Data is divided into 100 sec bins |
 |
 |
| Module-wise count rates for Quadrant B Data is divided into 100 sec bins |
 |
 |
| Module-wise count rates for Quadrant C Data is divided into 100 sec bins |
 |
 |
| Module-wise count rates for Quadrant D Data is divided into 100 sec bins |
 |
 |
| Parameter | Plot |
|---|---|
| CZT HV Monitor | 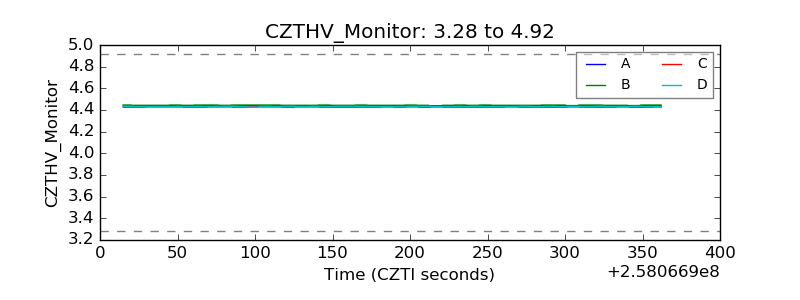 |
| D_VDD | 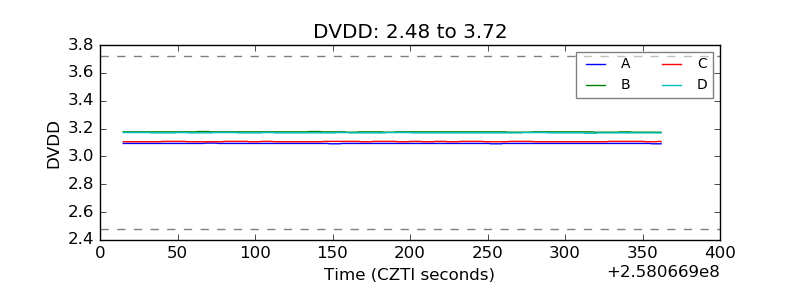 |
| Temperature 1 |  |
| Veto HV Monitor | 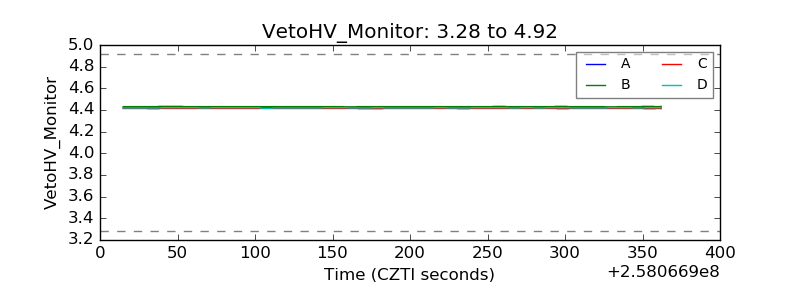 |
| Veto LLD | 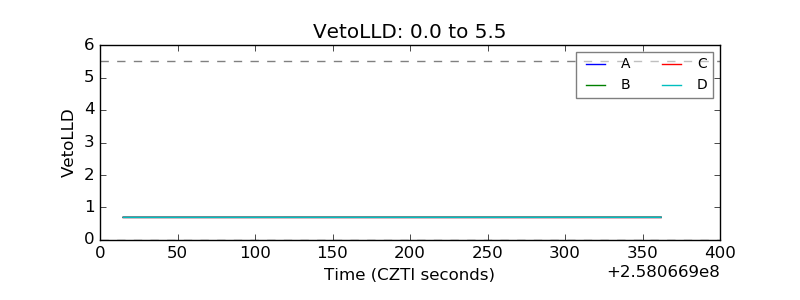 |
| Alpha Counter | 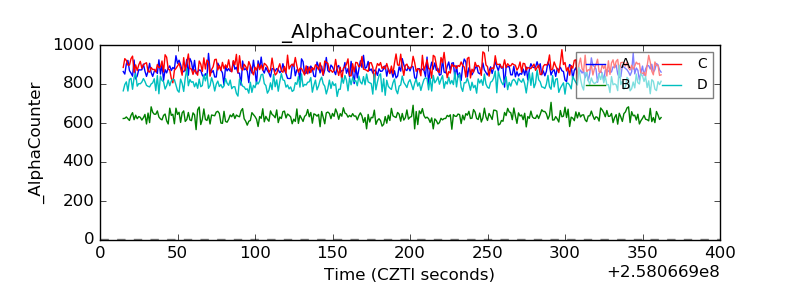 |
| _CPM_Rate | 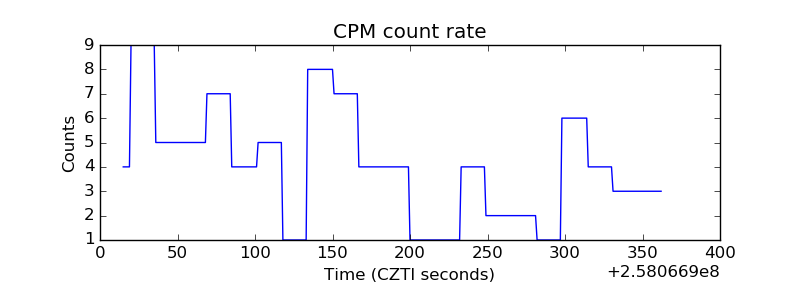 |
| CZT Counter | 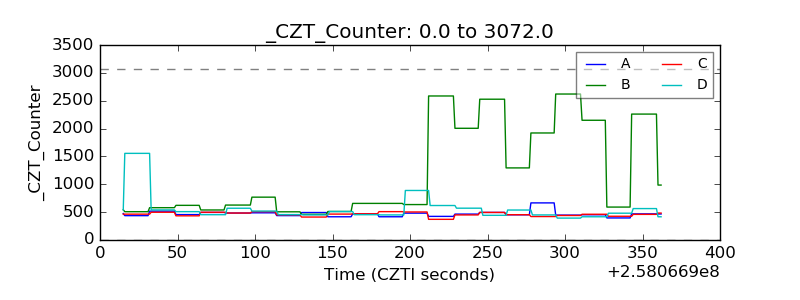 |
| +2.5 Volts monitor |  |
| +5 Volts monitor |  |
| _ROLL_ROT | 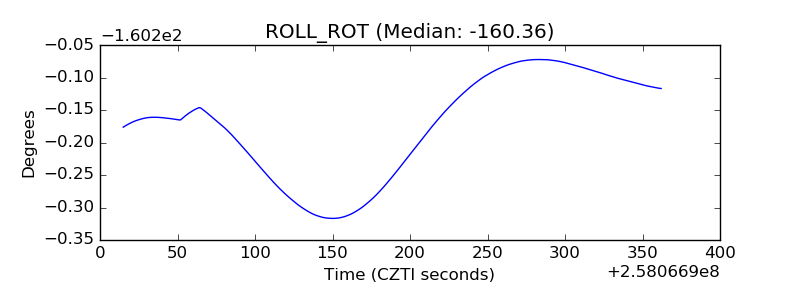 |
| _Roll_DEC | 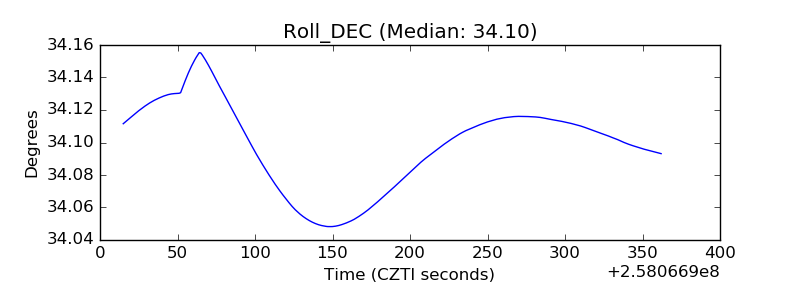 |
| _Roll_RA | 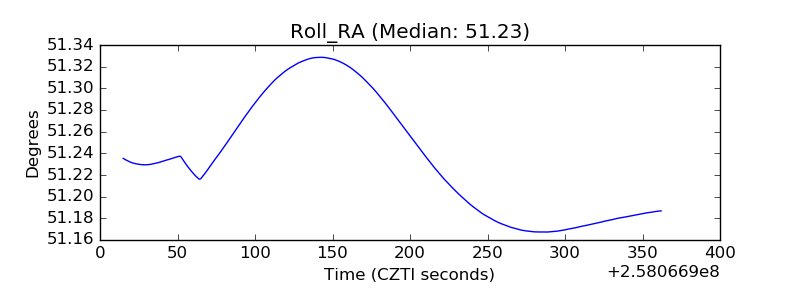 |
| Veto Counter | 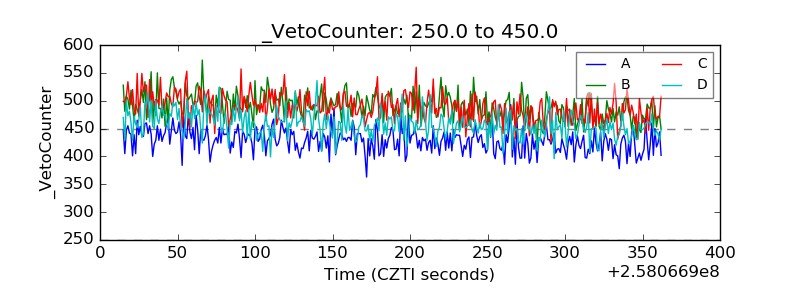 |