| Param | Original file | Final file |
|---|---|---|
| Filename | modeM0/AS1T02_012T07_9000001958_13185cztM0_level2.evt | modeM0/AS1T02_012T07_9000001958_13185cztM0_level2_quad_clean.evt |
| Size (bytes) | 422,968,320 | 57,193,920 |
| Size | 403.4 MB | 54.5 MB |
| Events in quadrant A | 2,730,269 | 344,656 |
| Events in quadrant B | 3,841,211 | 328,620 |
| Events in quadrant C | 2,733,884 | 343,020 |
| Events in quadrant D | 3,124,996 | 324,968 |
| Mode M0 | |||
|---|---|---|---|
| Quadrant | BADHDUFLAG | Total packets | Discarded packets |
| A | 0 | 11608 | 2 |
| B | 0 | 14949 | 1 |
| C | 0 | 11687 | 1 |
| D | 0 | 12943 | 1 |
| Mode M9 | |||
|---|---|---|---|
| Quadrant | BADHDUFLAG | Total packets | Discarded packets |
| A | 0 | 14 | 0 |
| B | 0 | 14 | 0 |
| C | 0 | 14 | 0 |
| D | 0 | 14 | 0 |
| Mode SS | |||
|---|---|---|---|
| Quadrant | BADHDUFLAG | Total packets | Discarded packets |
| A | 0 | 112 | 0 |
| B | 0 | 112 | 0 |
| C | 0 | 112 | 0 |
| D | 0 | 112 | 0 |
| Quadrant | Total seconds | Saturated seconds | Saturation percentage |
|---|---|---|---|
| A | 5581 | 17 | 0.304605% |
| B | 5581 | 511 | 9.156065% |
| C | 5581 | 44 | 0.788389% |
| D | 5581 | 65 | 1.164666% |
Noise dominated data is calculated using 1-second bins in cleaned event files. If a bin has >2000 counts, and if more than 50% of those come from <1% of pixels, then it is considered to be noise-dominated and hence unusable.
| Quadrant | # 1 sec bins | Bins with >0 counts | Bins with >2000 counts | High rate bins dominated by noise | Noise dominated (total time) | Noise dominated (detector-on time) | Marked lightcurve |
|---|---|---|---|---|---|---|---|
| A | 6922 | 5583 | 0 | 0 | 0.00% | 0.00% |  |
| B | 6922 | 5583 | 318 | 318 | 4.59% | 5.70% |  |
| C | 6922 | 5583 | 22 | 22 | 0.32% | 0.39% | 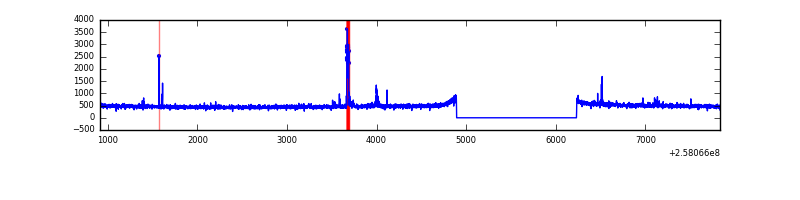 |
| D | 6922 | 5583 | 31 | 31 | 0.45% | 0.56% | 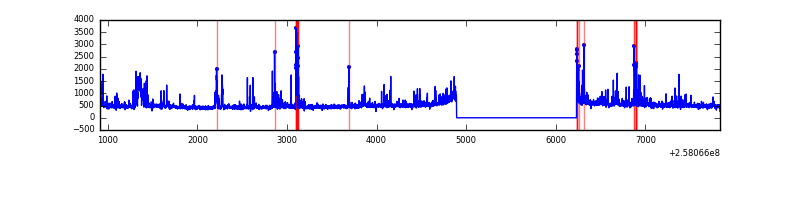 |
Top three noisy pixels from each quadrant. If the there are fewer than three noisy pixels in the level2.evt file, extra rows are filled as -1
| Pixel properties | Quadrant properties | ||||||
|---|---|---|---|---|---|---|---|
| Quadrant | DetID | PixID | Counts | Sigma | Mean | Median | Sigma |
| A | 12 | 189 | 40163 | 283.48 | 686 | 672 | 139.3 |
| A | 1 | 162 | 15172 | 104.09 | 686 | 672 | 139.3 |
| A | 9 | 143 | 11519 | 77.86 | 686 | 672 | 139.3 |
| B | 4 | 239 | 1157893 | 9352.71 | 653 | 637 | 123.7 |
| B | 3 | 64 | 54456 | 434.95 | 653 | 637 | 123.7 |
| B | 0 | 214 | 33246 | 263.54 | 653 | 637 | 123.7 |
| C | 15 | 208 | 101410 | 651.01 | 675 | 679 | 154.7 |
| C | 13 | 61 | 5022 | 28.07 | 675 | 679 | 154.7 |
| C | 3 | 202 | 1564 | 5.72 | 675 | 679 | 154.7 |
| D | 13 | 122 | 332140 | 2092.12 | 663 | 645 | 158.4 |
| D | 1 | 52 | 115612 | 725.58 | 663 | 645 | 158.4 |
| D | 10 | 157 | 62887 | 392.82 | 663 | 645 | 158.4 |
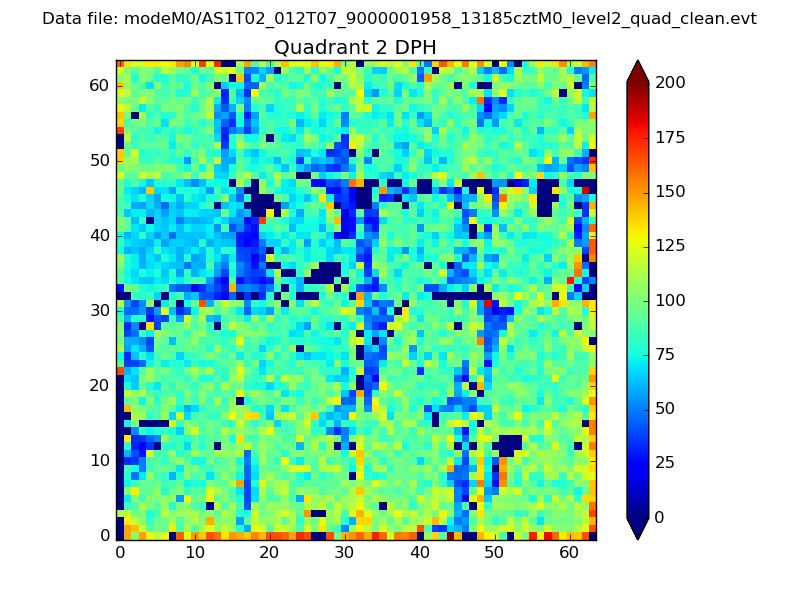
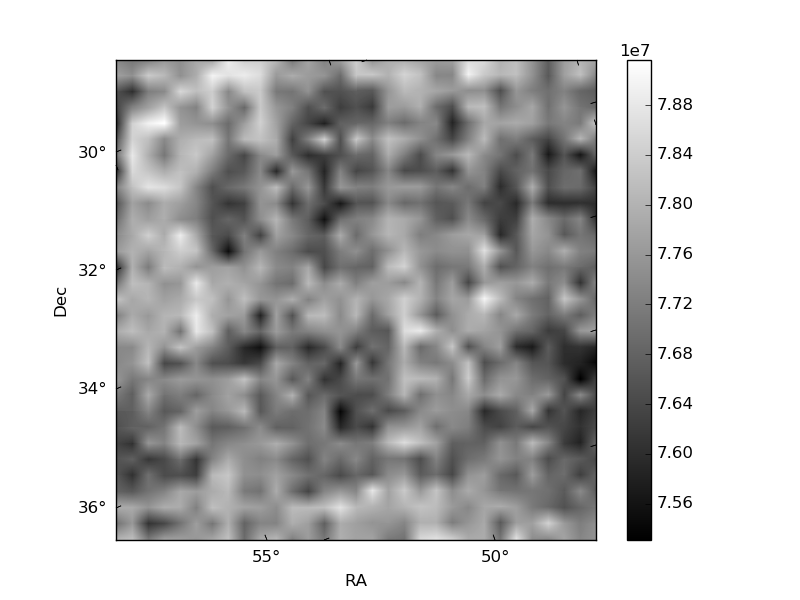
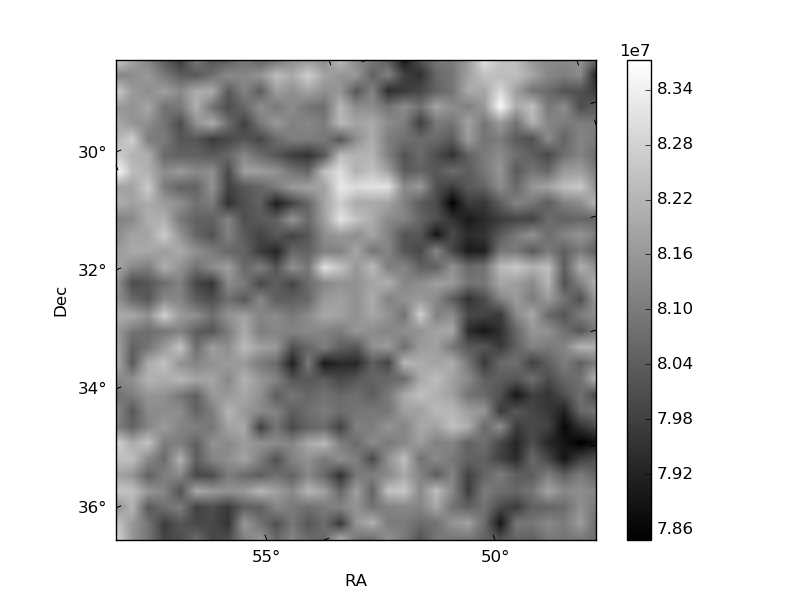
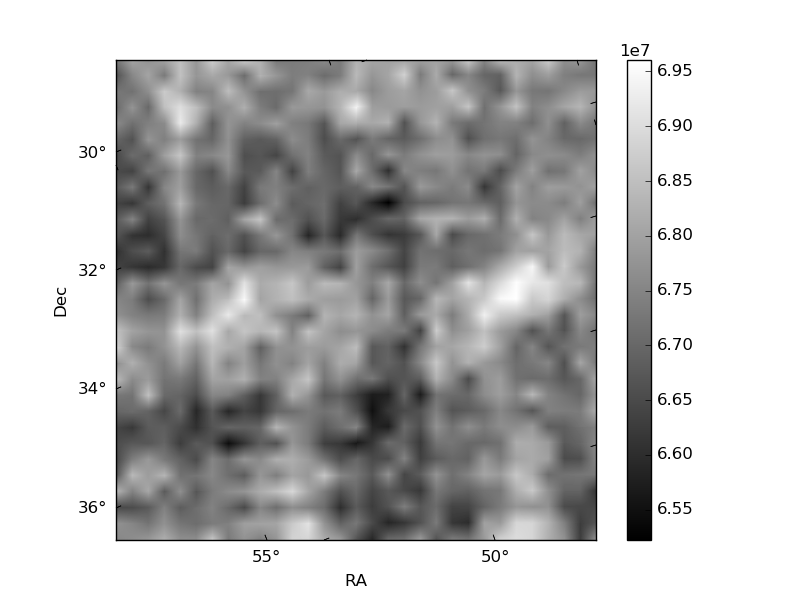
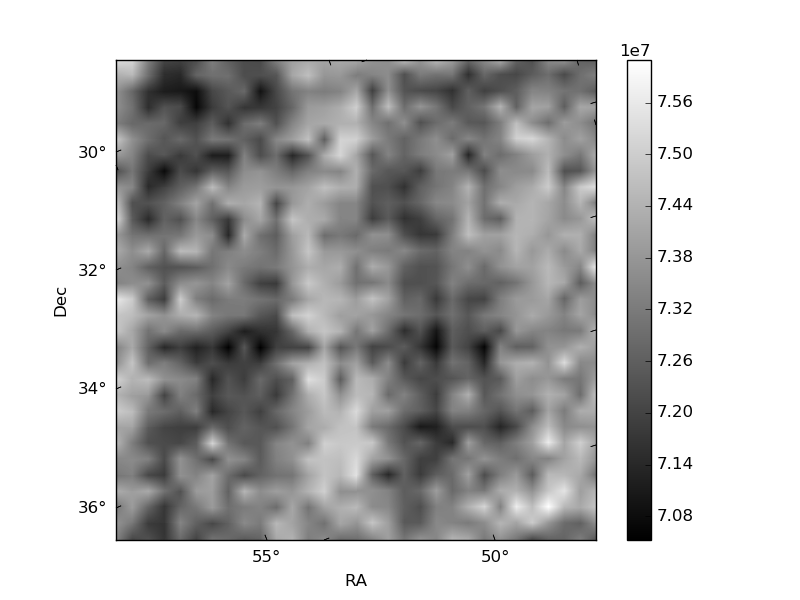
Histogram calculated using DETX and DETY for each event in the final _common_clean file
| Quadrant A | 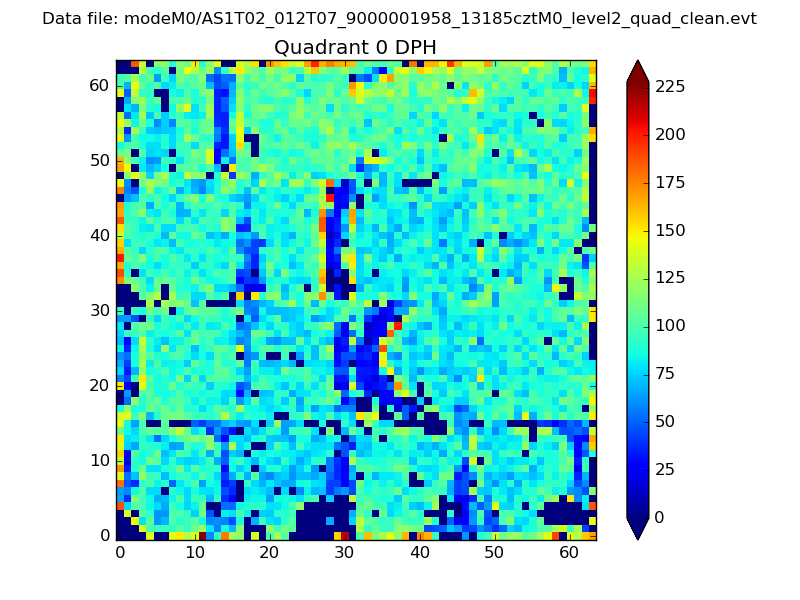 |
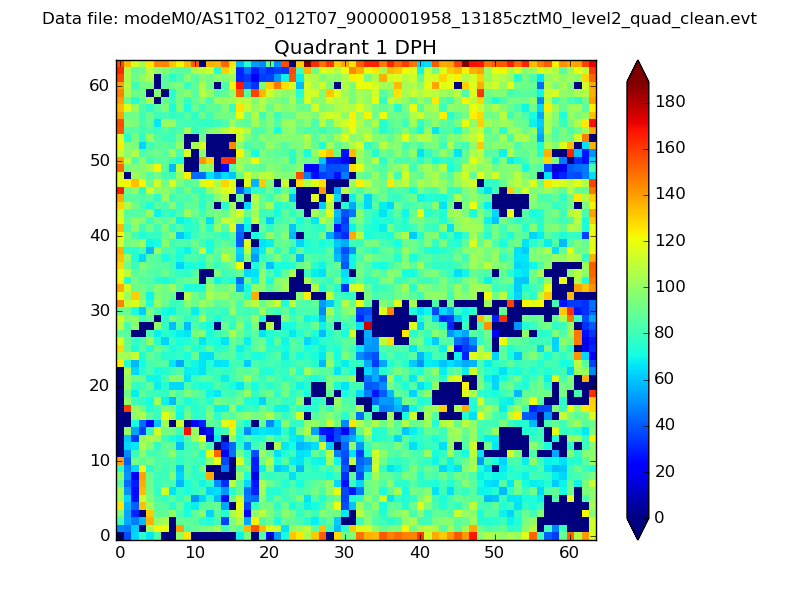 |
Quadrant B |
|---|---|---|---|
| Quadrant D | 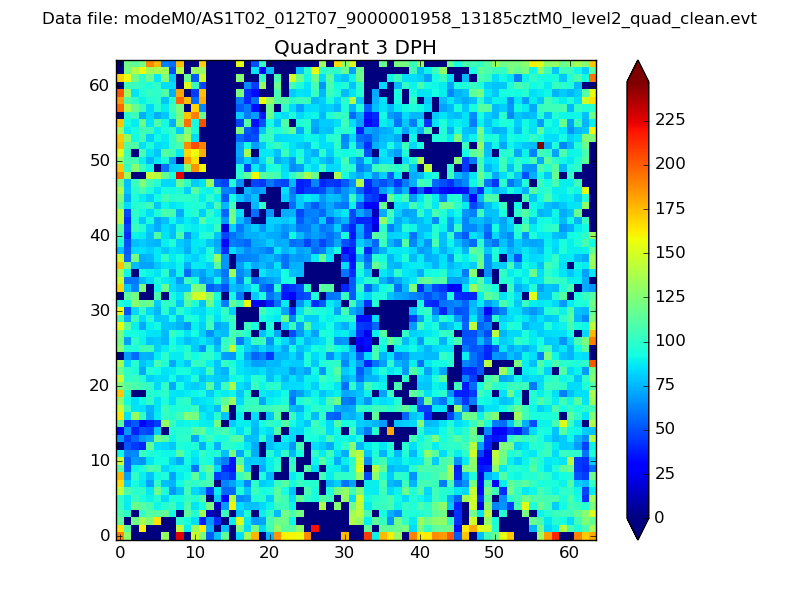 |
 |
Quadrant C |
| Plot type | Count rate plots | Images |
|---|---|---|
| Comparison with Poisson distribution Blue bars denote a histogram of data divided into 1 sec bins. Red curve is a Poisson curve with rate = median count rate of data. |
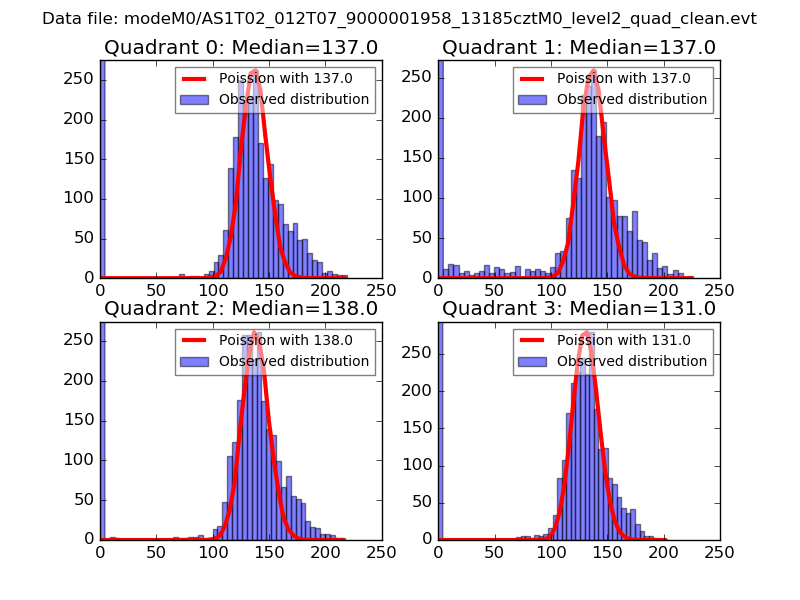 |
 |
| Quadrant-wise count rates Data is divided into 100 sec bins |
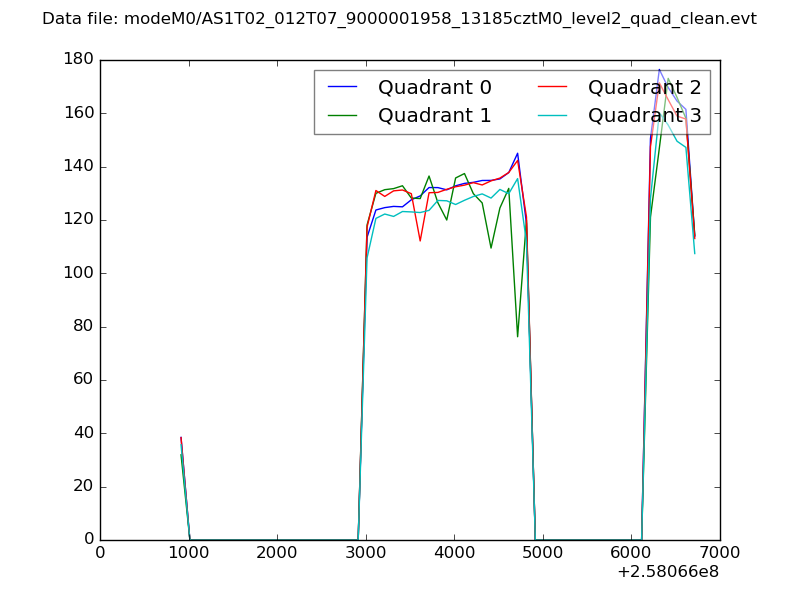 |
|
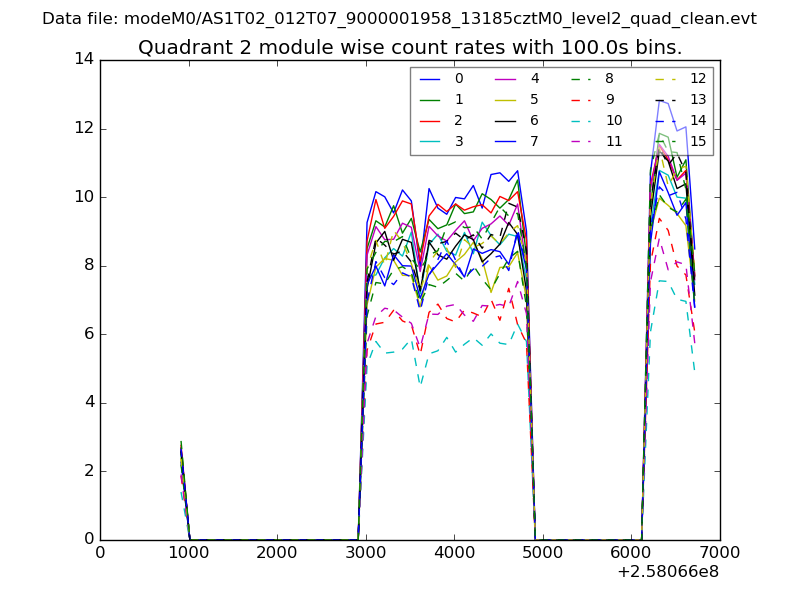
| Module-wise count rates for Quadrant A Data is divided into 100 sec bins |
 |
 |
| Module-wise count rates for Quadrant B Data is divided into 100 sec bins |
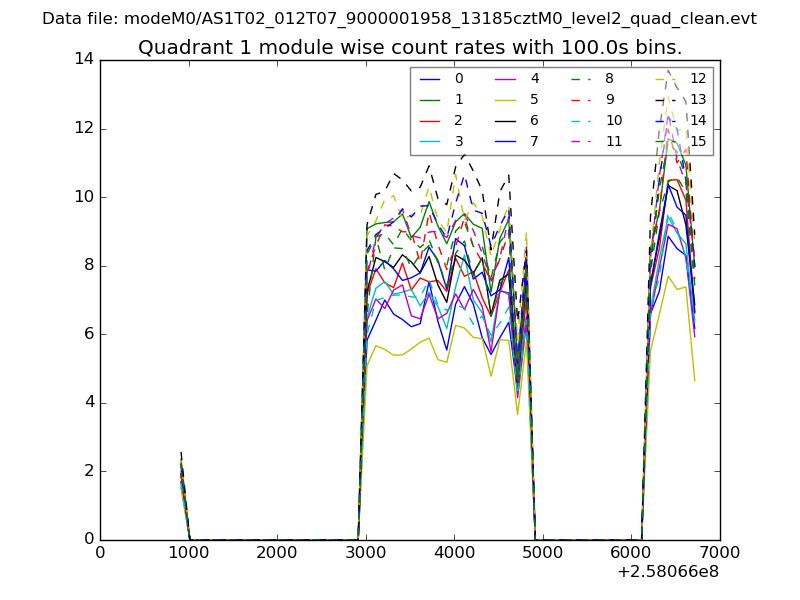 |
 |
| Module-wise count rates for Quadrant C Data is divided into 100 sec bins |
 |
 |
| Module-wise count rates for Quadrant D Data is divided into 100 sec bins |
 |
 |
| Parameter | Plot |
|---|---|
| CZT HV Monitor | 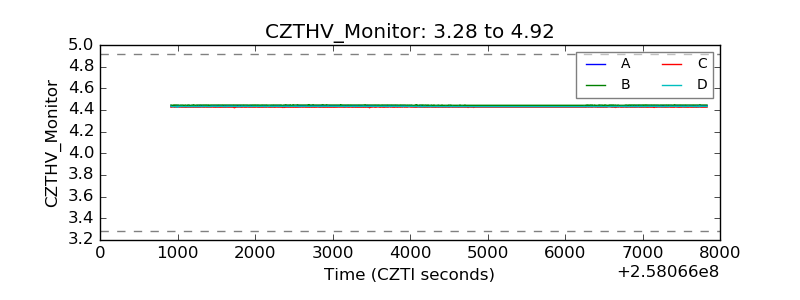 |
| D_VDD | 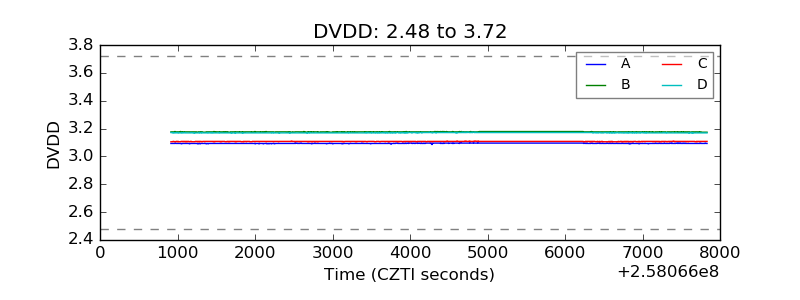 |
| Temperature 1 | 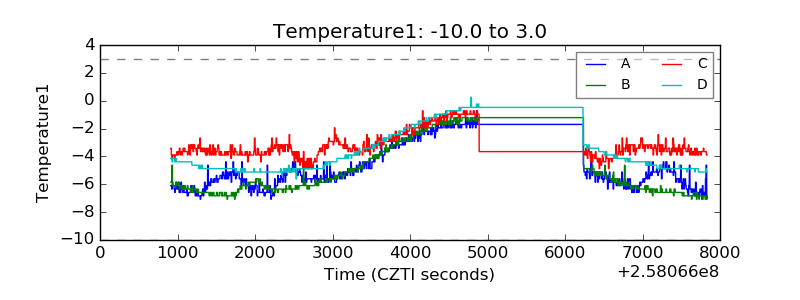 |
| Veto HV Monitor | 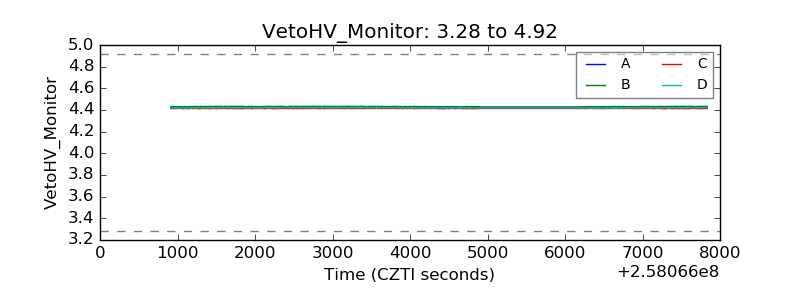 |
| Veto LLD |  |
| Alpha Counter | 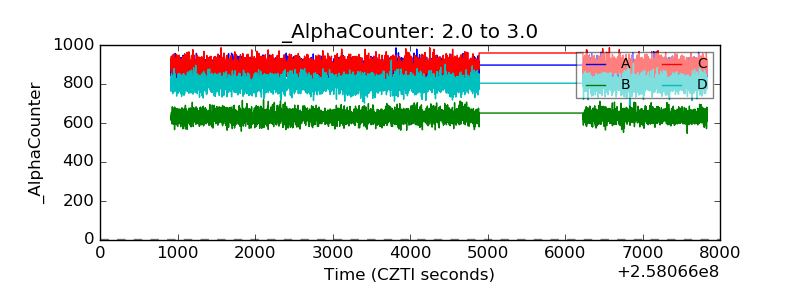 |
| _CPM_Rate | 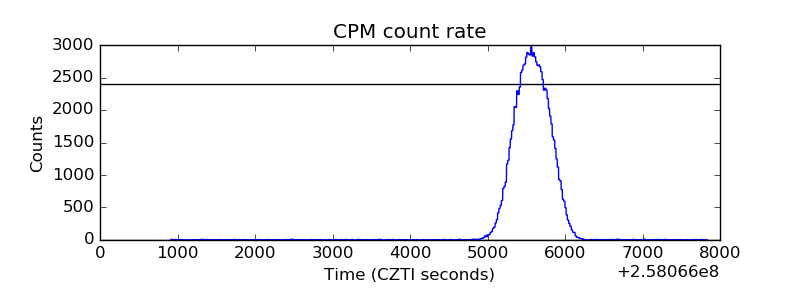 |
| CZT Counter | 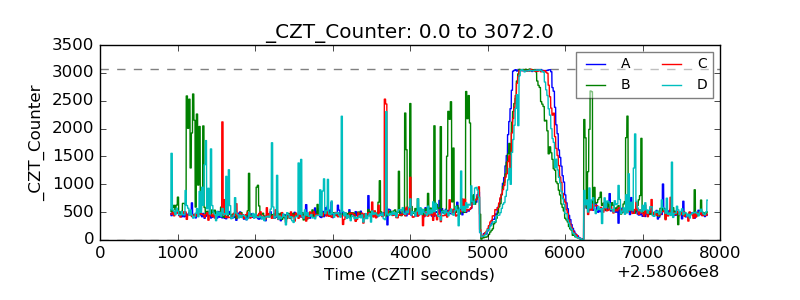 |
| +2.5 Volts monitor |  |
| +5 Volts monitor |  |
| _ROLL_ROT |  |
| _Roll_DEC | 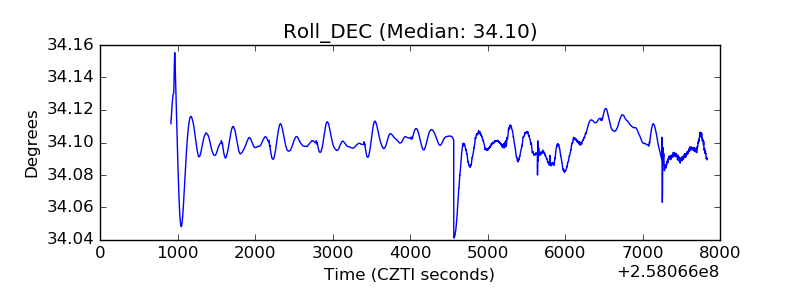 |
| _Roll_RA | 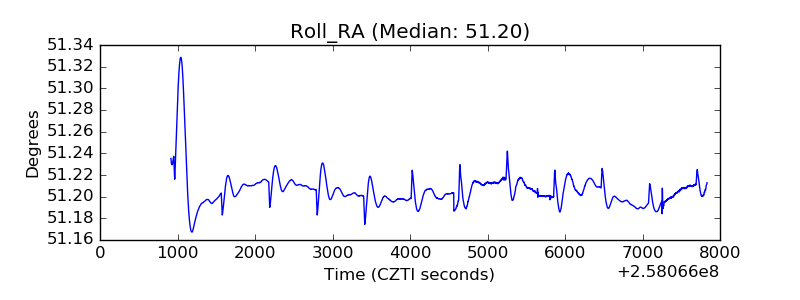 |
| Veto Counter | 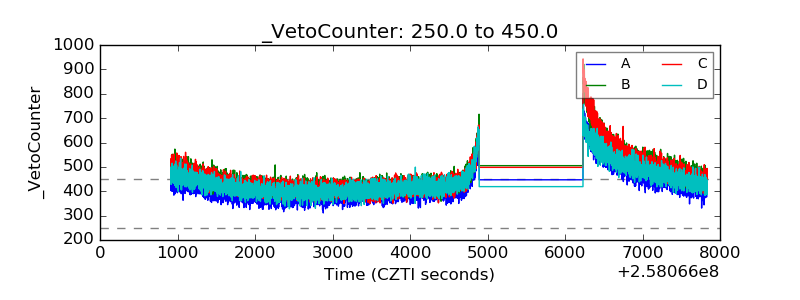 |