| Param | Original file | Final file |
|---|---|---|
| Filename | modeM0/AS1T02_012T07_9000001958_13186cztM0_level2.evt | modeM0/AS1T02_012T07_9000001958_13186cztM0_level2_quad_clean.evt |
| Size (bytes) | 580,345,920 | 67,262,400 |
| Size | 553.5 MB | 64.1 MB |
| Events in quadrant A | 3,319,872 | 421,601 |
| Events in quadrant B | 4,537,011 | 394,500 |
| Events in quadrant C | 3,129,061 | 420,988 |
| Events in quadrant D | 6,155,512 | 351,909 |
| Mode M0 | |||
|---|---|---|---|
| Quadrant | BADHDUFLAG | Total packets | Discarded packets |
| A | 0 | 13735 | 3 |
| B | 0 | 17504 | 2 |
| C | 0 | 13320 | 2 |
| D | 0 | 22547 | 2 |
| Mode M9 | |||
|---|---|---|---|
| Quadrant | BADHDUFLAG | Total packets | Discarded packets |
| A | 0 | 17 | 0 |
| B | 0 | 17 | 0 |
| C | 0 | 17 | 0 |
| D | 0 | 18 | 0 |
| Mode SS | |||
|---|---|---|---|
| Quadrant | BADHDUFLAG | Total packets | Discarded packets |
| A | 0 | 130 | 0 |
| B | 0 | 130 | 0 |
| C | 0 | 130 | 0 |
| D | 0 | 130 | 0 |
| Quadrant | Total seconds | Saturated seconds | Saturation percentage |
|---|---|---|---|
| A | 6407 | 26 | 0.405806% |
| B | 6407 | 568 | 8.865304% |
| C | 6407 | 20 | 0.312159% |
| D | 6407 | 1044 | 16.294678% |
Noise dominated data is calculated using 1-second bins in cleaned event files. If a bin has >2000 counts, and if more than 50% of those come from <1% of pixels, then it is considered to be noise-dominated and hence unusable.
| Quadrant | # 1 sec bins | Bins with >0 counts | Bins with >2000 counts | High rate bins dominated by noise | Noise dominated (total time) | Noise dominated (detector-on time) | Marked lightcurve |
|---|---|---|---|---|---|---|---|
| A | 7753 | 6409 | 0 | 0 | 0.00% | 0.00% | 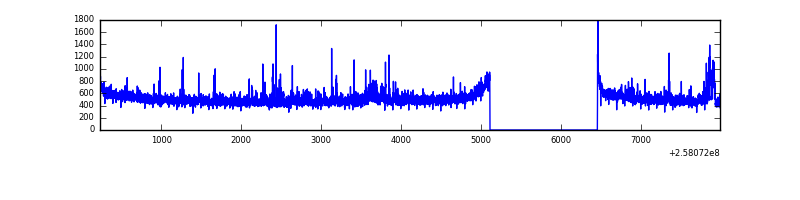 |
| B | 7753 | 6409 | 359 | 359 | 4.63% | 5.60% | 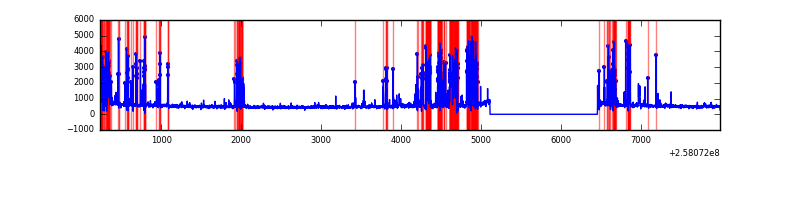 |
| C | 7753 | 6409 | 2 | 2 | 0.03% | 0.03% | 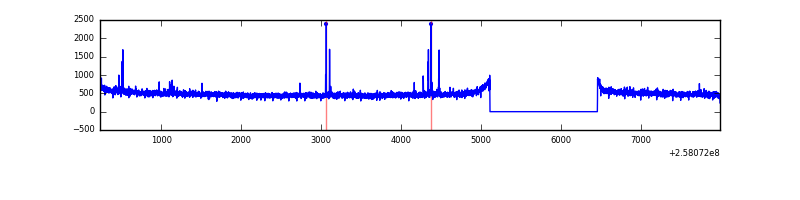 |
| D | 7753 | 6409 | 728 | 728 | 9.39% | 11.36% | 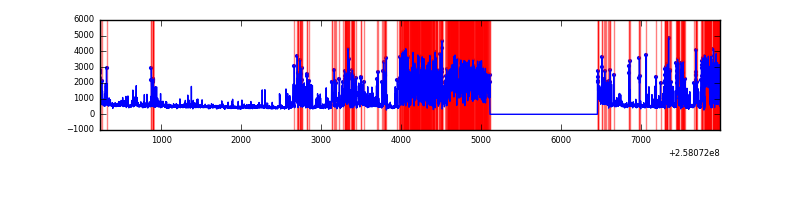 |
Top three noisy pixels from each quadrant. If the there are fewer than three noisy pixels in the level2.evt file, extra rows are filled as -1
| Pixel properties | Quadrant properties | ||||||
|---|---|---|---|---|---|---|---|
| Quadrant | DetID | PixID | Counts | Sigma | Mean | Median | Sigma |
| A | 12 | 189 | 161250 | 992.07 | 807 | 792 | 161.7 |
| A | 1 | 162 | 14521 | 84.88 | 807 | 792 | 161.7 |
| A | 9 | 143 | 11186 | 64.26 | 807 | 792 | 161.7 |
| B | 4 | 239 | 1337030 | 9213.42 | 779 | 762 | 145.0 |
| B | 3 | 64 | 55034 | 374.2 | 779 | 762 | 145.0 |
| B | 0 | 218 | 34606 | 233.35 | 779 | 762 | 145.0 |
| C | 15 | 208 | 41202 | 223.01 | 792 | 798 | 181.2 |
| C | 13 | 61 | 5708 | 27.1 | 792 | 798 | 181.2 |
| C | 3 | 202 | 1978 | 6.51 | 792 | 798 | 181.2 |
| D | 13 | 122 | 2992218 | 17167.89 | 728 | 708 | 174.3 |
| D | 1 | 52 | 236549 | 1353.46 | 728 | 708 | 174.3 |
| D | 10 | 157 | 50047 | 283.15 | 728 | 708 | 174.3 |
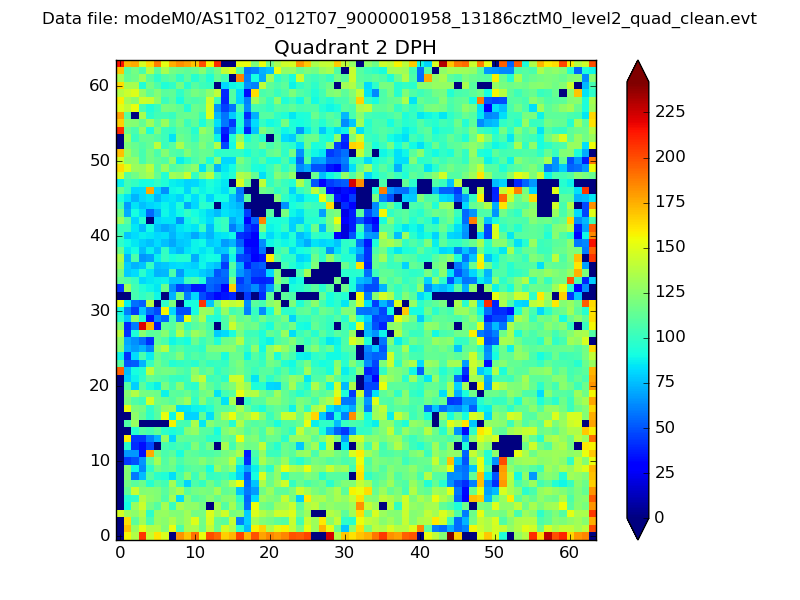
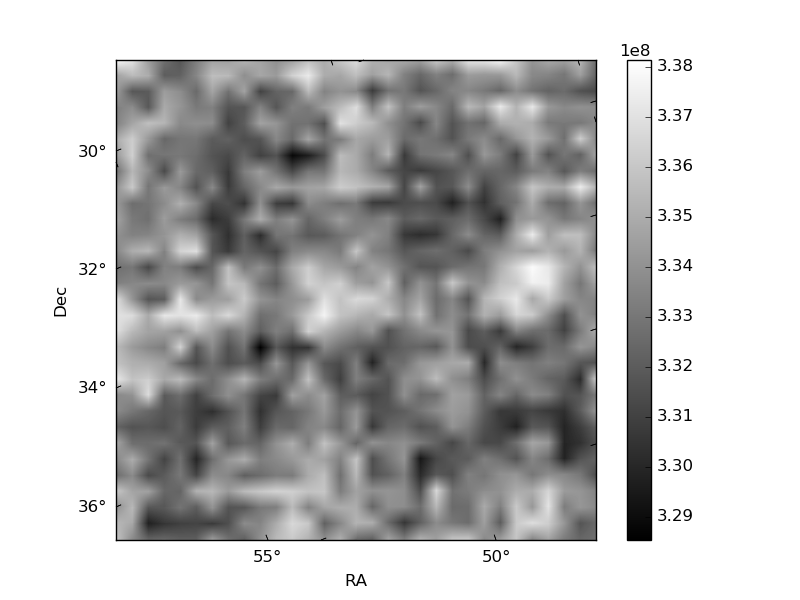
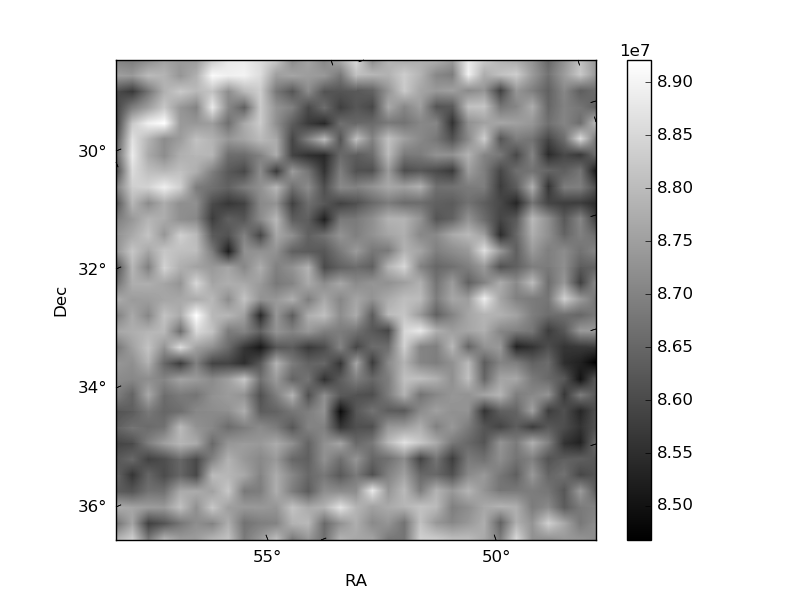
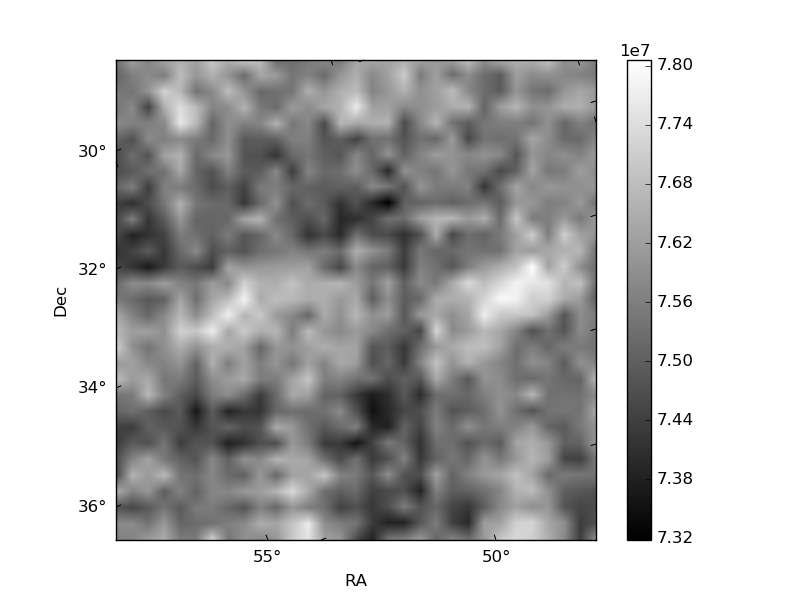
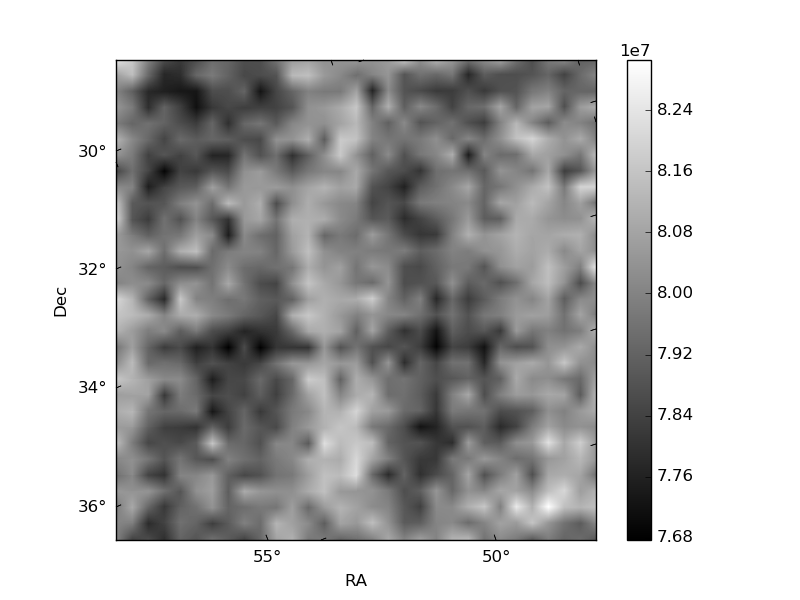
Histogram calculated using DETX and DETY for each event in the final _common_clean file
| Quadrant A | 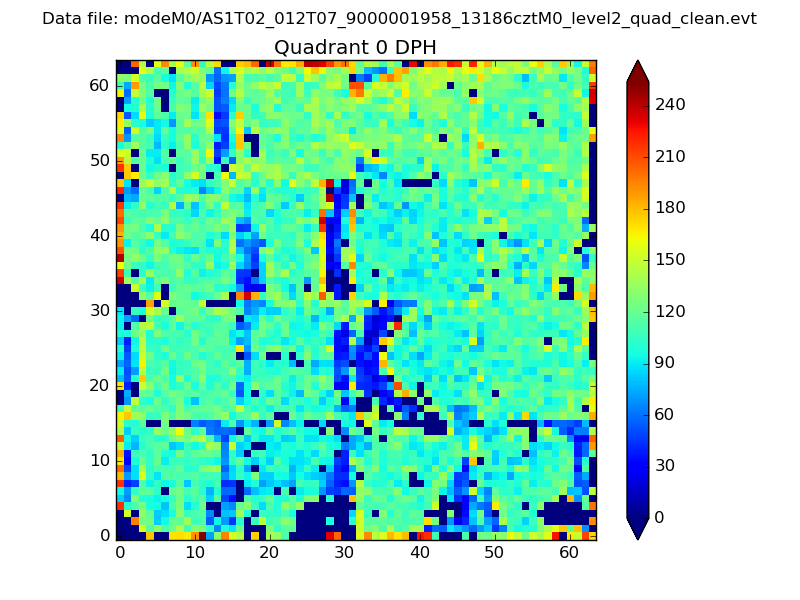 |
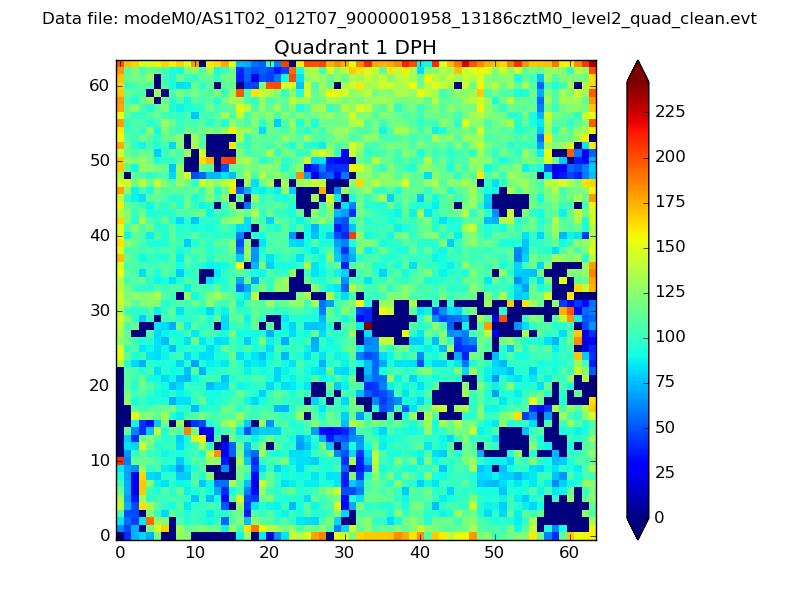 |
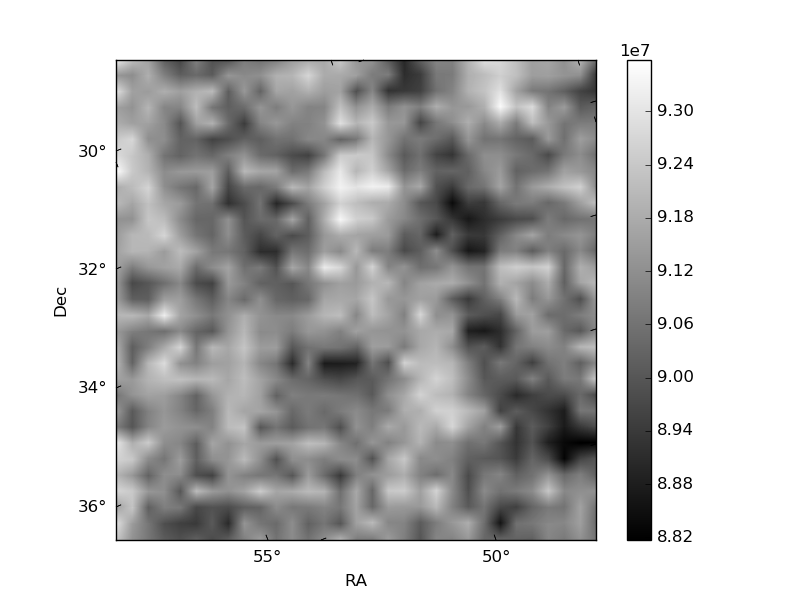
Quadrant B |
|---|---|---|---|
| Quadrant D | 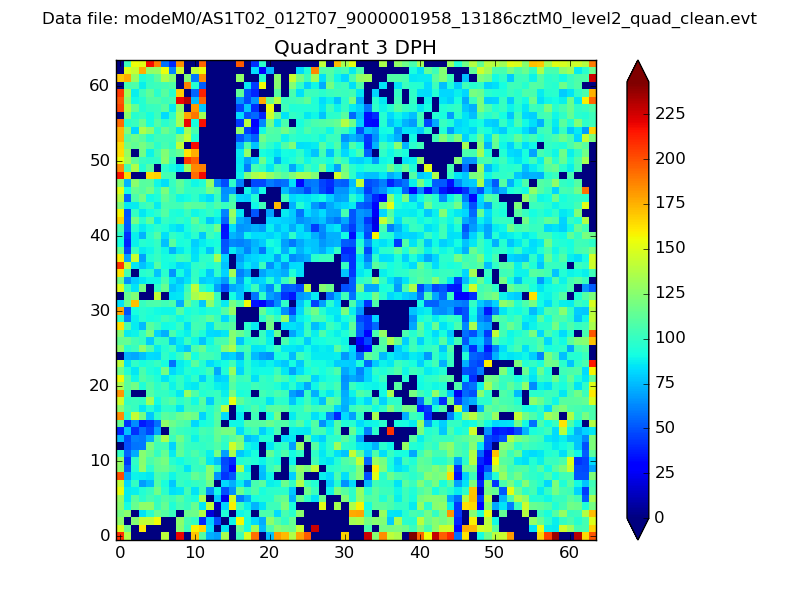 |
 |
Quadrant C |
| Plot type | Count rate plots | Images |
|---|---|---|
| Comparison with Poisson distribution Blue bars denote a histogram of data divided into 1 sec bins. Red curve is a Poisson curve with rate = median count rate of data. |
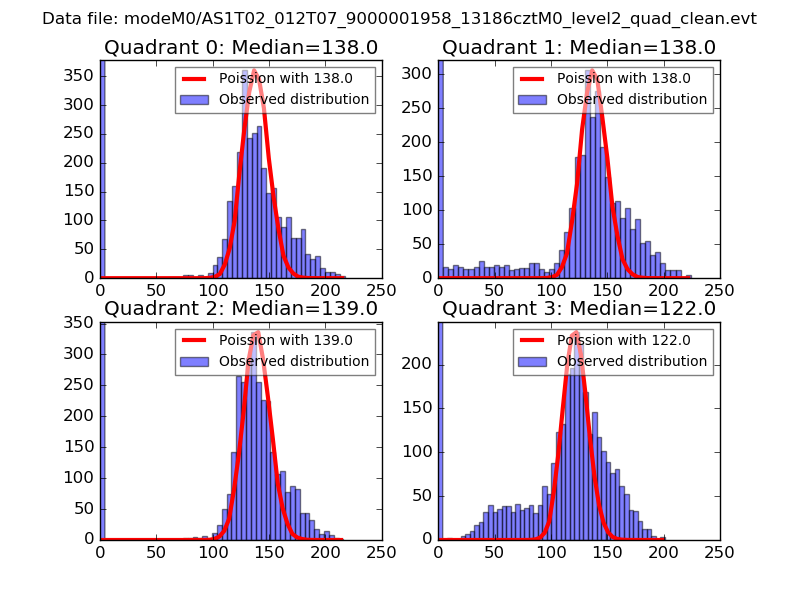 |
 |
| Quadrant-wise count rates Data is divided into 100 sec bins |
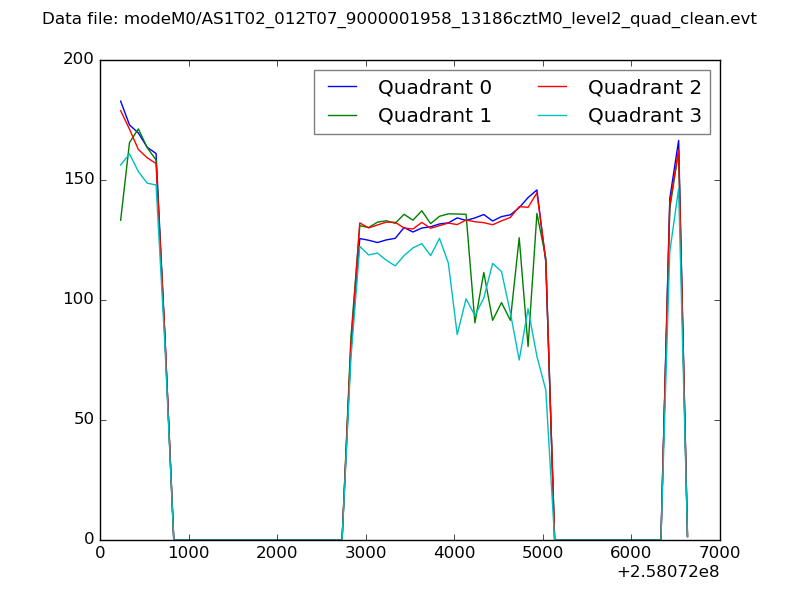 |
|
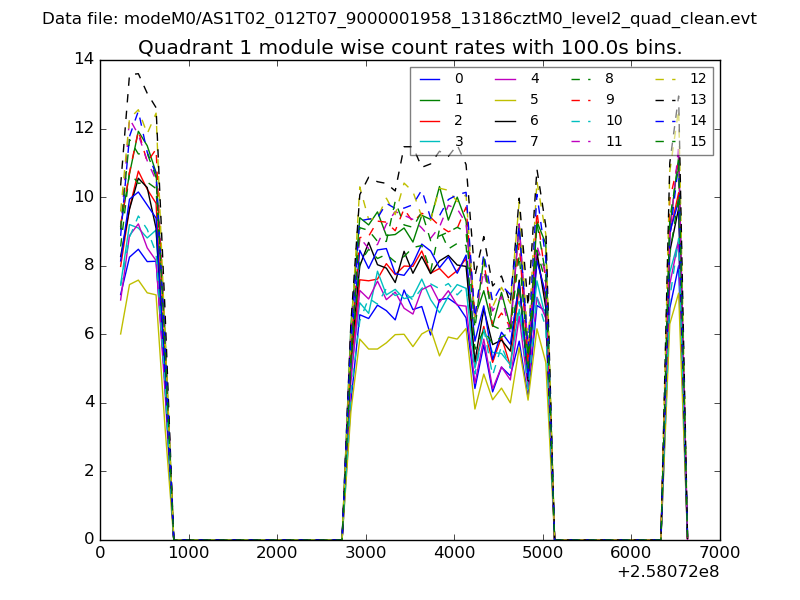
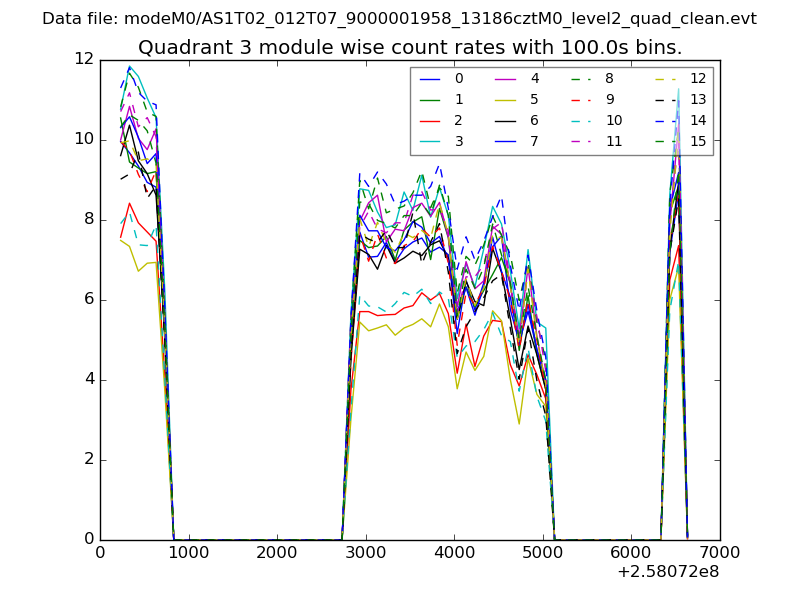
| Module-wise count rates for Quadrant A Data is divided into 100 sec bins |
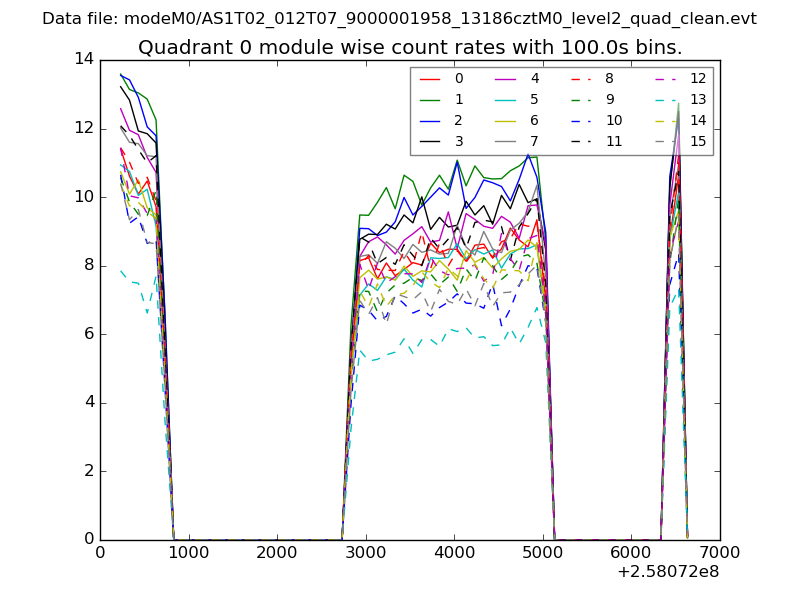 |
 |
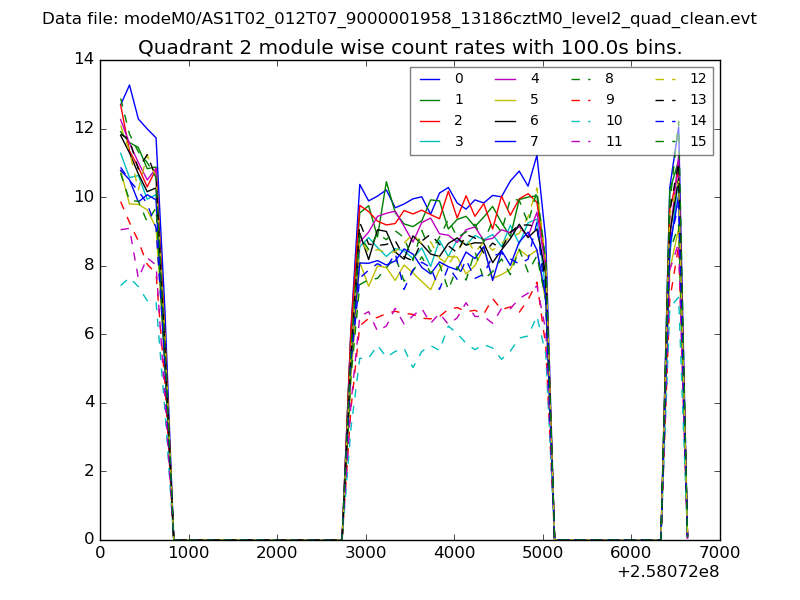
| Module-wise count rates for Quadrant B Data is divided into 100 sec bins |
 |
 |
| Module-wise count rates for Quadrant C Data is divided into 100 sec bins |
 |
 |
| Module-wise count rates for Quadrant D Data is divided into 100 sec bins |
 |
 |
| Parameter | Plot |
|---|---|
| CZT HV Monitor | 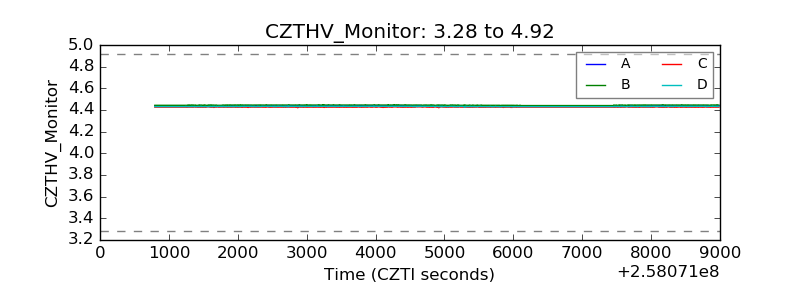 |
| D_VDD | 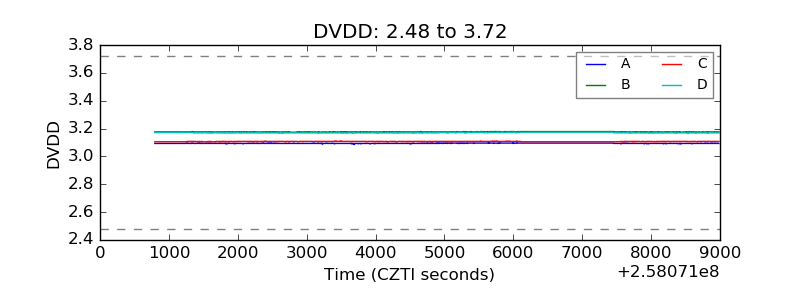 |
| Temperature 1 | 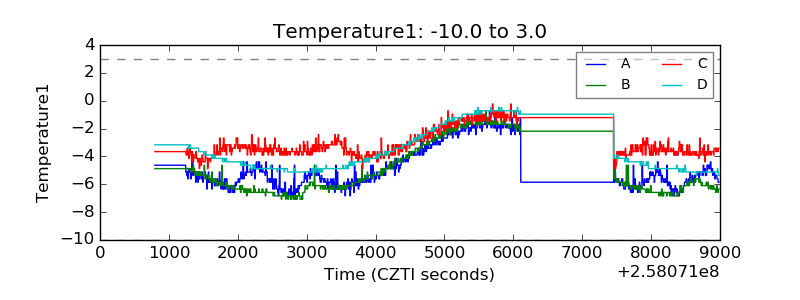 |
| Veto HV Monitor | 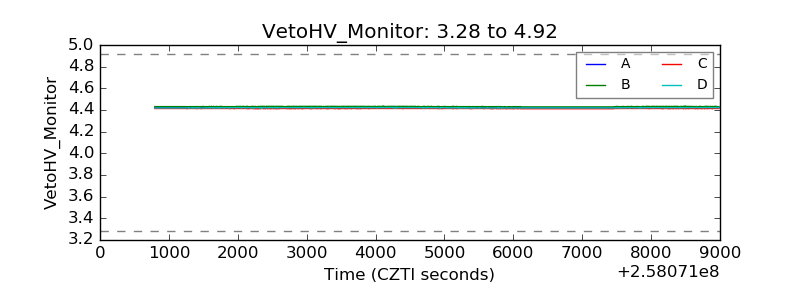 |
| Veto LLD | 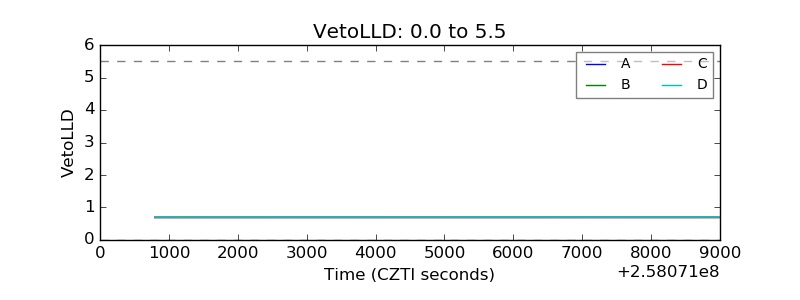 |
| Alpha Counter | 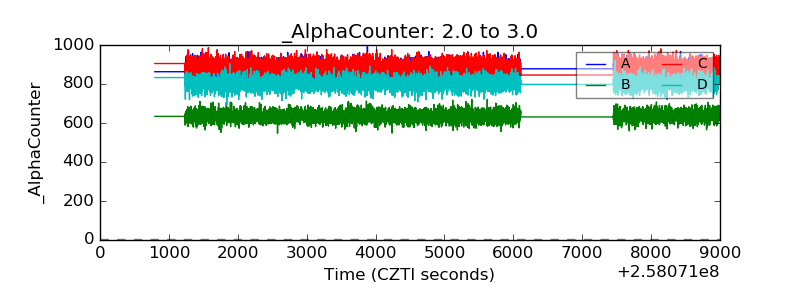 |
| _CPM_Rate | 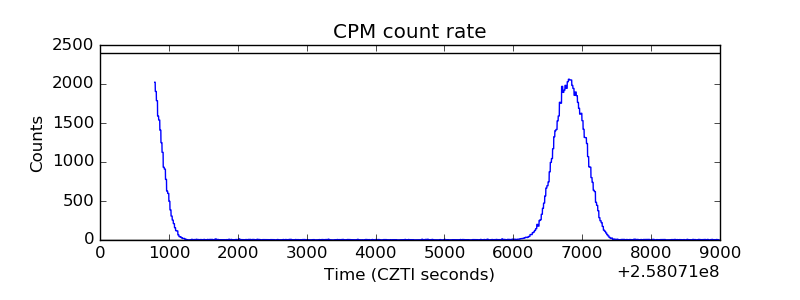 |
| CZT Counter | 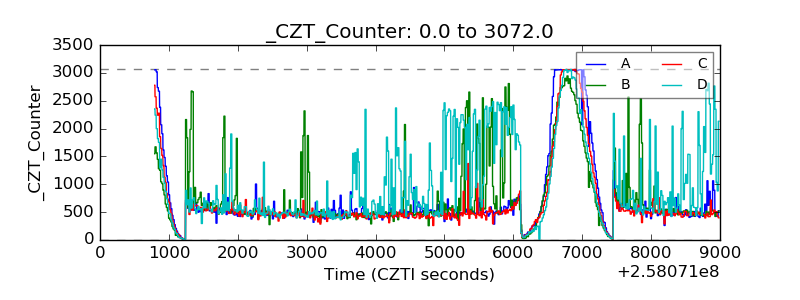 |
| +2.5 Volts monitor | 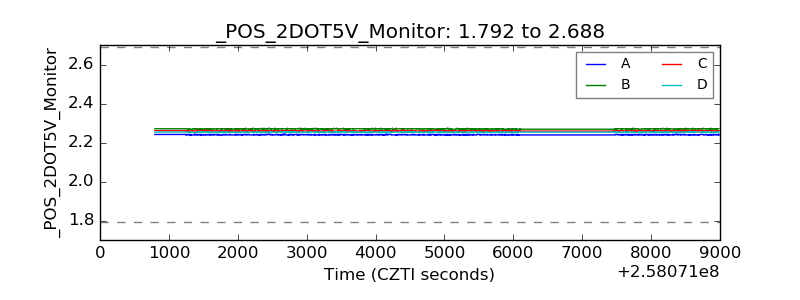 |
| +5 Volts monitor | 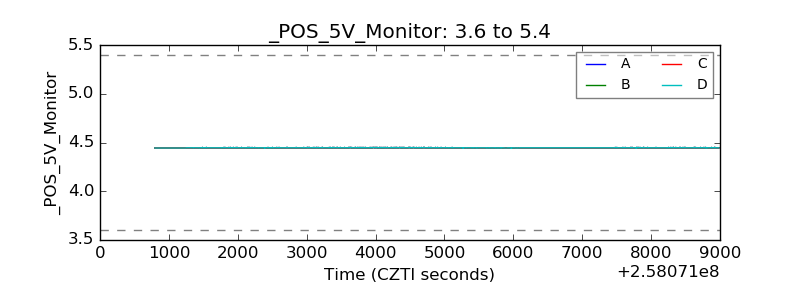 |
| _ROLL_ROT | 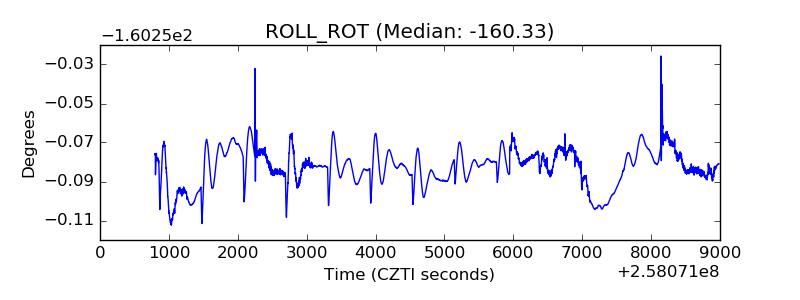 |
| _Roll_DEC | 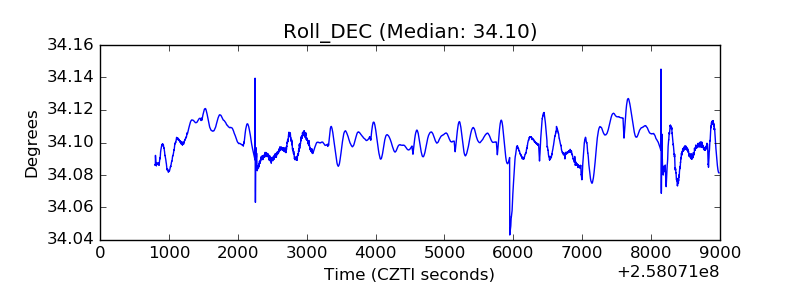 |
| _Roll_RA | 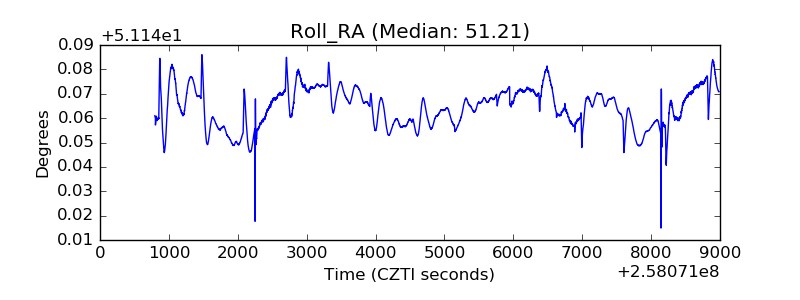 |
| Veto Counter | 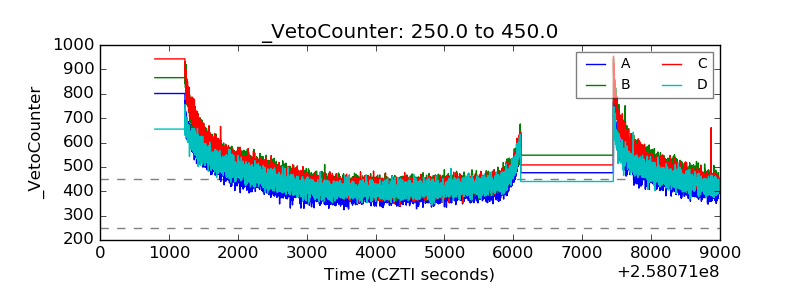 |