| Param | Original file | Final file |
|---|---|---|
| Filename | modeM0/AS1T02_012T07_9000001958_13188cztM0_level2.evt | modeM0/AS1T02_012T07_9000001958_13188cztM0_level2_quad_clean.evt |
| Size (bytes) | 538,436,160 | 70,879,680 |
| Size | 513.5 MB | 67.6 MB |
| Events in quadrant A | 3,299,329 | 436,176 |
| Events in quadrant B | 4,620,597 | 394,642 |
| Events in quadrant C | 3,128,469 | 435,878 |
| Events in quadrant D | 4,803,208 | 411,971 |
| Mode M0 | |||
|---|---|---|---|
| Quadrant | BADHDUFLAG | Total packets | Discarded packets |
| A | 0 | 14094 | 3 |
| B | 0 | 17976 | 2 |
| C | 0 | 13842 | 2 |
| D | 0 | 18749 | 2 |
| Mode M9 | |||
|---|---|---|---|
| Quadrant | BADHDUFLAG | Total packets | Discarded packets |
| A | 0 | 19 | 0 |
| B | 0 | 19 | 0 |
| C | 0 | 19 | 0 |
| D | 0 | 20 | 0 |
| Mode SS | |||
|---|---|---|---|
| Quadrant | BADHDUFLAG | Total packets | Discarded packets |
| A | 0 | 134 | 0 |
| B | 0 | 134 | 0 |
| C | 0 | 134 | 0 |
| D | 0 | 134 | 0 |
| Quadrant | Total seconds | Saturated seconds | Saturation percentage |
|---|---|---|---|
| A | 6710 | 140 | 2.086438% |
| B | 6710 | 725 | 10.804769% |
| C | 6710 | 79 | 1.177347% |
| D | 6710 | 319 | 4.754098% |
Noise dominated data is calculated using 1-second bins in cleaned event files. If a bin has >2000 counts, and if more than 50% of those come from <1% of pixels, then it is considered to be noise-dominated and hence unusable.
| Quadrant | # 1 sec bins | Bins with >0 counts | Bins with >2000 counts | High rate bins dominated by noise | Noise dominated (total time) | Noise dominated (detector-on time) | Marked lightcurve |
|---|---|---|---|---|---|---|---|
| A | 7636 | 6713 | 14 | 14 | 0.18% | 0.21% | 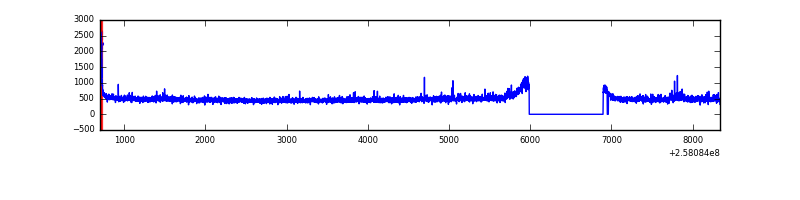 |
| B | 7636 | 6713 | 343 | 343 | 4.49% | 5.11% | 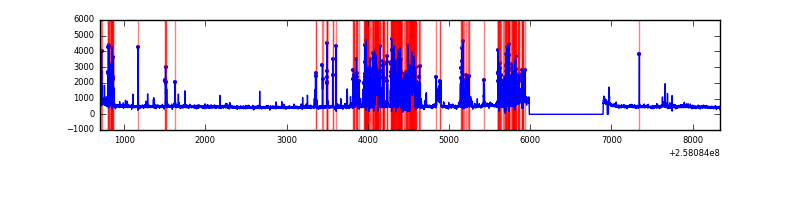 |
| C | 7636 | 6713 | 0 | 0 | 0.00% | 0.00% | 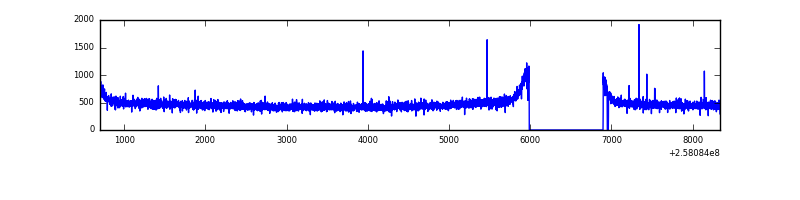 |
| D | 7636 | 6713 | 173 | 173 | 2.27% | 2.58% | 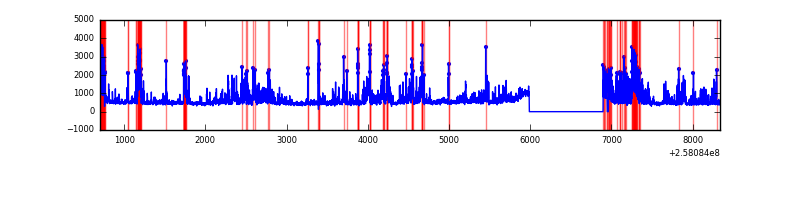 |
Top three noisy pixels from each quadrant. If the there are fewer than three noisy pixels in the level2.evt file, extra rows are filled as -1
| Pixel properties | Quadrant properties | ||||||
|---|---|---|---|---|---|---|---|
| Quadrant | DetID | PixID | Counts | Sigma | Mean | Median | Sigma |
| A | 8 | 15 | 79242 | 475.81 | 815 | 796 | 164.9 |
| A | 8 | 192 | 47028 | 280.42 | 815 | 796 | 164.9 |
| A | 12 | 189 | 31694 | 187.41 | 815 | 796 | 164.9 |
| B | 4 | 239 | 1387877 | 9325.61 | 780 | 761 | 148.7 |
| B | 0 | 219 | 76893 | 511.84 | 780 | 761 | 148.7 |
| B | 3 | 209 | 34478 | 226.68 | 780 | 761 | 148.7 |
| C | 15 | 208 | 7088 | 34.01 | 799 | 804 | 184.7 |
| C | 13 | 61 | 5851 | 27.32 | 799 | 804 | 184.7 |
| C | 12 | 4 | 3006 | 11.92 | 799 | 804 | 184.7 |
| D | 13 | 122 | 1027186 | 5431.82 | 780 | 757 | 189.0 |
| D | 1 | 52 | 411664 | 2174.5 | 780 | 757 | 189.0 |
| D | 10 | 157 | 224848 | 1185.88 | 780 | 757 | 189.0 |
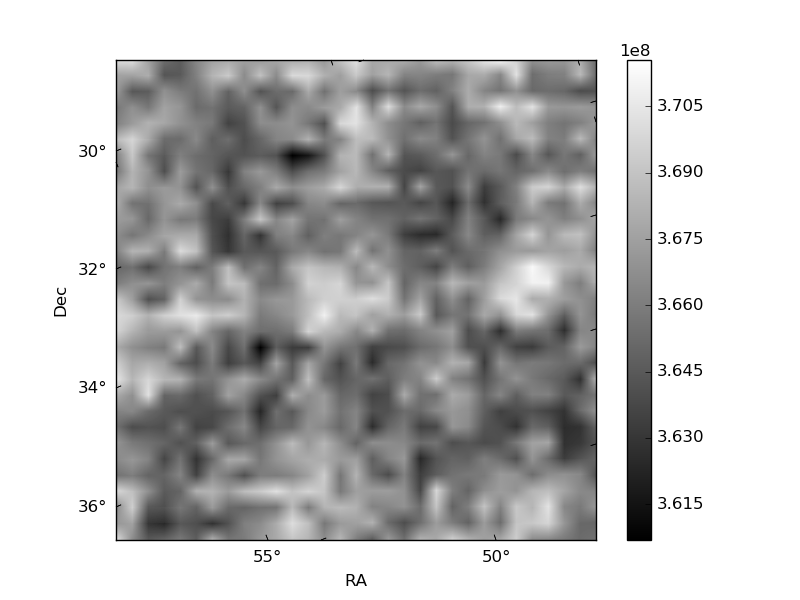
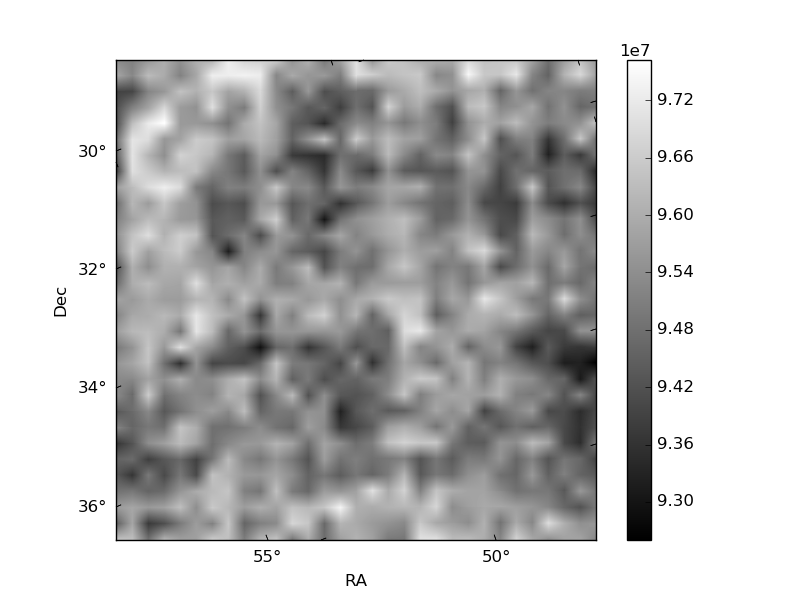
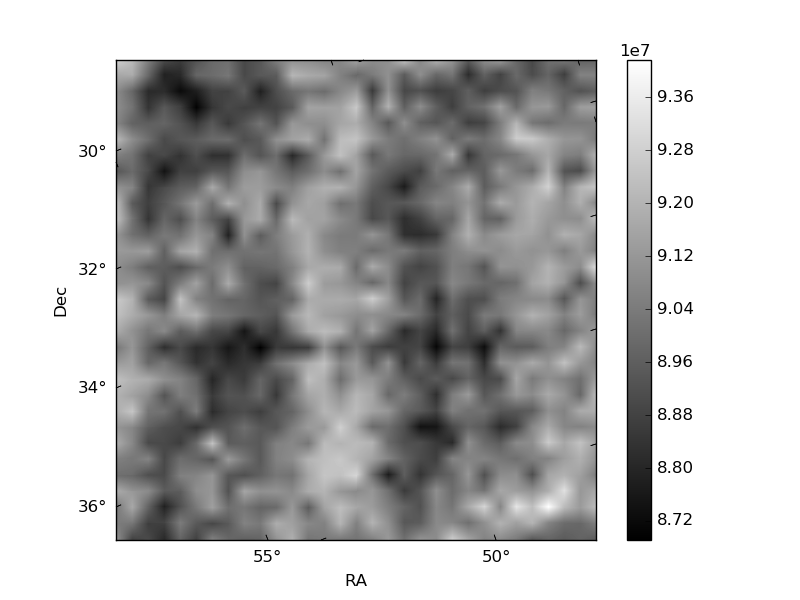
Histogram calculated using DETX and DETY for each event in the final _common_clean file
| Quadrant A | 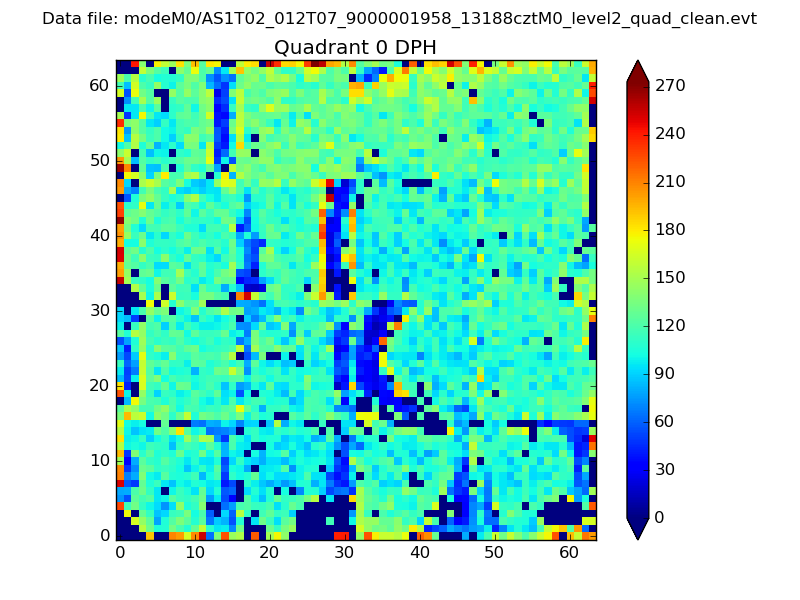 |
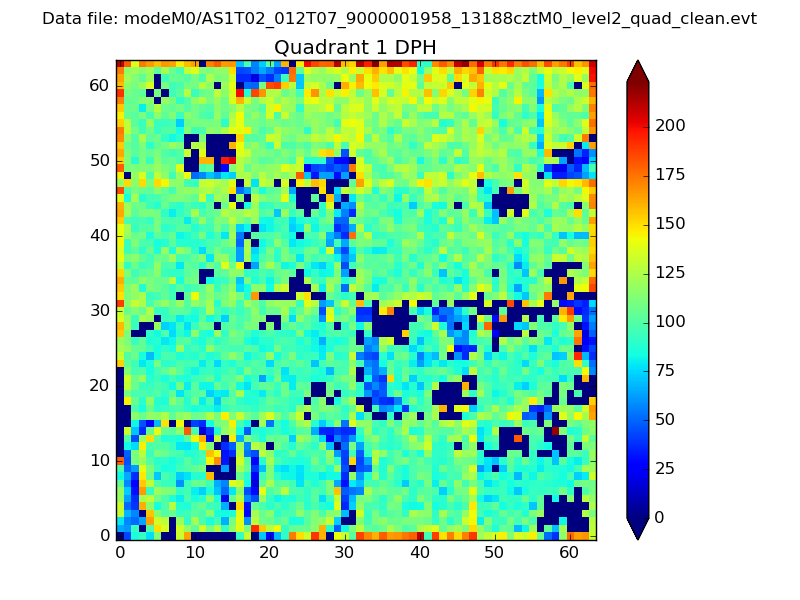 |
Quadrant B |
|---|---|---|---|
| Quadrant D | 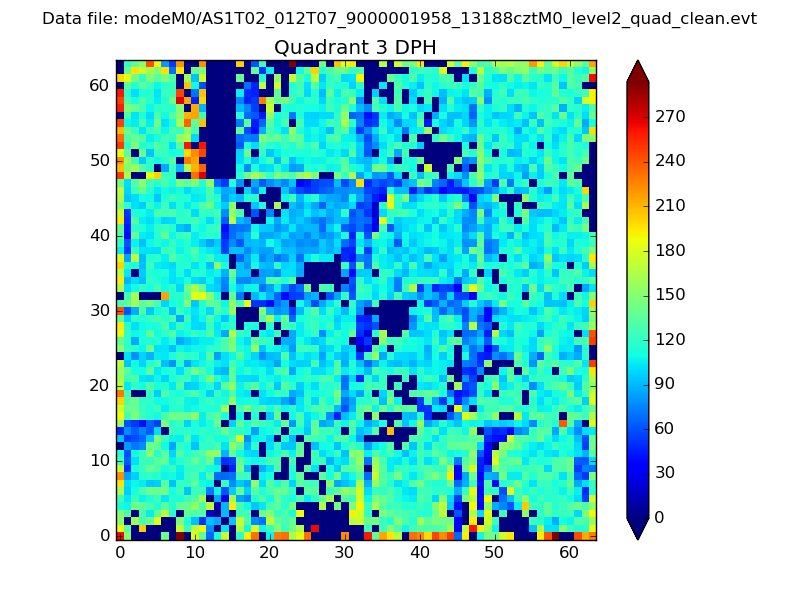 |
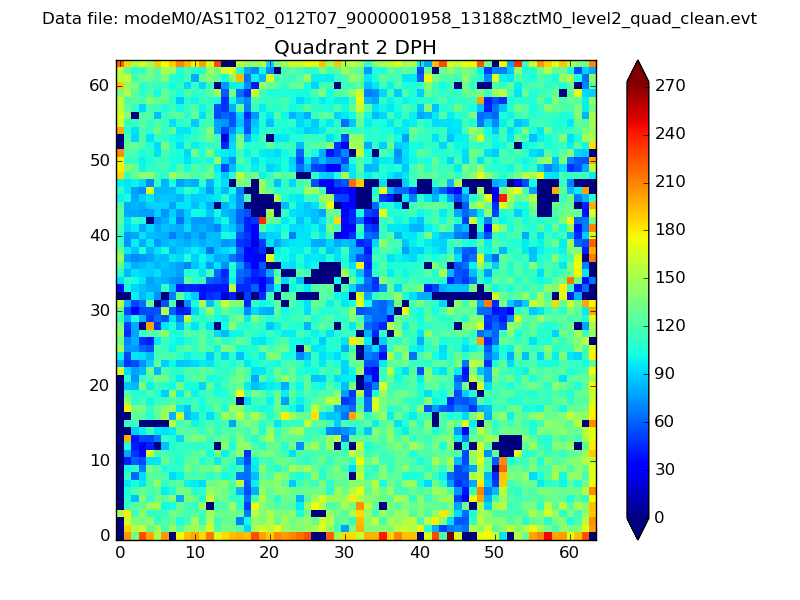 |
Quadrant C |
| Plot type | Count rate plots | Images |
|---|---|---|
| Comparison with Poisson distribution Blue bars denote a histogram of data divided into 1 sec bins. Red curve is a Poisson curve with rate = median count rate of data. |
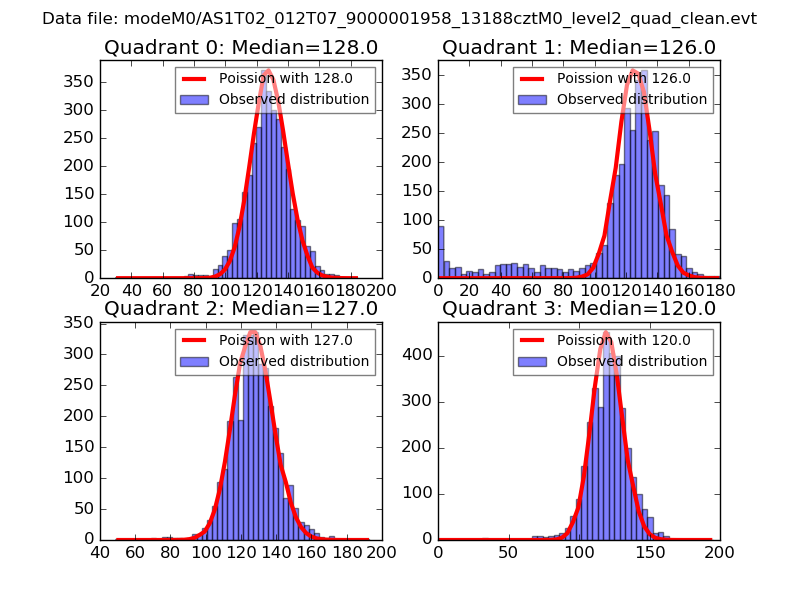 |
 |
| Quadrant-wise count rates Data is divided into 100 sec bins |
 |
|
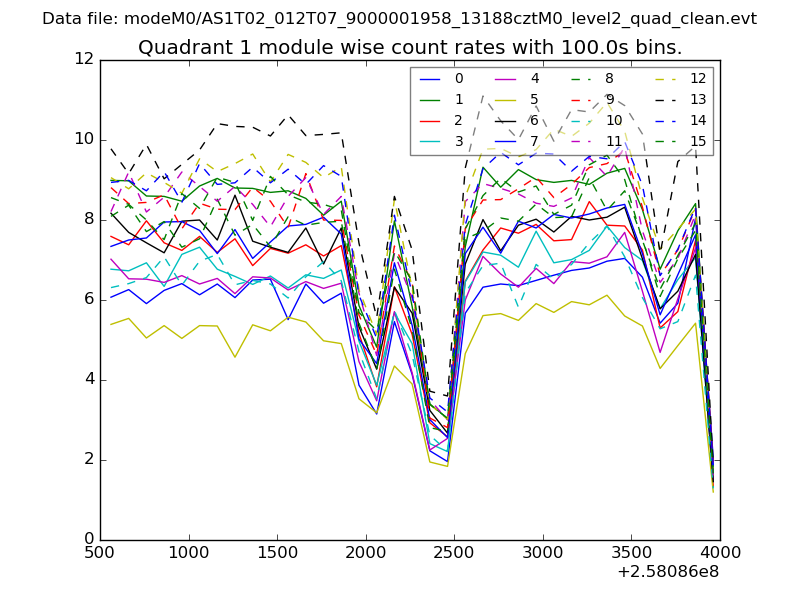
| Module-wise count rates for Quadrant A Data is divided into 100 sec bins |
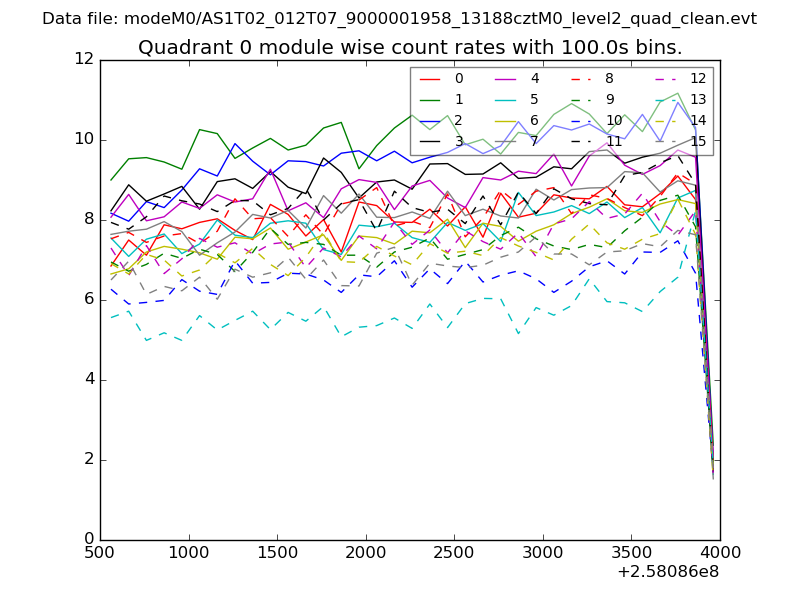 |
 |
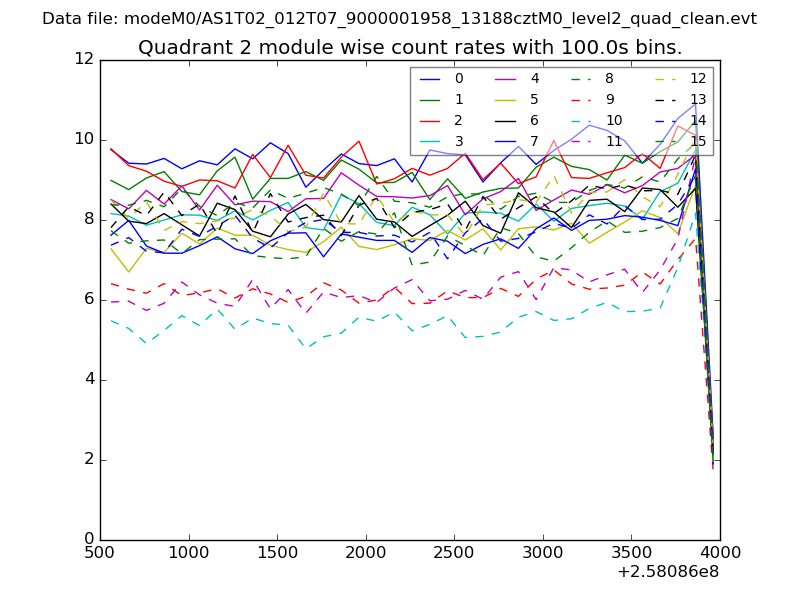
| Module-wise count rates for Quadrant B Data is divided into 100 sec bins |
 |
 |
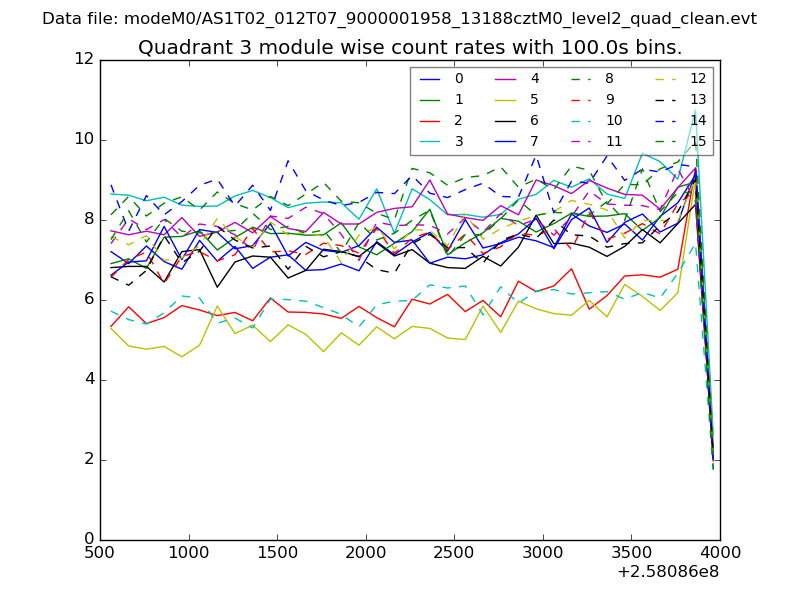
| Module-wise count rates for Quadrant C Data is divided into 100 sec bins |
 |
 |
| Module-wise count rates for Quadrant D Data is divided into 100 sec bins |
 |
 |
| Parameter | Plot |
|---|---|
| CZT HV Monitor | 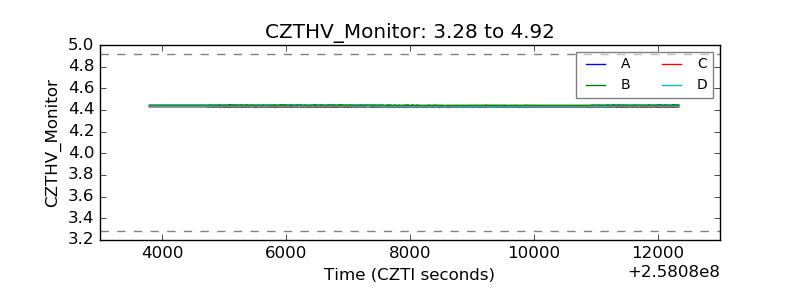 |
| D_VDD | 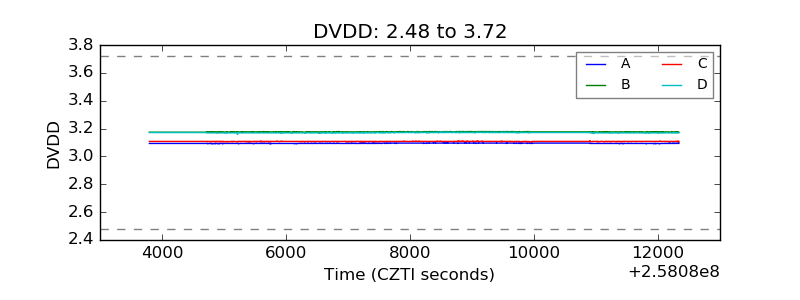 |
| Temperature 1 | 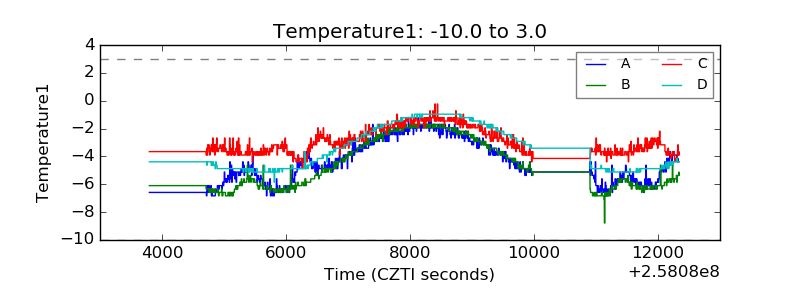 |
| Veto HV Monitor | 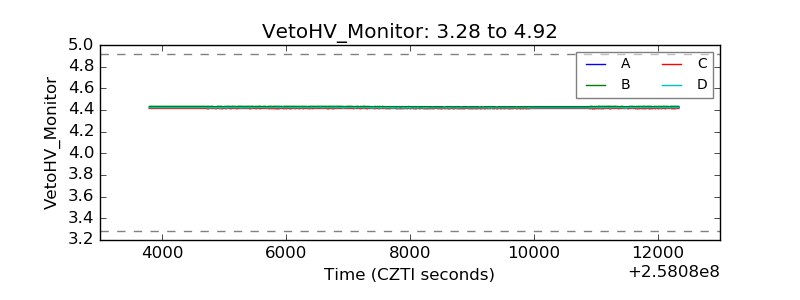 |
| Veto LLD | 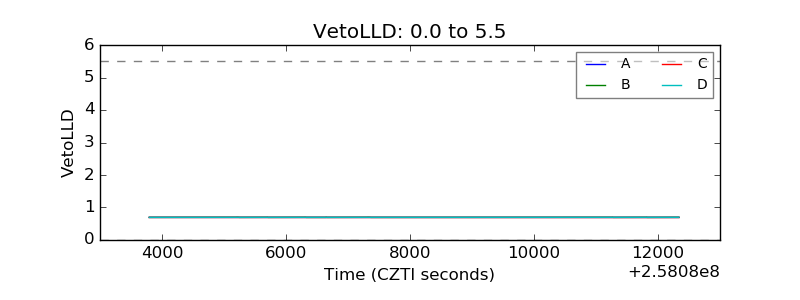 |
| Alpha Counter |  |
| _CPM_Rate |  |
| CZT Counter | 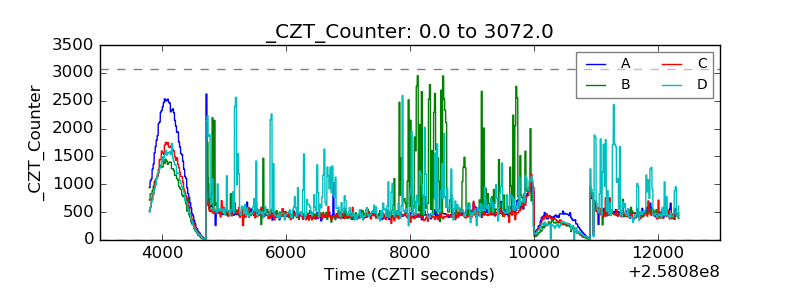 |
| +2.5 Volts monitor |  |
| +5 Volts monitor |  |
| _ROLL_ROT | 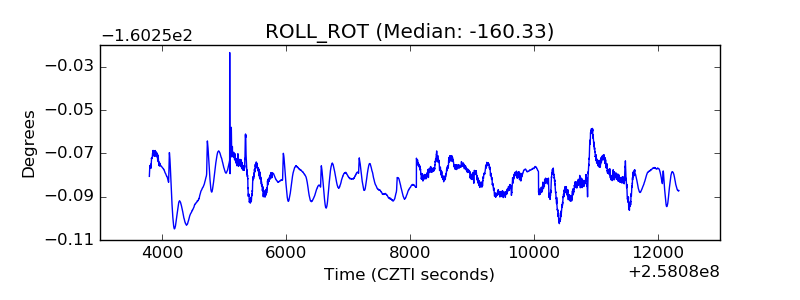 |
| _Roll_DEC | 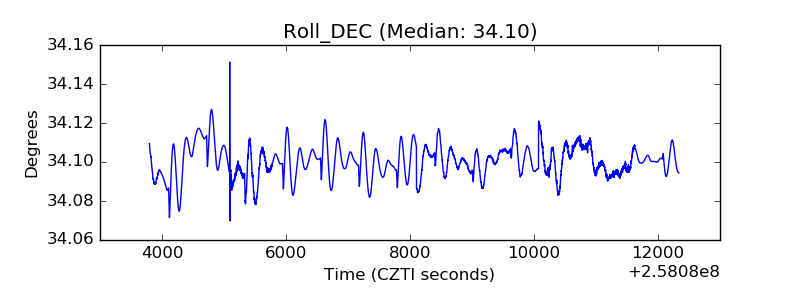 |
| _Roll_RA | 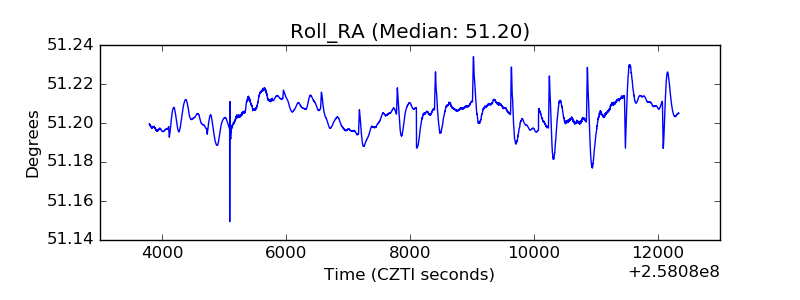 |
| Veto Counter | 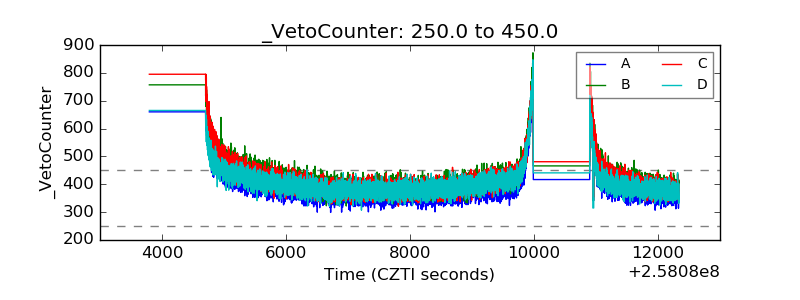 |