| Param | Original file | Final file |
|---|---|---|
| Filename | modeM0/AS1T02_012T07_9000001958_13189cztM0_level2.evt | modeM0/AS1T02_012T07_9000001958_13189cztM0_level2_quad_clean.evt |
| Size (bytes) | 355,654,080 | 59,189,760 |
| Size | 339.2 MB | 56.4 MB |
| Events in quadrant A | 2,250,356 | 377,561 |
| Events in quadrant B | 2,811,334 | 357,621 |
| Events in quadrant C | 2,026,190 | 376,373 |
| Events in quadrant D | 3,368,344 | 355,912 |
| Mode M0 | |||
|---|---|---|---|
| Quadrant | BADHDUFLAG | Total packets | Discarded packets |
| A | 0 | 9676 | 1 |
| B | 0 | 11384 | 1 |
| C | 0 | 9377 | 1 |
| D | 0 | 13145 | 1 |
| Mode M9 | |||
|---|---|---|---|
| Quadrant | BADHDUFLAG | Total packets | Discarded packets |
| A | 0 | 10 | 0 |
| B | 0 | 10 | 0 |
| C | 0 | 10 | 0 |
| D | 0 | 10 | 0 |
| Mode SS | |||
|---|---|---|---|
| Quadrant | BADHDUFLAG | Total packets | Discarded packets |
| A | 0 | 94 | 0 |
| B | 0 | 94 | 0 |
| C | 0 | 94 | 0 |
| D | 0 | 94 | 0 |
| Quadrant | Total seconds | Saturated seconds | Saturation percentage |
|---|---|---|---|
| A | 4619 | 48 | 1.039186% |
| B | 4619 | 360 | 7.793895% |
| C | 4619 | 33 | 0.714440% |
| D | 4619 | 216 | 4.676337% |
Noise dominated data is calculated using 1-second bins in cleaned event files. If a bin has >2000 counts, and if more than 50% of those come from <1% of pixels, then it is considered to be noise-dominated and hence unusable.
| Quadrant | # 1 sec bins | Bins with >0 counts | Bins with >2000 counts | High rate bins dominated by noise | Noise dominated (total time) | Noise dominated (detector-on time) | Marked lightcurve |
|---|---|---|---|---|---|---|---|
| A | 5545 | 4622 | 0 | 0 | 0.00% | 0.00% | 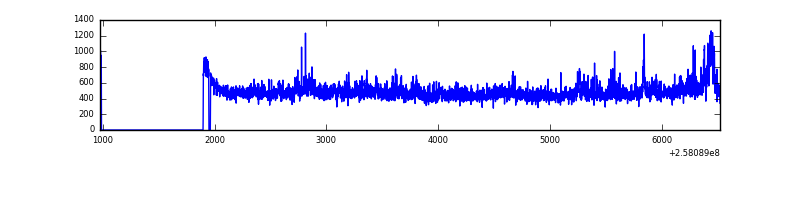 |
| B | 5545 | 4622 | 164 | 164 | 2.96% | 3.55% | 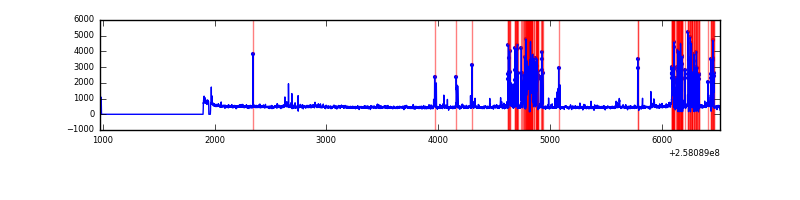 |
| C | 5545 | 4622 | 1 | 1 | 0.02% | 0.02% | 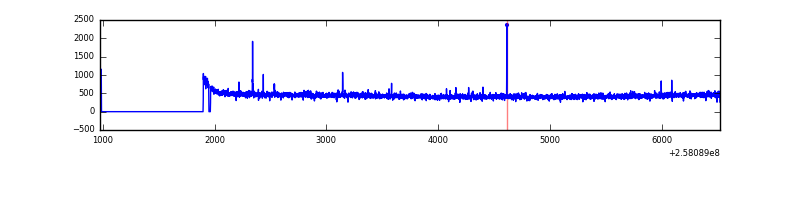 |
| D | 5545 | 4622 | 151 | 151 | 2.72% | 3.27% | 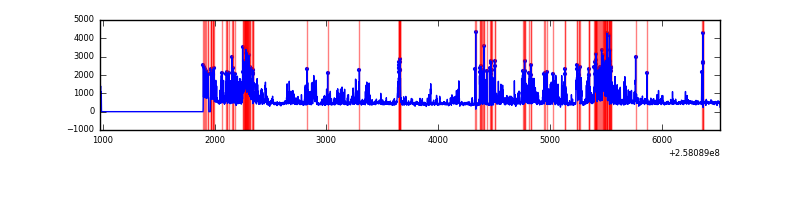 |
Top three noisy pixels from each quadrant. If the there are fewer than three noisy pixels in the level2.evt file, extra rows are filled as -1
| Pixel properties | Quadrant properties | ||||||
|---|---|---|---|---|---|---|---|
| Quadrant | DetID | PixID | Counts | Sigma | Mean | Median | Sigma |
| A | 8 | 15 | 152743 | 1394.17 | 532 | 520 | 109.2 |
| A | 12 | 189 | 35014 | 315.92 | 532 | 520 | 109.2 |
| A | 1 | 162 | 7955 | 68.1 | 532 | 520 | 109.2 |
| B | 4 | 239 | 729022 | 7382.6 | 510 | 499 | 98.7 |
| B | 3 | 64 | 19846 | 196.06 | 510 | 499 | 98.7 |
| B | 3 | 209 | 18966 | 187.14 | 510 | 499 | 98.7 |
| C | 15 | 208 | 11116 | 87.86 | 516 | 518 | 120.6 |
| C | 13 | 61 | 3750 | 26.8 | 516 | 518 | 120.6 |
| C | 12 | 4 | 3313 | 23.17 | 516 | 518 | 120.6 |
| D | 1 | 52 | 888380 | 7276.78 | 507 | 493 | 122.0 |
| D | 13 | 122 | 284174 | 2324.94 | 507 | 493 | 122.0 |
| D | 14 | 34 | 179386 | 1466.14 | 507 | 493 | 122.0 |
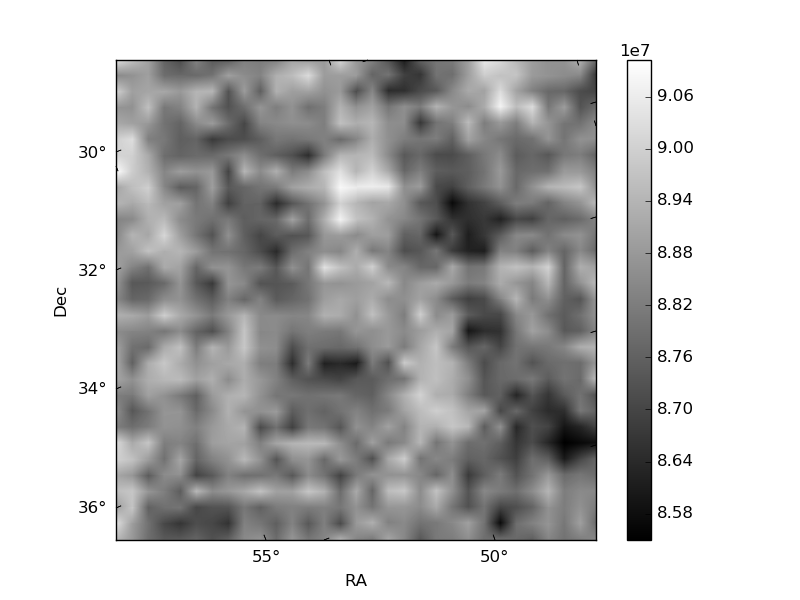
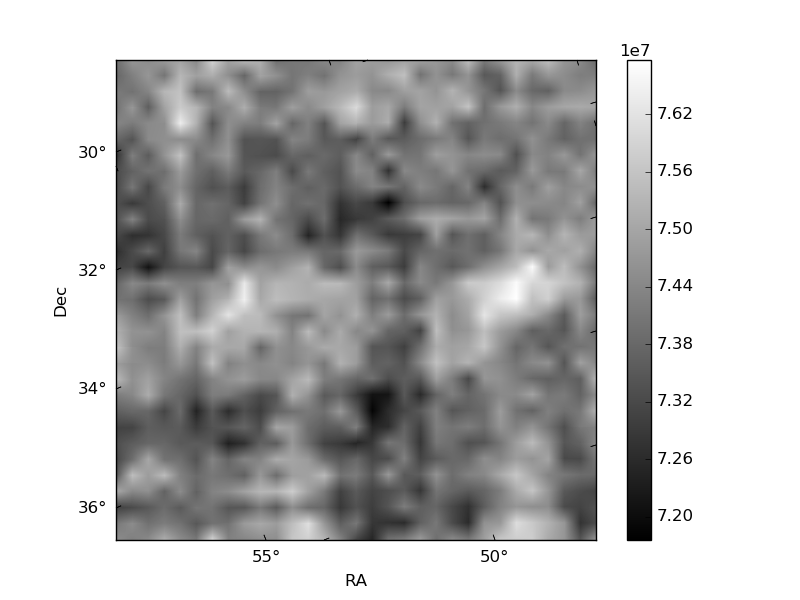
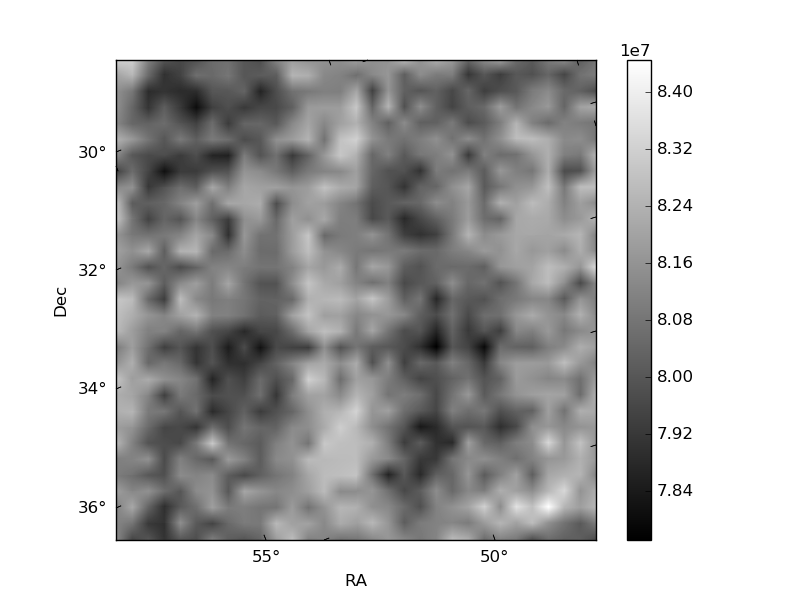
Histogram calculated using DETX and DETY for each event in the final _common_clean file
| Quadrant A | 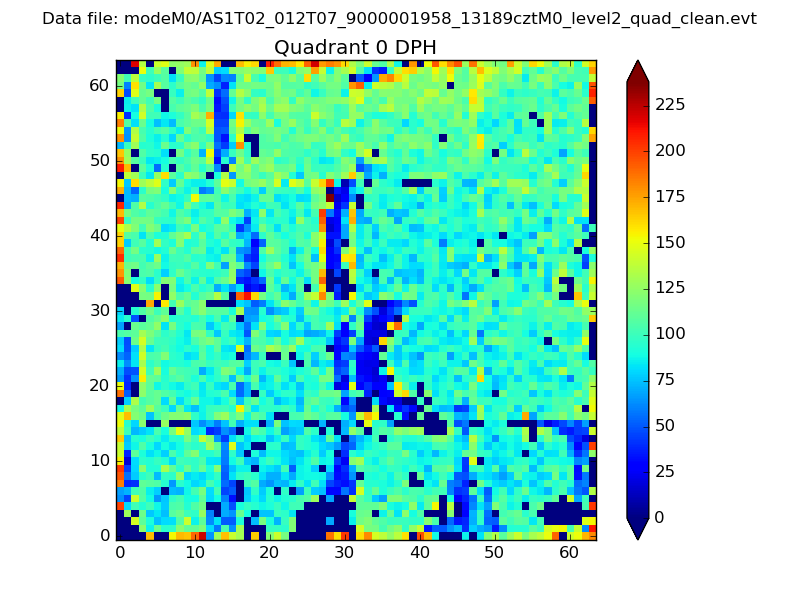 |
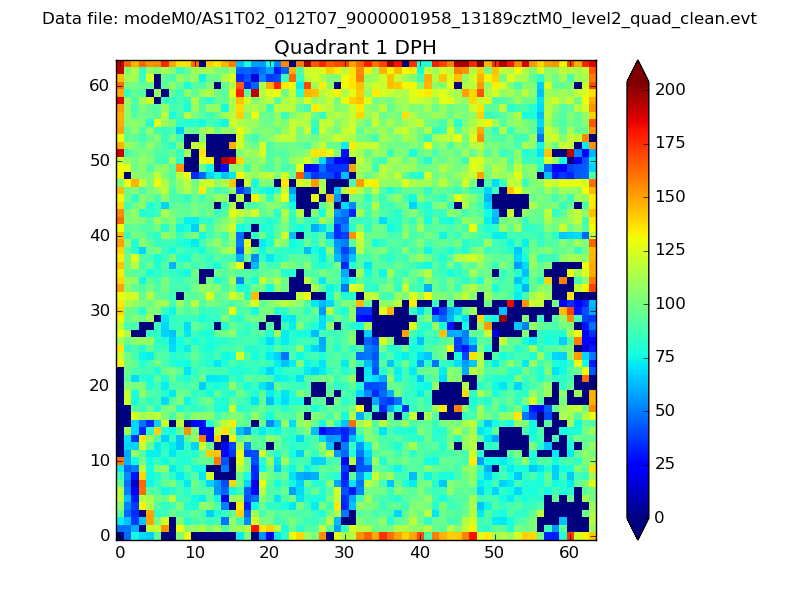 |
Quadrant B |
|---|---|---|---|
| Quadrant D | 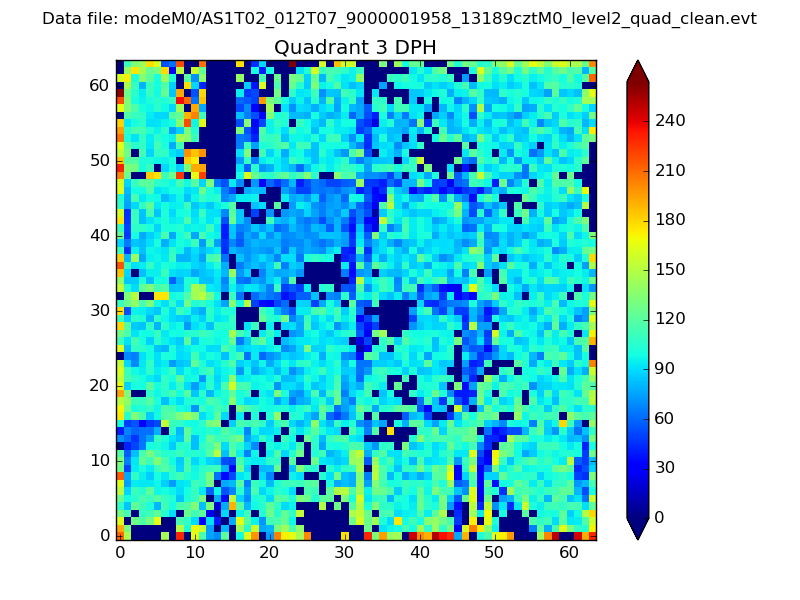 |
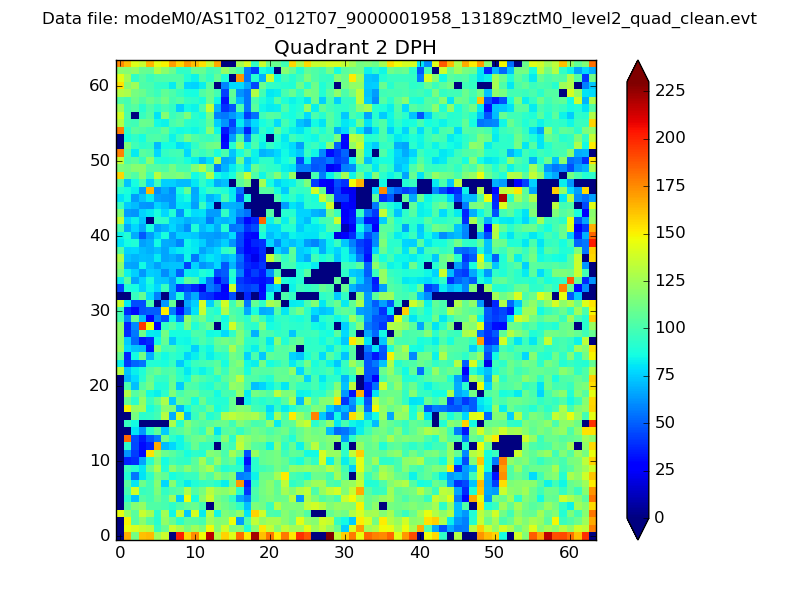 |
Quadrant C |
| Plot type | Count rate plots | Images |
|---|---|---|
| Comparison with Poisson distribution Blue bars denote a histogram of data divided into 1 sec bins. Red curve is a Poisson curve with rate = median count rate of data. |
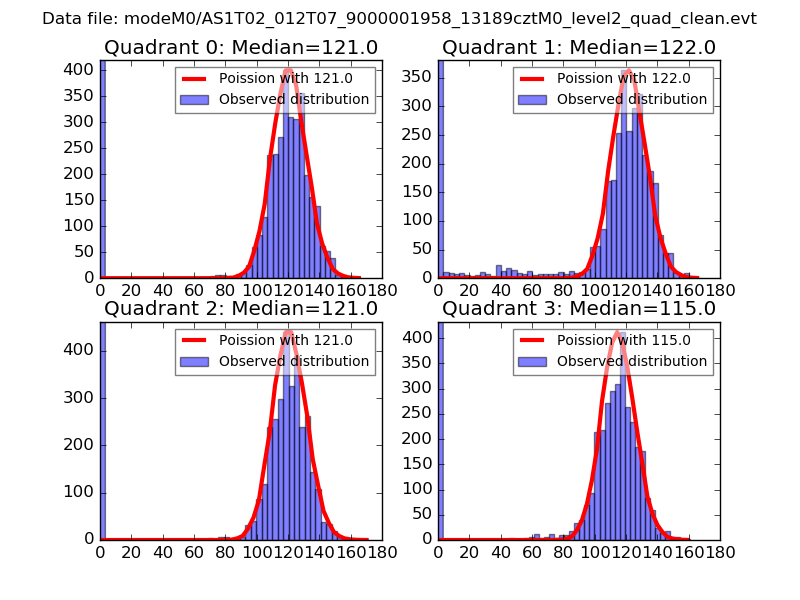 |
 |
| Quadrant-wise count rates Data is divided into 100 sec bins |
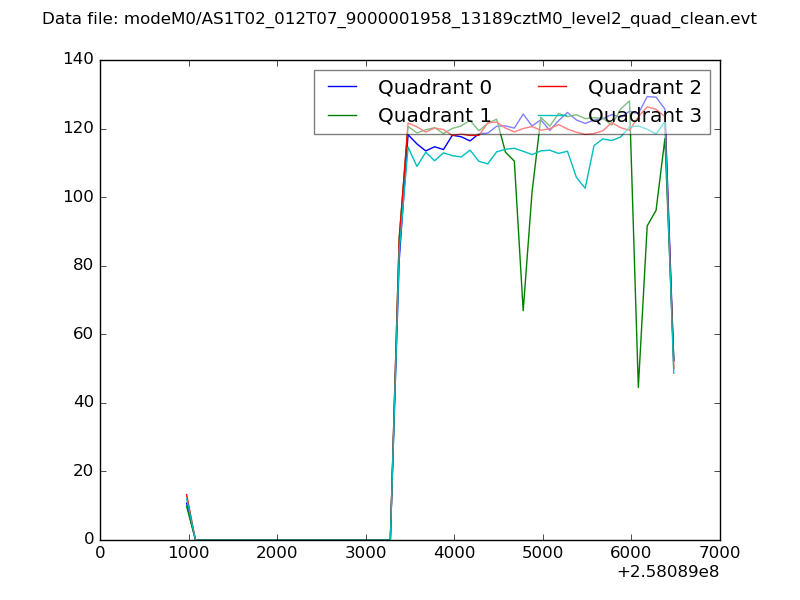 |
|
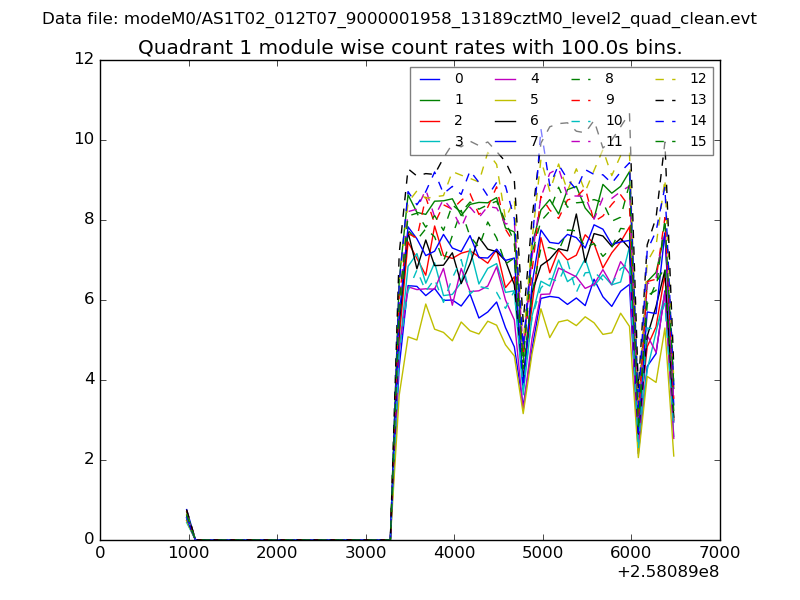
| Module-wise count rates for Quadrant A Data is divided into 100 sec bins |
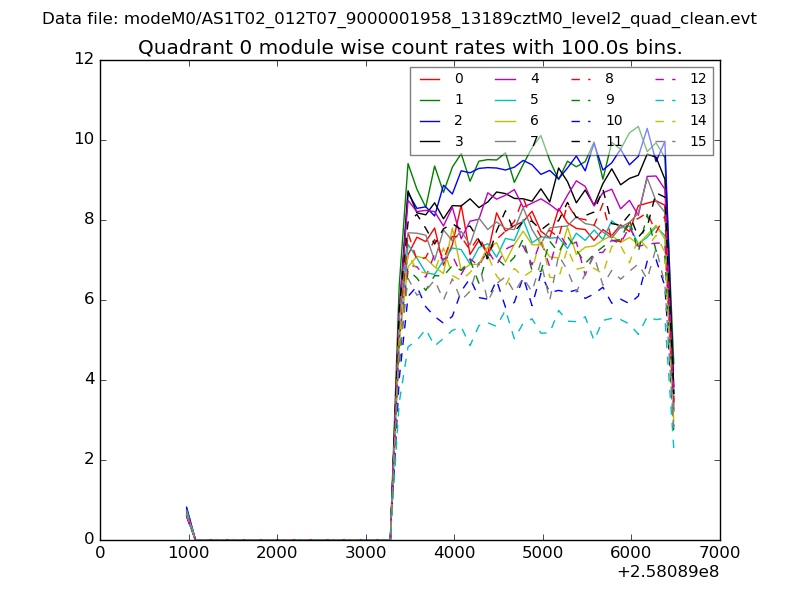 |
 |
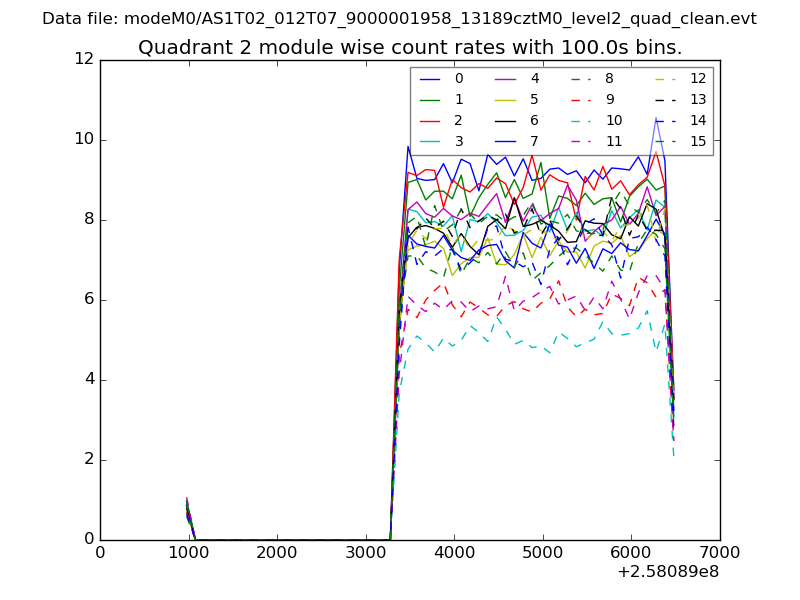
| Module-wise count rates for Quadrant B Data is divided into 100 sec bins |
 |
 |
| Module-wise count rates for Quadrant C Data is divided into 100 sec bins |
 |
 |
| Module-wise count rates for Quadrant D Data is divided into 100 sec bins |
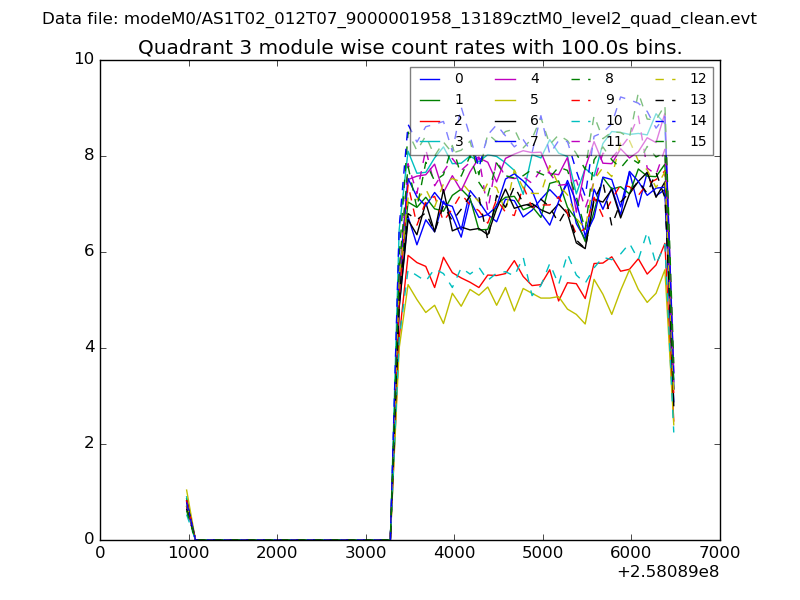 |
 |
| Parameter | Plot |
|---|---|
| CZT HV Monitor | 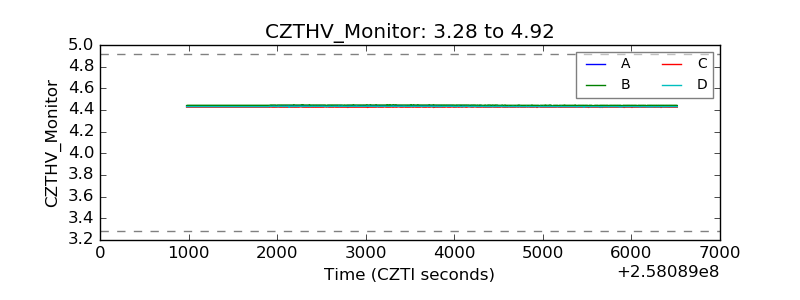 |
| D_VDD | 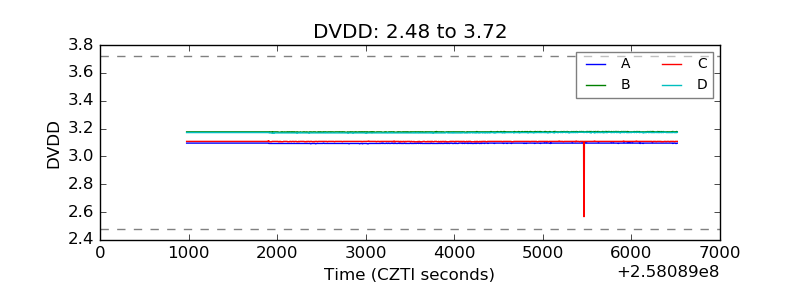 |
| Temperature 1 | 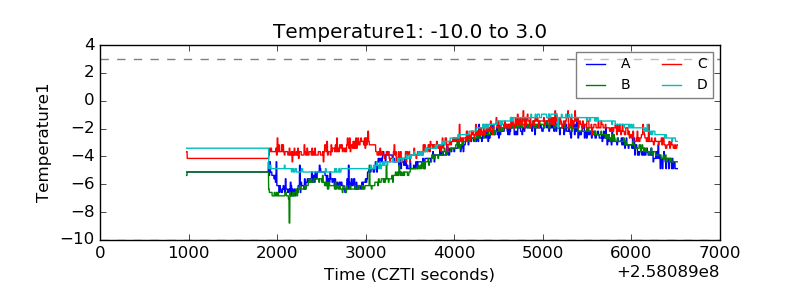 |
| Veto HV Monitor | 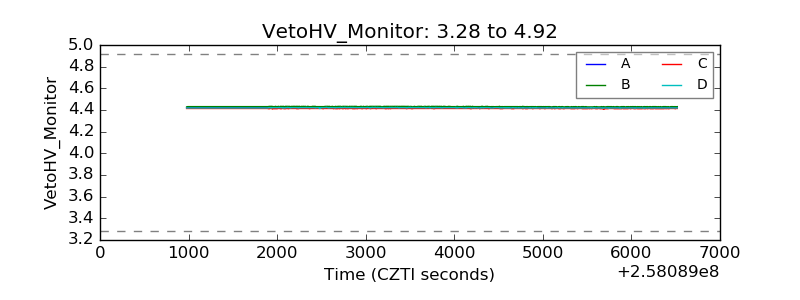 |
| Veto LLD | 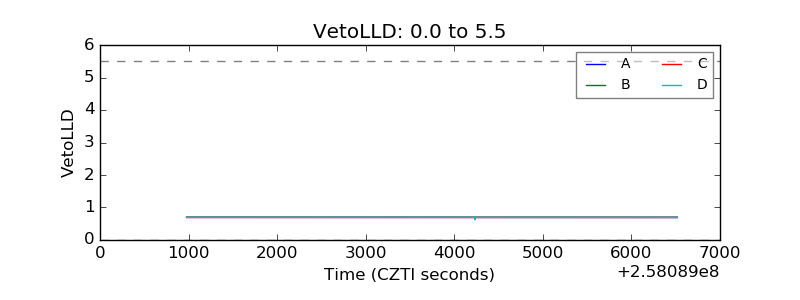 |
| Alpha Counter | 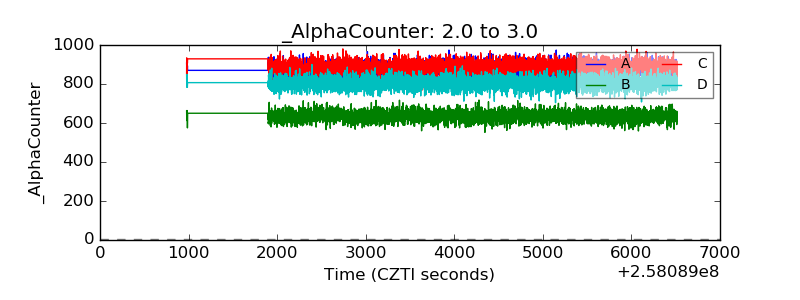 |
| _CPM_Rate | 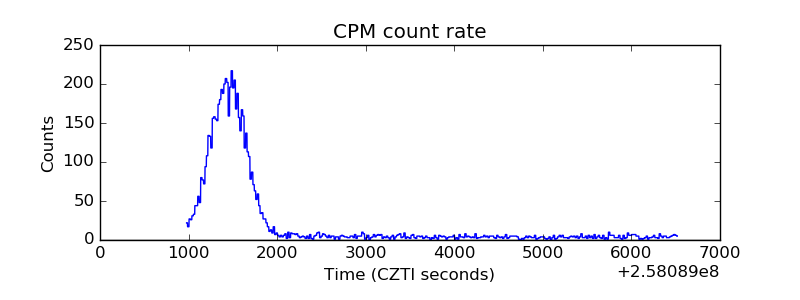 |
| CZT Counter |  |
| +2.5 Volts monitor |  |
| +5 Volts monitor |  |
| _ROLL_ROT | 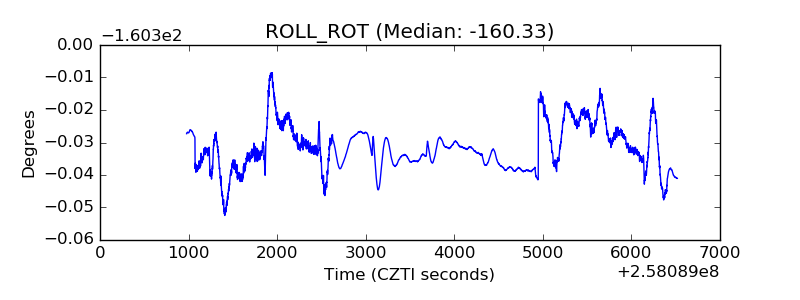 |
| _Roll_DEC | 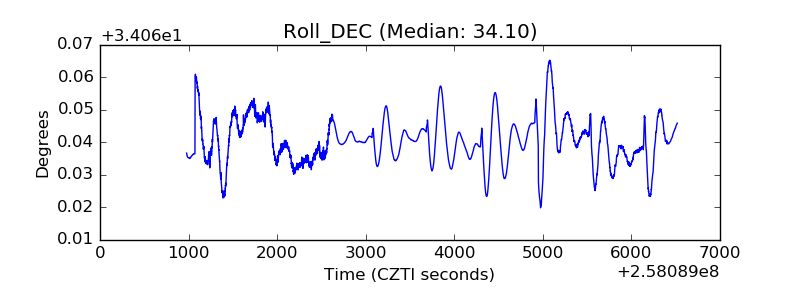 |
| _Roll_RA |  |
| Veto Counter | 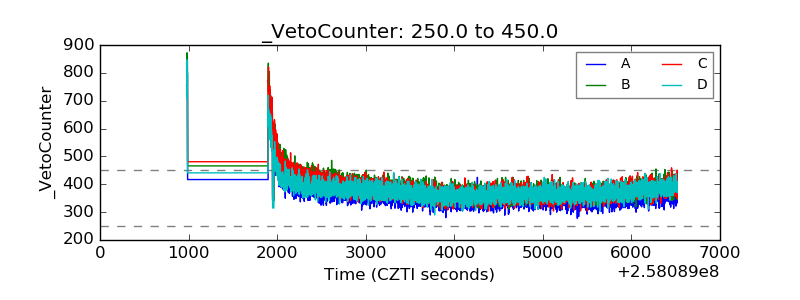 |