| Param | Original file | Final file |
|---|---|---|
| Filename | modeM0/AS1A04_104T04_9000001966cztM0_level2.fits | modeM0/AS1A04_104T04_9000001966cztM0_level2_quad_clean.evt |
| Size (bytes) | 653,739,840 | 603,371,520 |
| Size | 623.5 MB | 575.4 MB |
| Events in quadrant A | 4,015,744 | 3,547,622 |
| Events in quadrant B | 3,782,688 | 3,483,356 |
| Events in quadrant C | 4,021,324 | 3,488,950 |
| Events in quadrant D | 3,177,452 | 2,958,087 |
| Mode M9 | |||
|---|---|---|---|
| Quadrant | BADHDUFLAG | Total packets | Discarded packets |
| A | 0 | 108 | 0 |
| B | 0 | 108 | 0 |
| C | 0 | 108 | 0 |
| D | 0 | 108 | 0 |
| Mode M0 | |||
|---|---|---|---|
| Quadrant | BADHDUFLAG | Total packets | Discarded packets |
| A | 0 | 146210 | 0 |
| B | 0 | 179469 | 0 |
| C | 0 | 144410 | 0 |
| D | 0 | 246781 | 0 |
| Mode SS | |||
|---|---|---|---|
| Quadrant | BADHDUFLAG | Total packets | Discarded packets |
| A | 0 | 1428 | 0 |
| B | 0 | 1428 | 0 |
| C | 0 | 1428 | 0 |
| D | 0 | 1428 | 0 |
| Quadrant | Total seconds | Saturated seconds | Saturation percentage |
|---|---|---|---|
| A | 69917 | 1044 | 1.493199% |
| B | 69919 | 5005 | 7.158283% |
| C | 69915 | 708 | 1.012658% |
| D | 69916 | 11032 | 15.778935% |
Noise dominated data is calculated using 1-second bins in cleaned event files. If a bin has >2000 counts, and if more than 50% of those come from <1% of pixels, then it is considered to be noise-dominated and hence unusable.
| Quadrant | # 1 sec bins | Bins with >0 counts | Bins with >2000 counts | High rate bins dominated by noise | Noise dominated (total time) | Noise dominated (detector-on time) | Marked lightcurve |
|---|---|---|---|---|---|---|---|
| A | 80769 | 69919 | 0 | 0 | 0.00% | 0.00% |  |
| B | 80769 | 69756 | 0 | 0 | 0.00% | 0.00% |  |
| C | 80769 | 69919 | 0 | 0 | 0.00% | 0.00% | 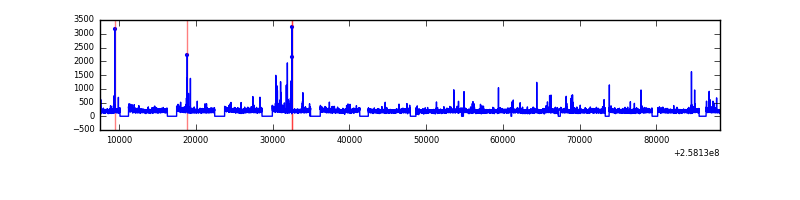 |
| D | 80769 | 69886 | 0 | 0 | 0.00% | 0.00% |  |
Top three noisy pixels from each quadrant. If the there are fewer than three noisy pixels in the level2.evt file, extra rows are filled as -1
| Pixel properties | Quadrant properties | ||||||
|---|---|---|---|---|---|---|---|
| Quadrant | DetID | PixID | Counts | Sigma | Mean | Median | Sigma |
| A | 0 | 29 | 3843 | 10.87 | 1046 | 978 | 263.5 |
| A | 7 | 110 | 3155 | 8.26 | 1046 | 978 | 263.5 |
| A | 0 | 30 | 2935 | 7.43 | 1046 | 978 | 263.5 |
| B | 2 | 9 | 3350 | 12.11 | 997 | 949 | 198.3 |
| B | 2 | 8 | 2569 | 8.17 | 997 | 949 | 198.3 |
| B | 5 | 128 | 2540 | 8.02 | 997 | 949 | 198.3 |
| C | 2 | 191 | 2773 | 6.43 | 1063 | 986 | 277.7 |
| C | 12 | 241 | 2756 | 6.37 | 1063 | 986 | 277.7 |
| C | 3 | 126 | 2746 | 6.34 | 1063 | 986 | 277.7 |
| D | 7 | 3 | 2282 | 5.99 | 905 | 822 | 243.7 |
| D | 6 | 231 | 2276 | 5.97 | 905 | 822 | 243.7 |
| D | 3 | 159 | 2271 | 5.95 | 905 | 822 | 243.7 |
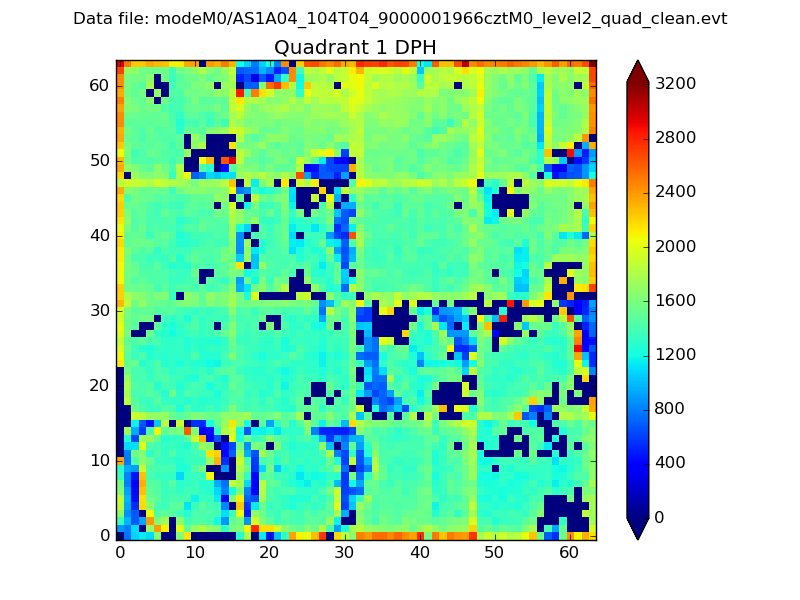
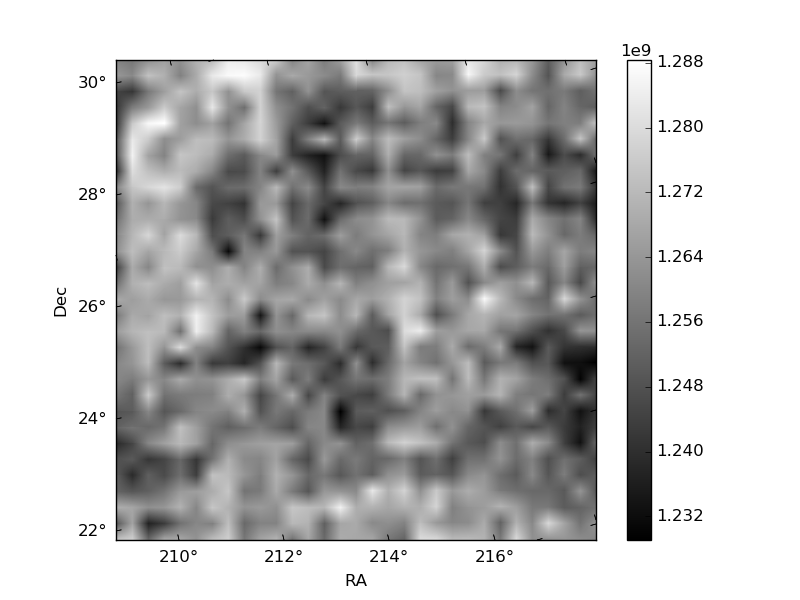
Histogram calculated using DETX and DETY for each event in the final _common_clean file
| Quadrant A |  |
 |
Quadrant B |
|---|---|---|---|
| Quadrant D | 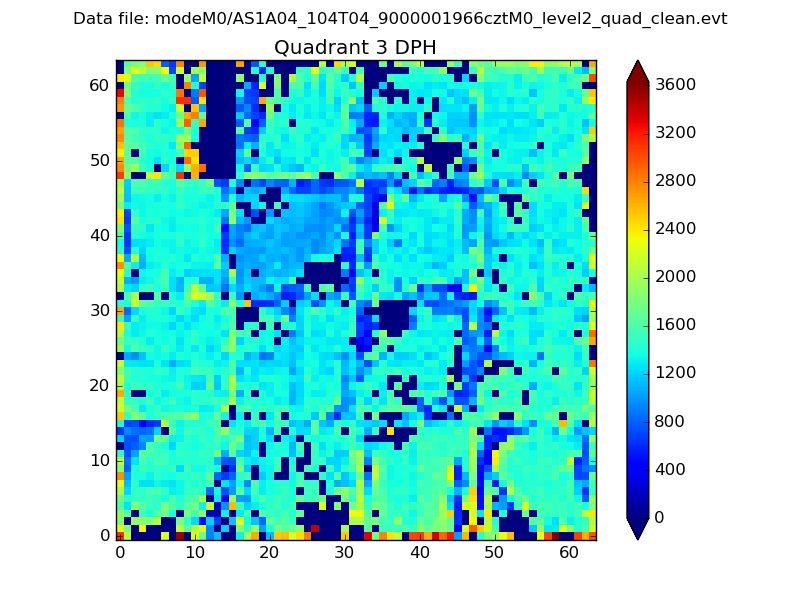 |
 |
Quadrant C |
| Plot type | Count rate plots | Images |
|---|---|---|
| Comparison with Poisson distribution Blue bars denote a histogram of data divided into 1 sec bins. Red curve is a Poisson curve with rate = median count rate of data. |
 |
 |
| Quadrant-wise count rates Data is divided into 100 sec bins |
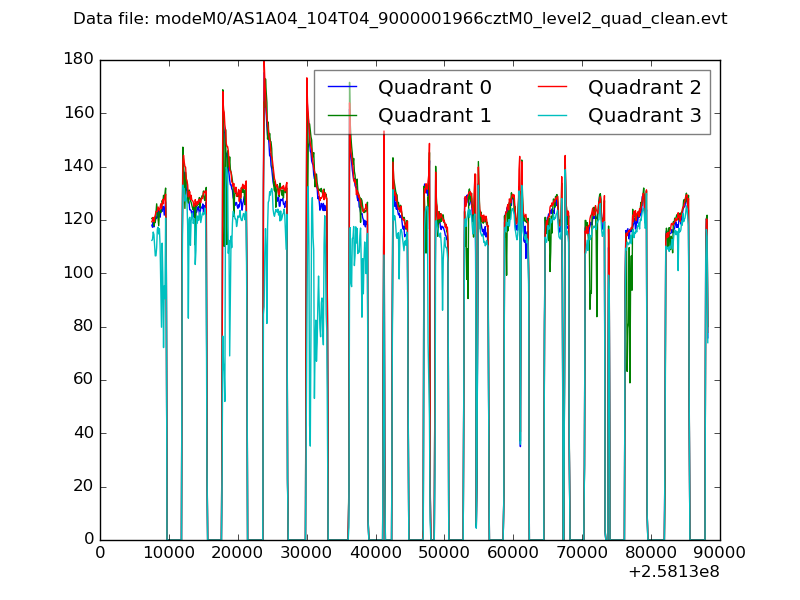 |
|
| Module-wise count rates for Quadrant A Data is divided into 100 sec bins |
 |
 |
| Module-wise count rates for Quadrant B Data is divided into 100 sec bins |
 |
 |
| Module-wise count rates for Quadrant C Data is divided into 100 sec bins |
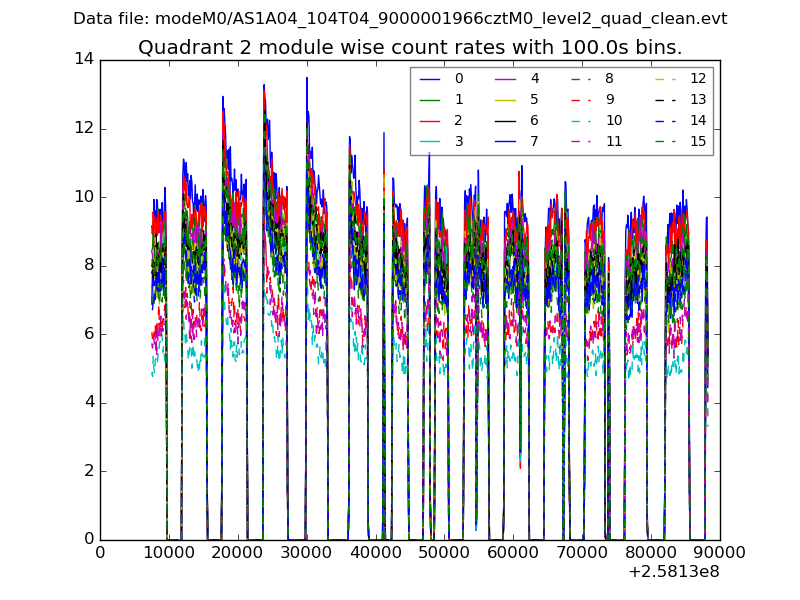 |
 |
| Module-wise count rates for Quadrant D Data is divided into 100 sec bins |
 |
 |
| Parameter | Plot |
|---|---|
| CZT HV Monitor |  |
| D_VDD | 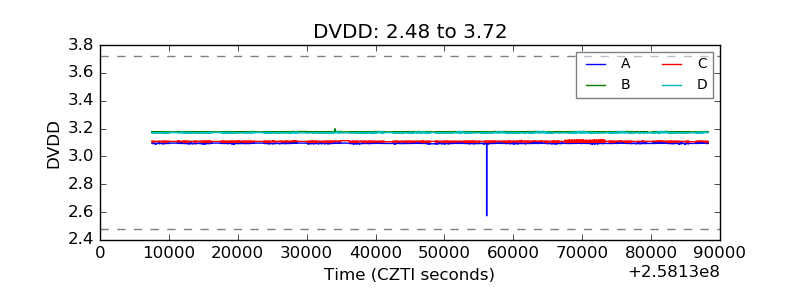 |
| Temperature 1 |  |
| Veto HV Monitor |  |
| Veto LLD | 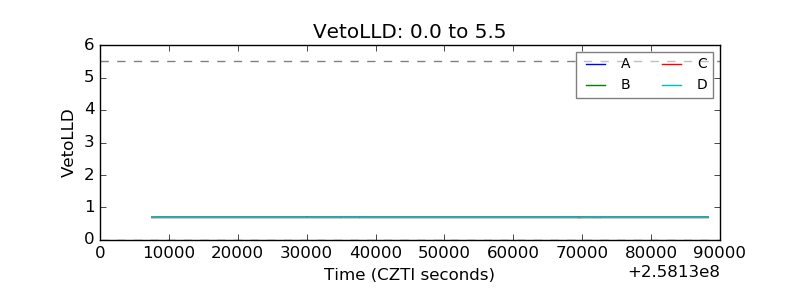 |
| Alpha Counter |  |
| _CPM_Rate |  |
| CZT Counter |  |
| +2.5 Volts monitor |  |
| +5 Volts monitor |  |
| _ROLL_ROT | 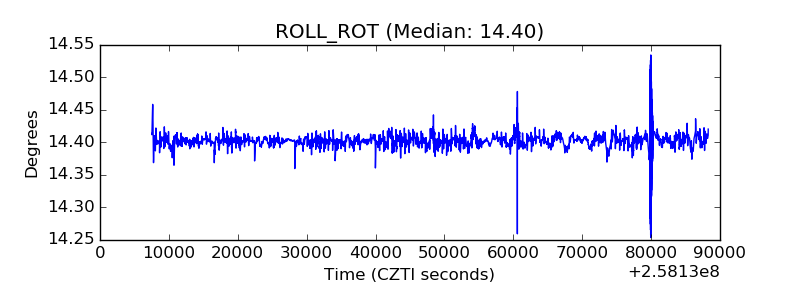 |
| _Roll_DEC | 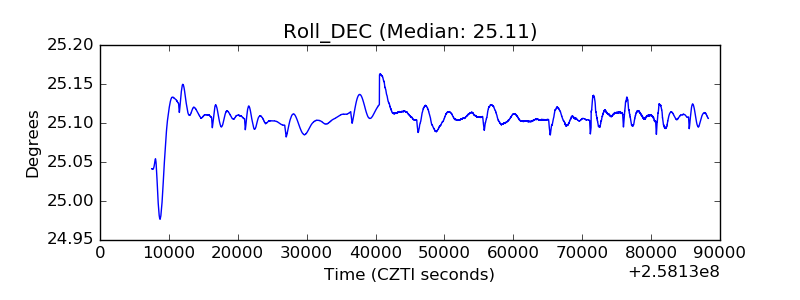 |
| _Roll_RA |  |
| Veto Counter |  |