| Param | Original file | Final file |
|---|---|---|
| Filename | modeM0/AS1A04_104T04_9000001966_13197cztM0_level2.evt | modeM0/AS1A04_104T04_9000001966_13197cztM0_level2_quad_clean.evt |
| Size (bytes) | 348,868,800 | 52,580,160 |
| Size | 332.7 MB | 50.1 MB |
| Events in quadrant A | 1,866,194 | 336,635 |
| Events in quadrant B | 2,369,186 | 341,736 |
| Events in quadrant C | 1,842,157 | 344,471 |
| Events in quadrant D | 4,227,567 | 298,838 |
| Mode M9 | |||
|---|---|---|---|
| Quadrant | BADHDUFLAG | Total packets | Discarded packets |
| A | 0 | 11 | 0 |
| B | 0 | 11 | 0 |
| C | 0 | 11 | 0 |
| D | 0 | 11 | 0 |
| Mode M0 | |||
|---|---|---|---|
| Quadrant | BADHDUFLAG | Total packets | Discarded packets |
| A | 0 | 8114 | 2 |
| B | 0 | 9607 | 1 |
| C | 0 | 8083 | 1 |
| D | 0 | 15231 | 1 |
| Mode SS | |||
|---|---|---|---|
| Quadrant | BADHDUFLAG | Total packets | Discarded packets |
| A | 0 | 78 | 0 |
| B | 0 | 78 | 0 |
| C | 0 | 78 | 0 |
| D | 0 | 78 | 0 |
| Quadrant | Total seconds | Saturated seconds | Saturation percentage |
|---|---|---|---|
| A | 3822 | 23 | 0.601779% |
| B | 3822 | 209 | 5.468341% |
| C | 3822 | 24 | 0.627943% |
| D | 3822 | 594 | 15.541601% |
Noise dominated data is calculated using 1-second bins in cleaned event files. If a bin has >2000 counts, and if more than 50% of those come from <1% of pixels, then it is considered to be noise-dominated and hence unusable.
| Quadrant | # 1 sec bins | Bins with >0 counts | Bins with >2000 counts | High rate bins dominated by noise | Noise dominated (total time) | Noise dominated (detector-on time) | Marked lightcurve |
|---|---|---|---|---|---|---|---|
| A | 4938 | 3824 | 0 | 0 | 0.00% | 0.00% | 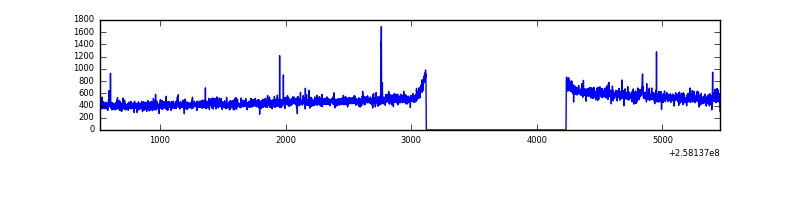 |
| B | 4938 | 3824 | 95 | 95 | 1.92% | 2.48% | 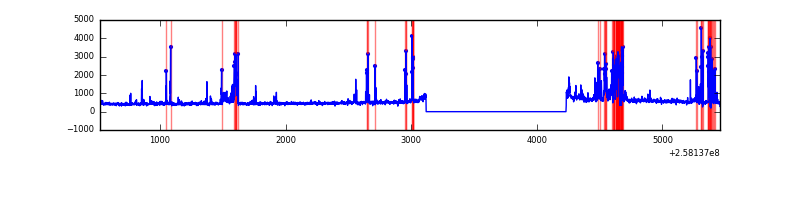 |
| C | 4938 | 3824 | 1 | 1 | 0.02% | 0.03% | 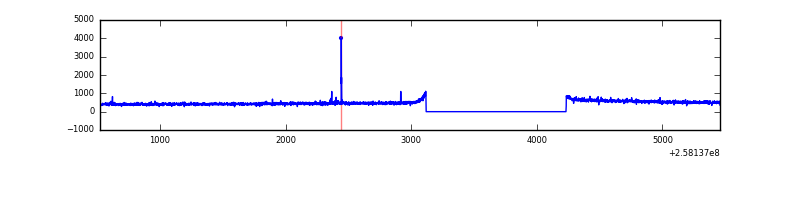 |
| D | 4938 | 3824 | 425 | 425 | 8.61% | 11.11% | 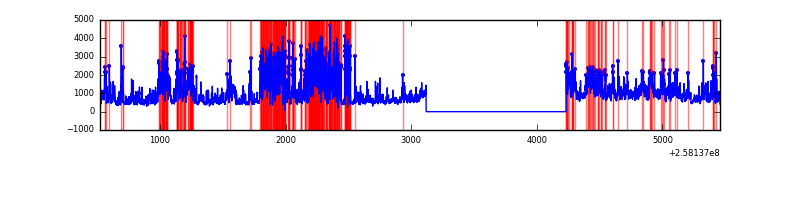 |
Top three noisy pixels from each quadrant. If the there are fewer than three noisy pixels in the level2.evt file, extra rows are filled as -1
| Pixel properties | Quadrant properties | ||||||
|---|---|---|---|---|---|---|---|
| Quadrant | DetID | PixID | Counts | Sigma | Mean | Median | Sigma |
| A | 4 | 2 | 11520 | 113.65 | 476 | 467 | 97.3 |
| A | 1 | 162 | 9365 | 91.5 | 476 | 467 | 97.3 |
| A | 12 | 189 | 5661 | 53.41 | 476 | 467 | 97.3 |
| B | 4 | 239 | 485727 | 5359.94 | 467 | 456 | 90.5 |
| B | 5 | 32 | 24526 | 265.86 | 467 | 456 | 90.5 |
| B | 0 | 189 | 11920 | 126.62 | 467 | 456 | 90.5 |
| C | 15 | 208 | 12502 | 110.59 | 468 | 472 | 108.8 |
| C | 13 | 61 | 3407 | 26.98 | 468 | 472 | 108.8 |
| C | 14 | 234 | 2848 | 21.84 | 468 | 472 | 108.8 |
| D | 13 | 122 | 2416790 | 22676.83 | 441 | 429 | 106.6 |
| D | 1 | 52 | 87405 | 816.24 | 441 | 429 | 106.6 |
| D | 2 | 234 | 18169 | 166.48 | 441 | 429 | 106.6 |
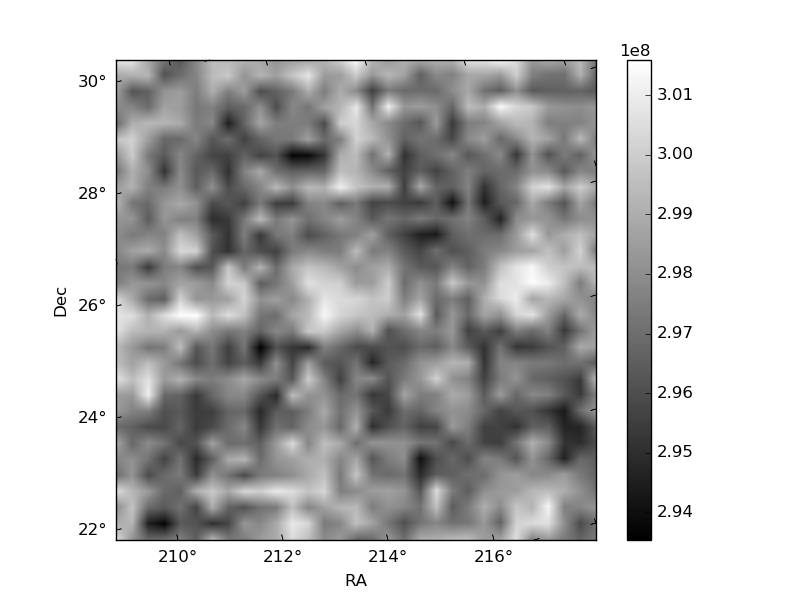
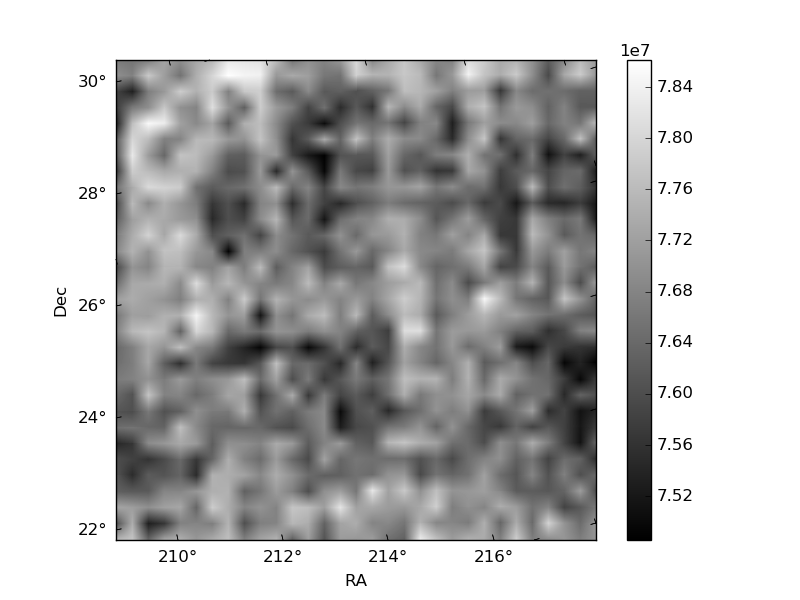
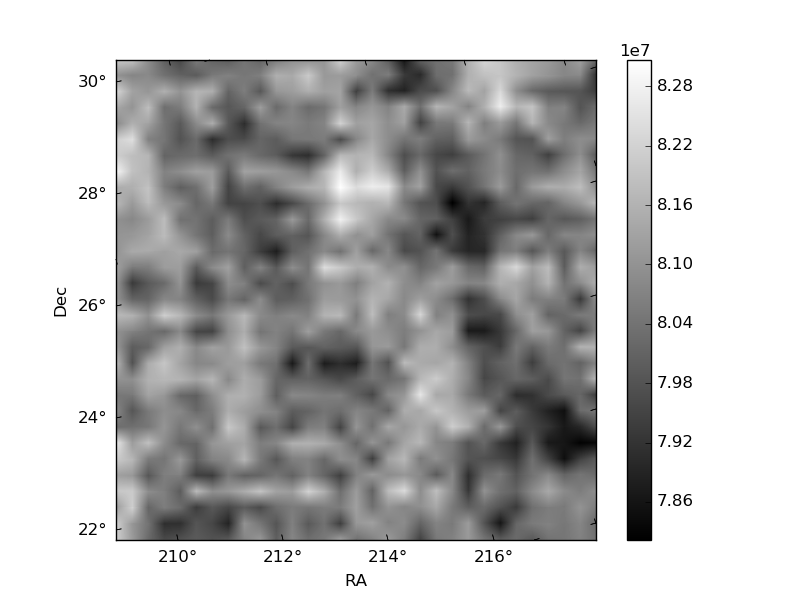
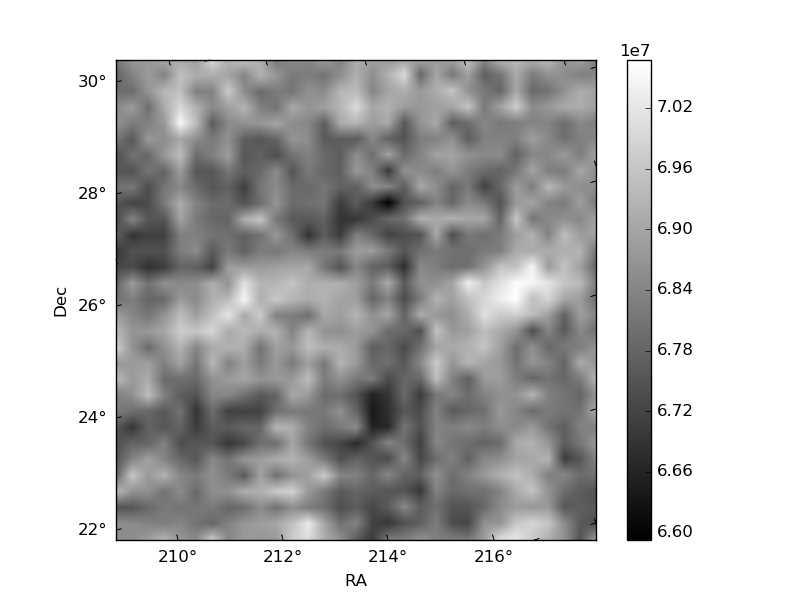
Histogram calculated using DETX and DETY for each event in the final _common_clean file
| Quadrant A | 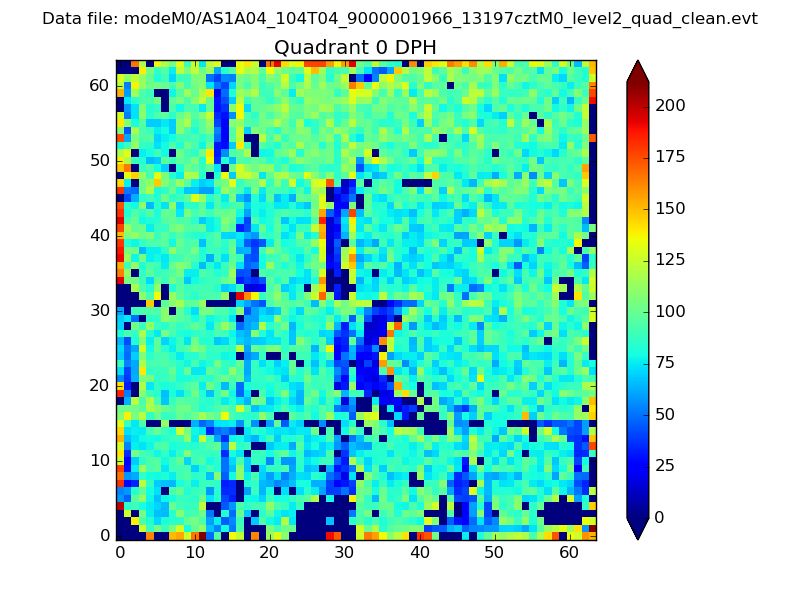 |
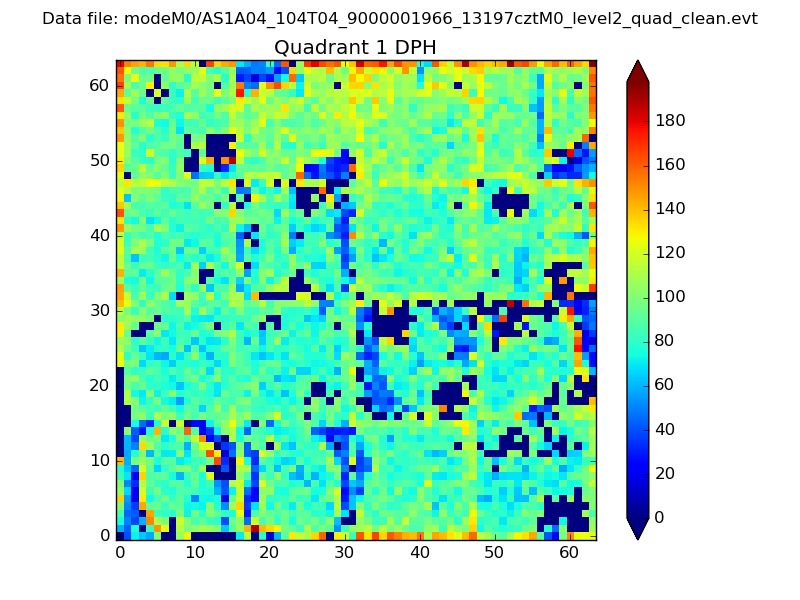 |
Quadrant B |
|---|---|---|---|
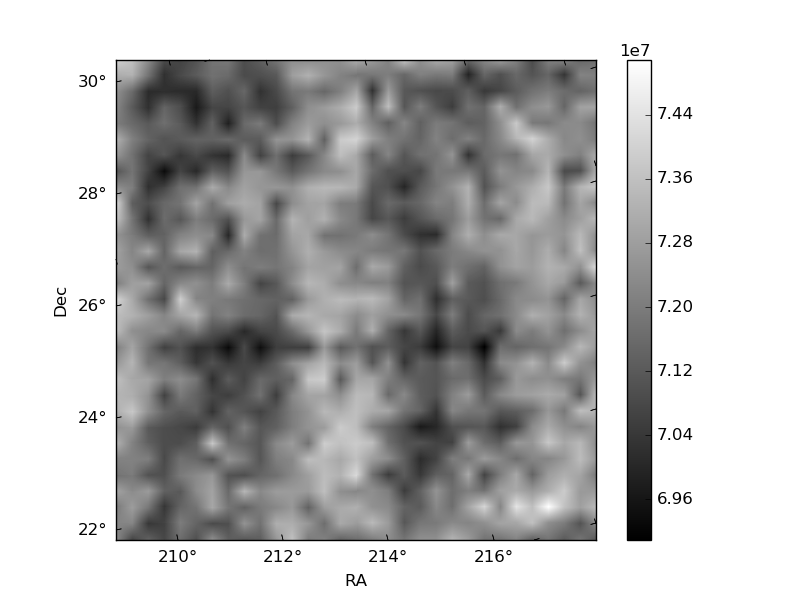
| Quadrant D | 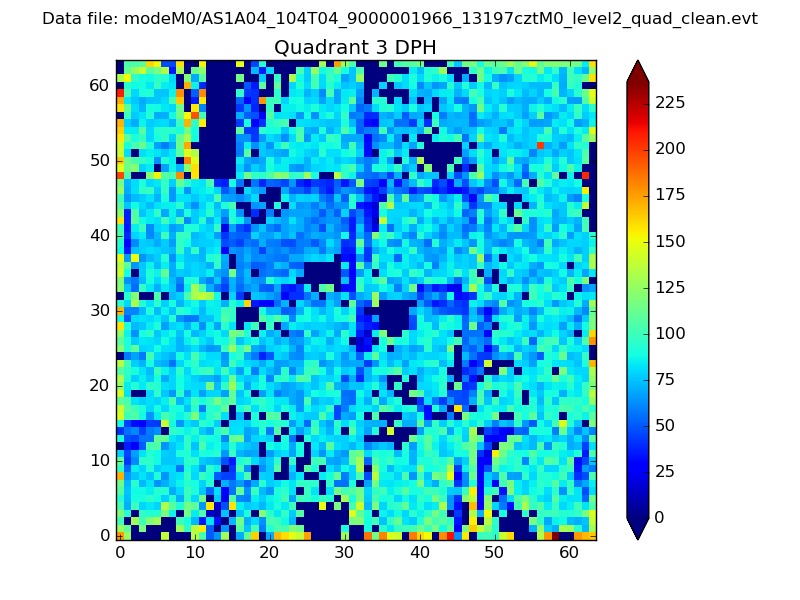 |
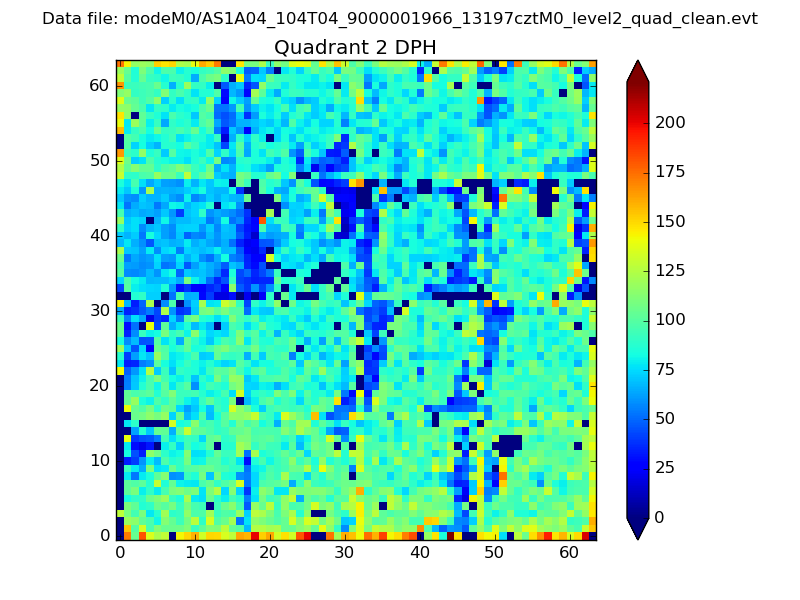 |
Quadrant C |
| Plot type | Count rate plots | Images |
|---|---|---|
| Comparison with Poisson distribution Blue bars denote a histogram of data divided into 1 sec bins. Red curve is a Poisson curve with rate = median count rate of data. |
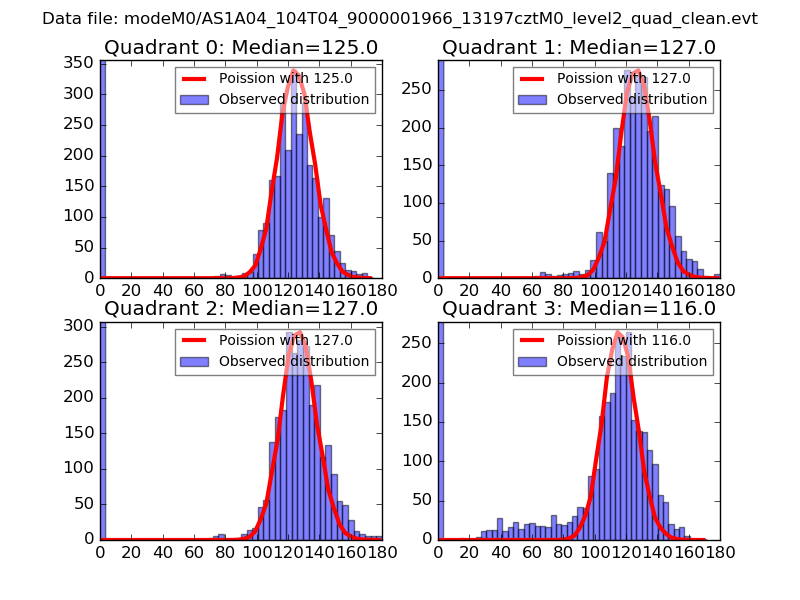 |
 |
| Quadrant-wise count rates Data is divided into 100 sec bins |
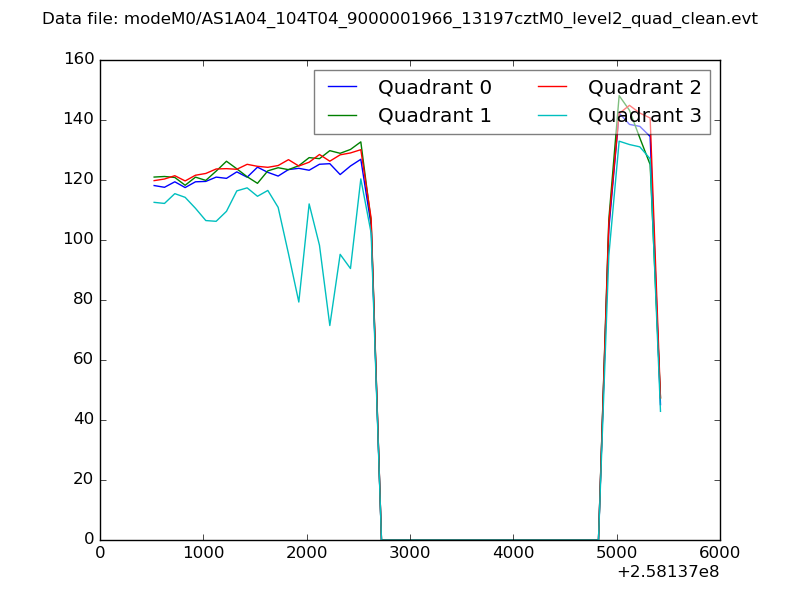 |
|
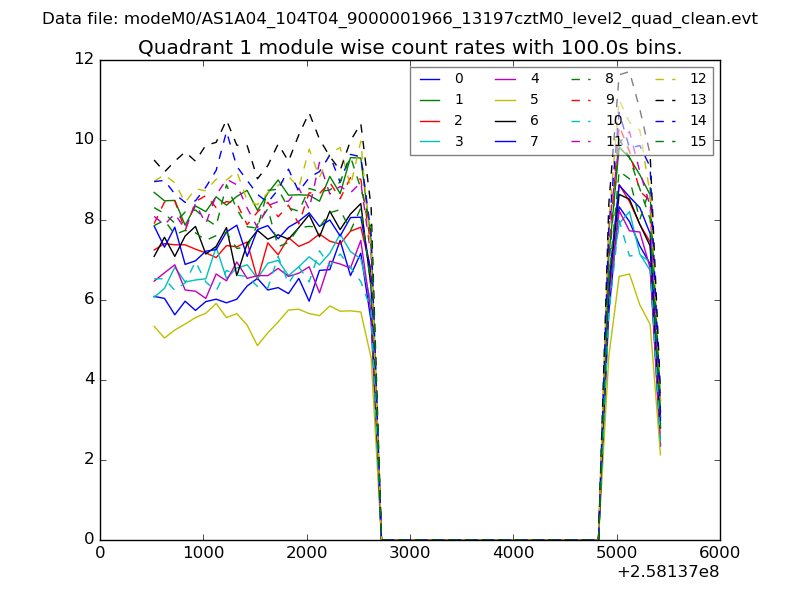
| Module-wise count rates for Quadrant A Data is divided into 100 sec bins |
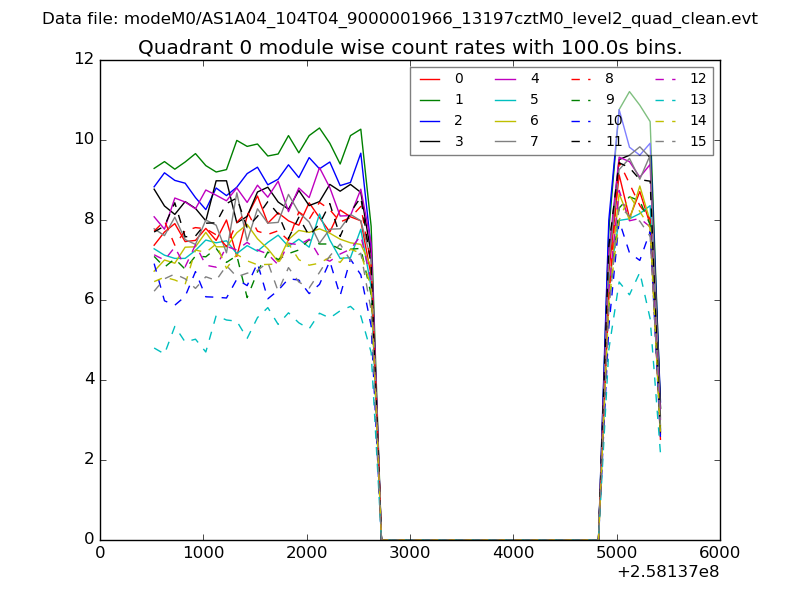 |
 |
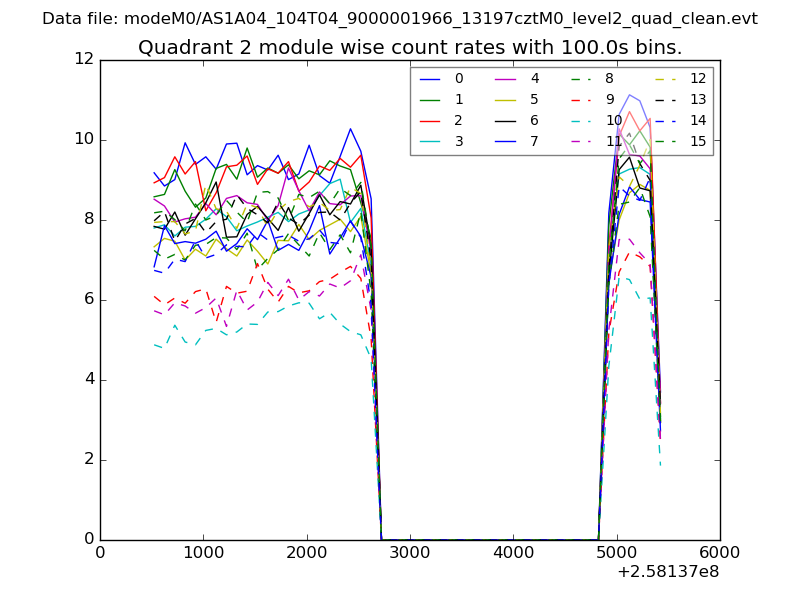
| Module-wise count rates for Quadrant B Data is divided into 100 sec bins |
 |
 |
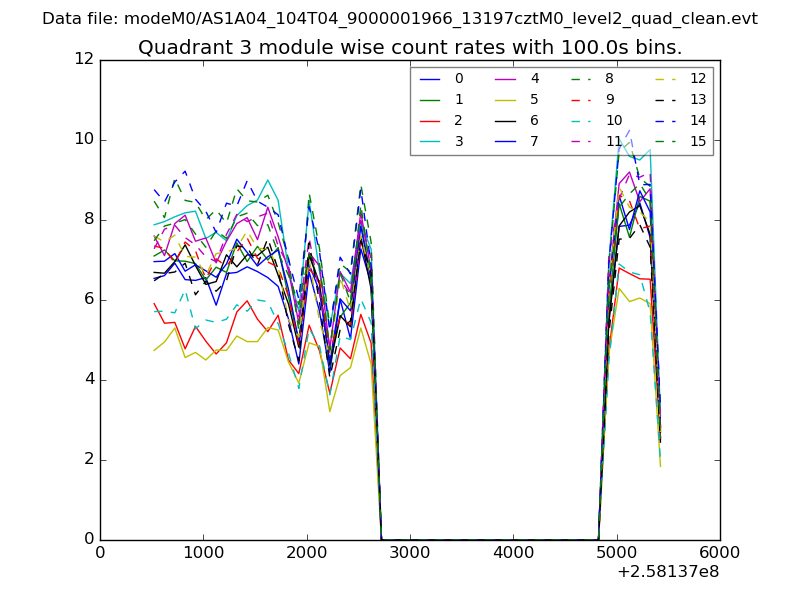
| Module-wise count rates for Quadrant C Data is divided into 100 sec bins |
 |
 |
| Module-wise count rates for Quadrant D Data is divided into 100 sec bins |
 |
 |
| Parameter | Plot |
|---|---|
| CZT HV Monitor | 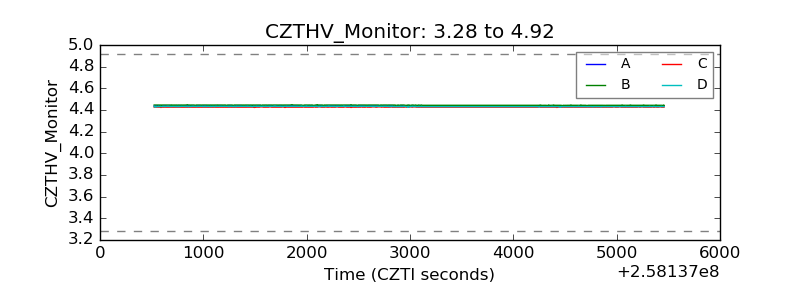 |
| D_VDD | 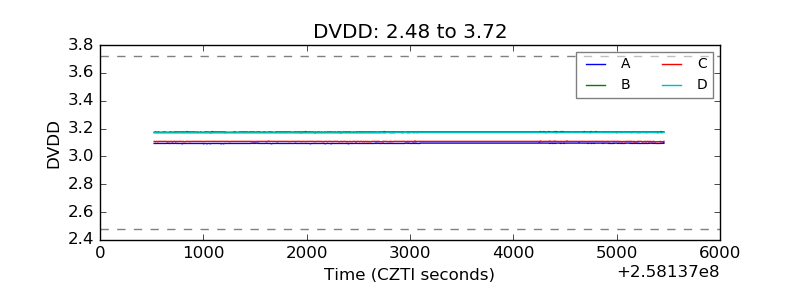 |
| Temperature 1 | 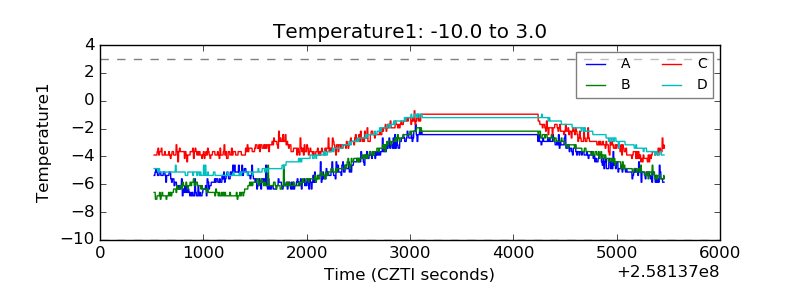 |
| Veto HV Monitor |  |
| Veto LLD | 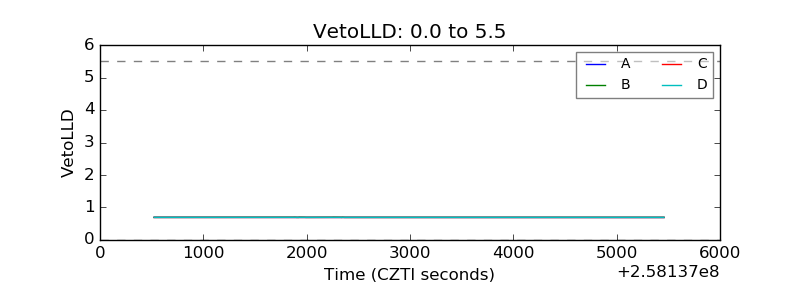 |
| Alpha Counter | 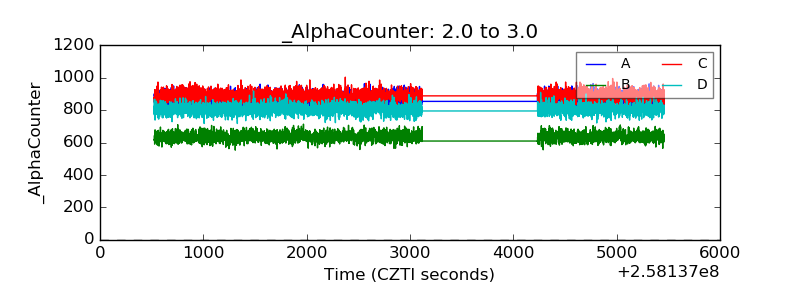 |
| _CPM_Rate | 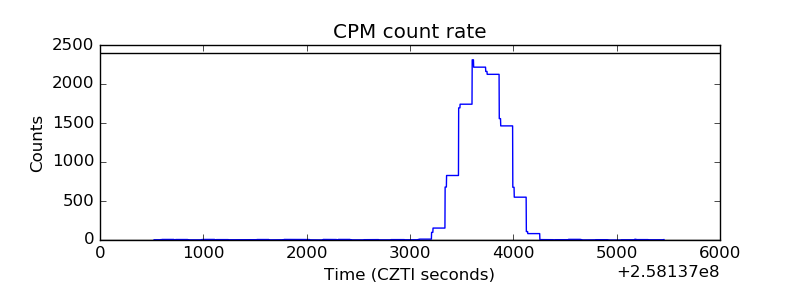 |
| CZT Counter | 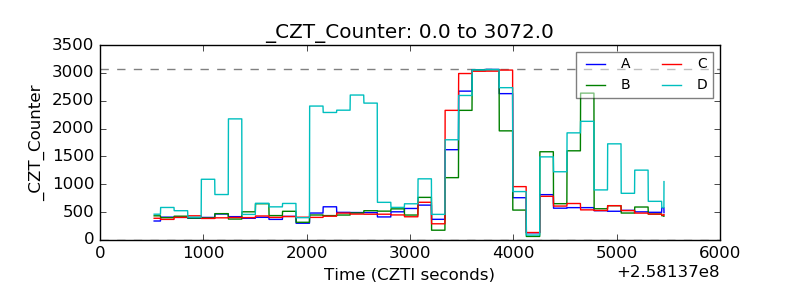 |
| +2.5 Volts monitor |  |
| +5 Volts monitor |  |
| _ROLL_ROT | 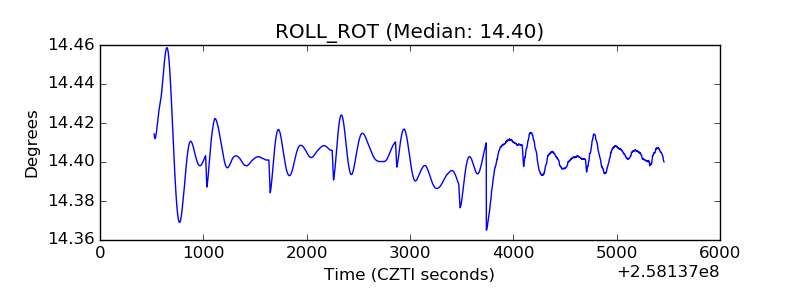 |
| _Roll_DEC | 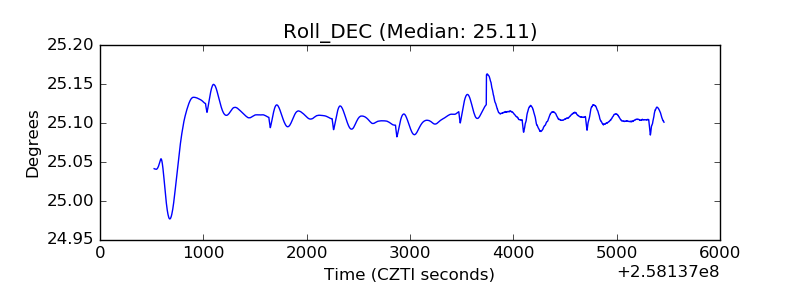 |
| _Roll_RA | 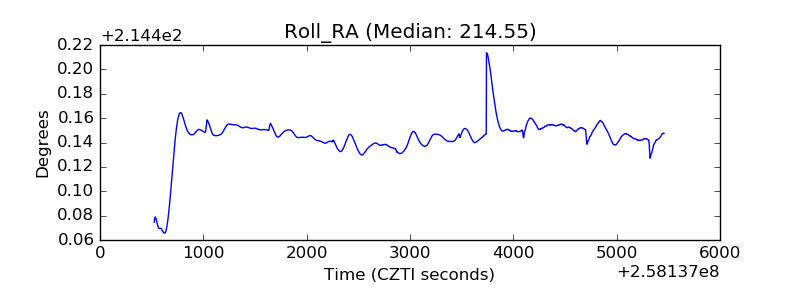 |
| Veto Counter | 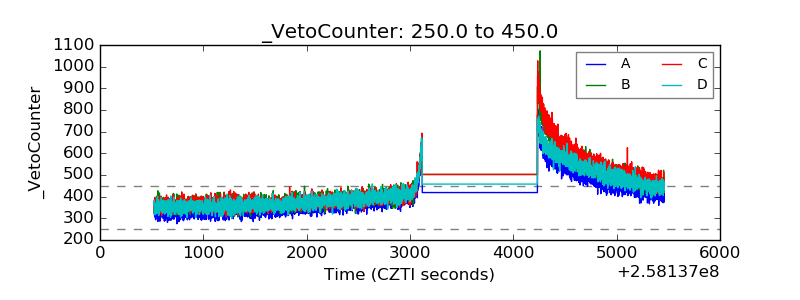 |