| Param | Original file | Final file |
|---|---|---|
| Filename | modeM0/AS1A04_104T04_9000001966_13198cztM0_level2.evt | modeM0/AS1A04_104T04_9000001966_13198cztM0_level2_quad_clean.evt |
| Size (bytes) | 608,463,360 | 92,854,080 |
| Size | 580.3 MB | 88.6 MB |
| Events in quadrant A | 3,371,397 | 598,376 |
| Events in quadrant B | 4,313,492 | 596,388 |
| Events in quadrant C | 3,301,641 | 619,351 |
| Events in quadrant D | 6,987,678 | 531,316 |
| Mode M9 | |||
|---|---|---|---|
| Quadrant | BADHDUFLAG | Total packets | Discarded packets |
| A | 0 | 24 | 0 |
| B | 0 | 24 | 0 |
| C | 0 | 24 | 0 |
| D | 0 | 24 | 0 |
| Mode M0 | |||
|---|---|---|---|
| Quadrant | BADHDUFLAG | Total packets | Discarded packets |
| A | 0 | 14342 | 3 |
| B | 0 | 17254 | 2 |
| C | 0 | 14237 | 2 |
| D | 0 | 25361 | 2 |
| Mode SS | |||
|---|---|---|---|
| Quadrant | BADHDUFLAG | Total packets | Discarded packets |
| A | 0 | 136 | 0 |
| B | 0 | 136 | 0 |
| C | 0 | 136 | 0 |
| D | 0 | 136 | 0 |
| Quadrant | Total seconds | Saturated seconds | Saturation percentage |
|---|---|---|---|
| A | 6693 | 64 | 0.956223% |
| B | 6693 | 472 | 7.052144% |
| C | 6693 | 59 | 0.881518% |
| D | 6693 | 1233 | 18.422232% |
Noise dominated data is calculated using 1-second bins in cleaned event files. If a bin has >2000 counts, and if more than 50% of those come from <1% of pixels, then it is considered to be noise-dominated and hence unusable.
| Quadrant | # 1 sec bins | Bins with >0 counts | Bins with >2000 counts | High rate bins dominated by noise | Noise dominated (total time) | Noise dominated (detector-on time) | Marked lightcurve |
|---|---|---|---|---|---|---|---|
| A | 9024 | 6696 | 0 | 0 | 0.00% | 0.00% | 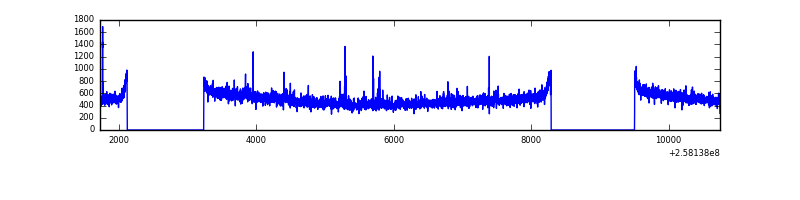 |
| B | 9024 | 6696 | 204 | 204 | 2.26% | 3.05% | 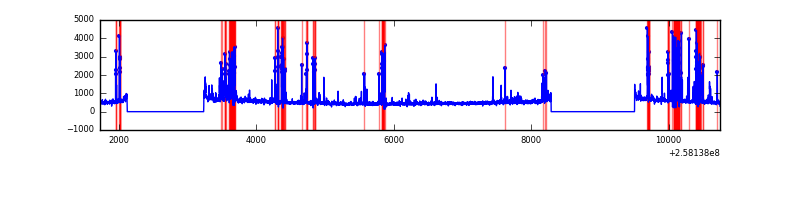 |
| C | 9024 | 6696 | 0 | 0 | 0.00% | 0.00% | 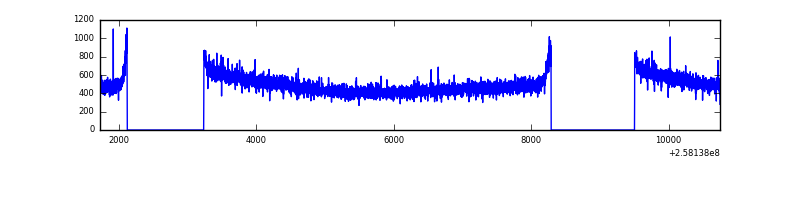 |
| D | 9024 | 6696 | 834 | 834 | 9.24% | 12.46% | 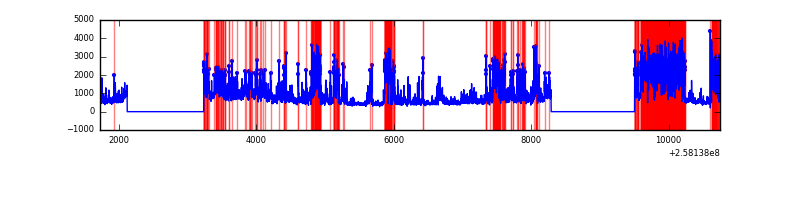 |
Top three noisy pixels from each quadrant. If the there are fewer than three noisy pixels in the level2.evt file, extra rows are filled as -1
| Pixel properties | Quadrant properties | ||||||
|---|---|---|---|---|---|---|---|
| Quadrant | DetID | PixID | Counts | Sigma | Mean | Median | Sigma |
| A | 12 | 189 | 46361 | 264.47 | 851 | 835 | 172.1 |
| A | 1 | 162 | 16066 | 88.48 | 851 | 835 | 172.1 |
| A | 8 | 15 | 15602 | 85.78 | 851 | 835 | 172.1 |
| B | 4 | 239 | 795617 | 5047.08 | 833 | 814 | 157.5 |
| B | 3 | 64 | 145953 | 921.65 | 833 | 814 | 157.5 |
| B | 0 | 219 | 35975 | 223.28 | 833 | 814 | 157.5 |
| C | 13 | 61 | 6132 | 27.14 | 845 | 852 | 194.5 |
| C | 14 | 234 | 3720 | 14.74 | 845 | 852 | 194.5 |
| C | 15 | 208 | 3117 | 11.64 | 845 | 852 | 194.5 |
| D | 13 | 122 | 3821118 | 20640.52 | 767 | 747 | 185.1 |
| D | 1 | 52 | 174017 | 936.13 | 767 | 747 | 185.1 |
| D | 2 | 234 | 34072 | 180.05 | 767 | 747 | 185.1 |
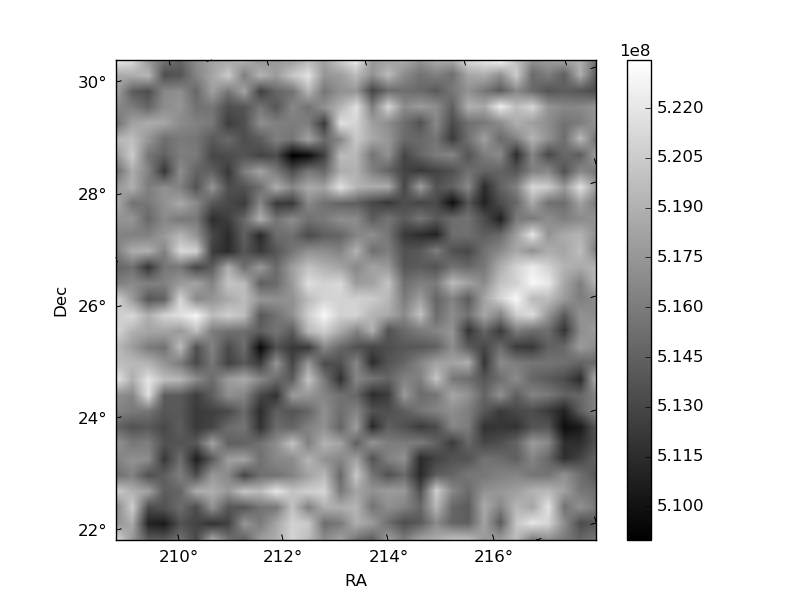
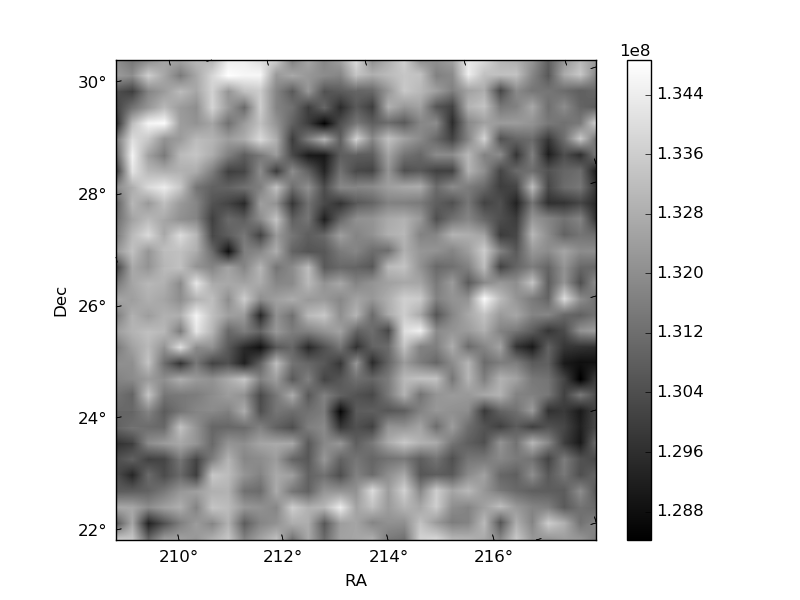
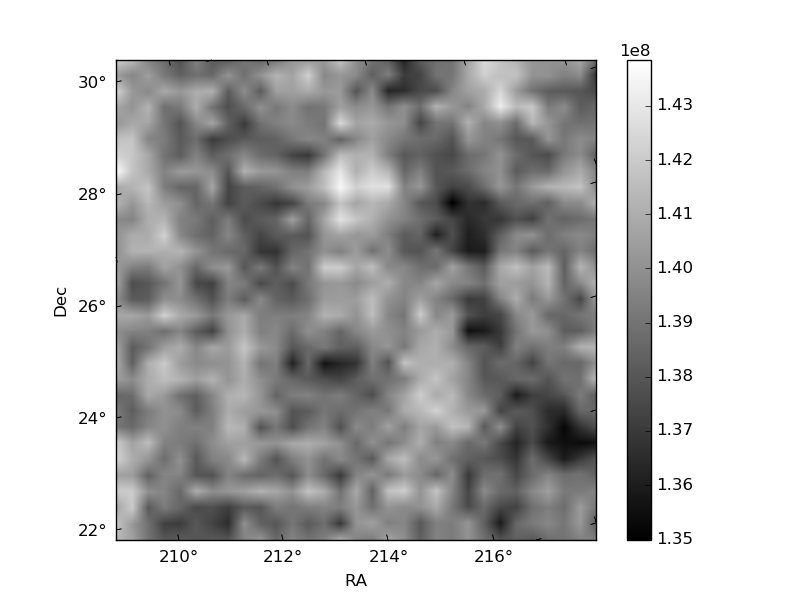
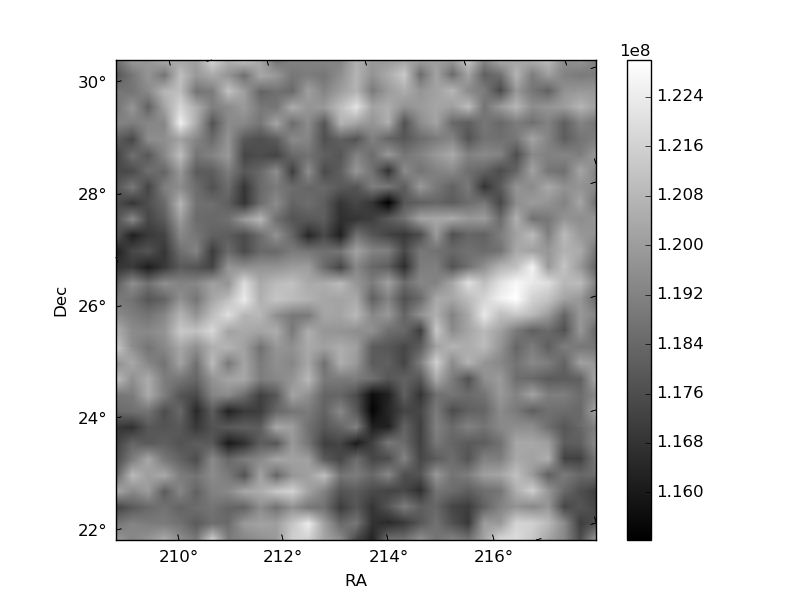
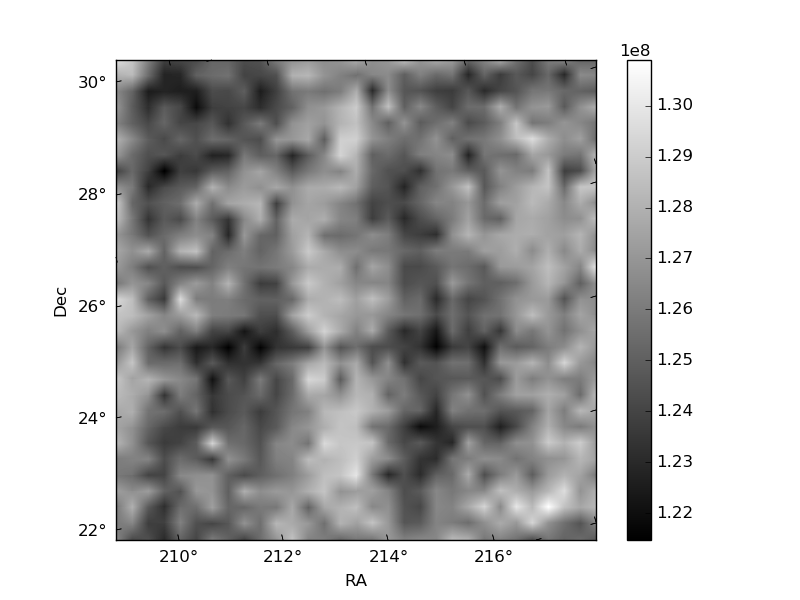
Histogram calculated using DETX and DETY for each event in the final _common_clean file
| Quadrant A | 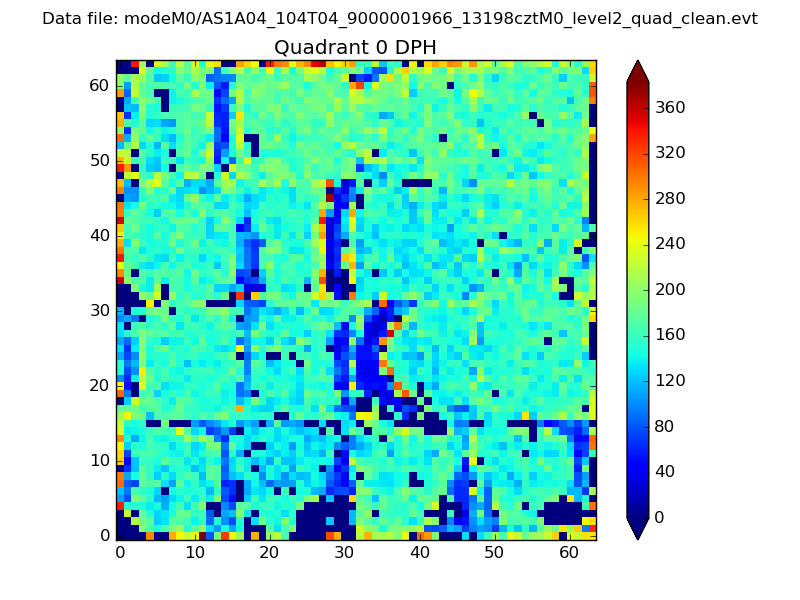 |
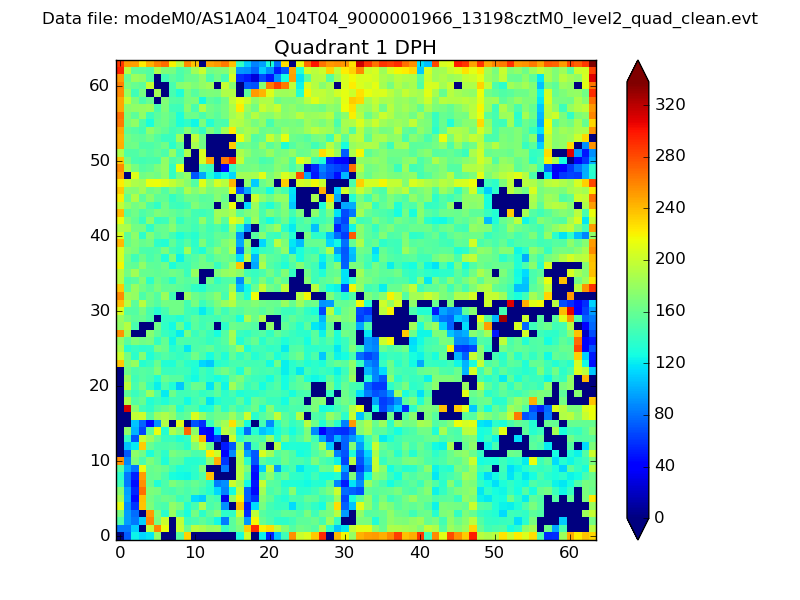 |
Quadrant B |
|---|---|---|---|
| Quadrant D | 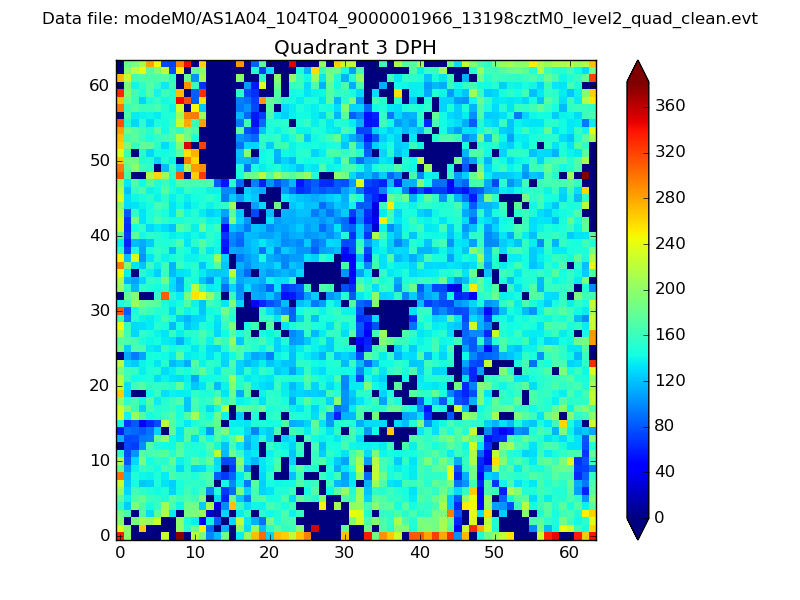 |
 |
Quadrant C |
| Plot type | Count rate plots | Images |
|---|---|---|
| Comparison with Poisson distribution Blue bars denote a histogram of data divided into 1 sec bins. Red curve is a Poisson curve with rate = median count rate of data. |
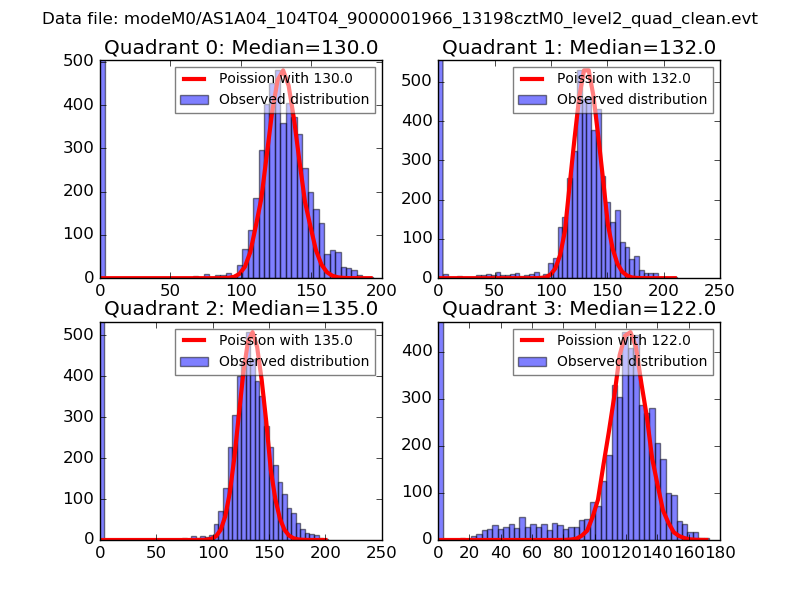 |
 |
| Quadrant-wise count rates Data is divided into 100 sec bins |
 |
|
| Module-wise count rates for Quadrant A Data is divided into 100 sec bins |
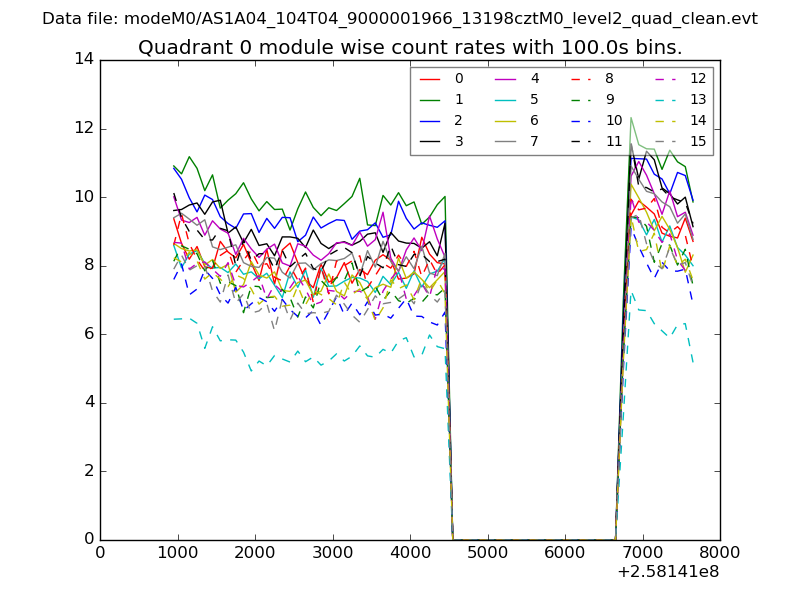 |
 |
| Module-wise count rates for Quadrant B Data is divided into 100 sec bins |
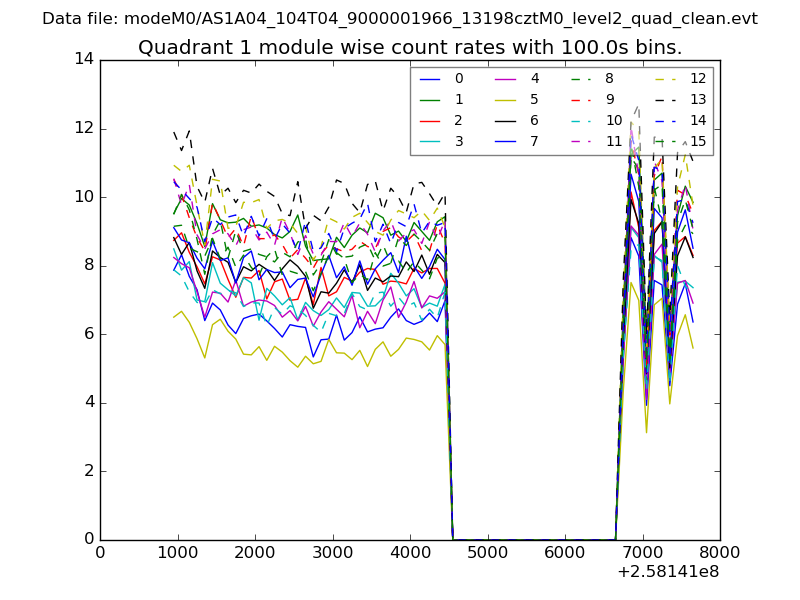 |
 |
| Module-wise count rates for Quadrant C Data is divided into 100 sec bins |
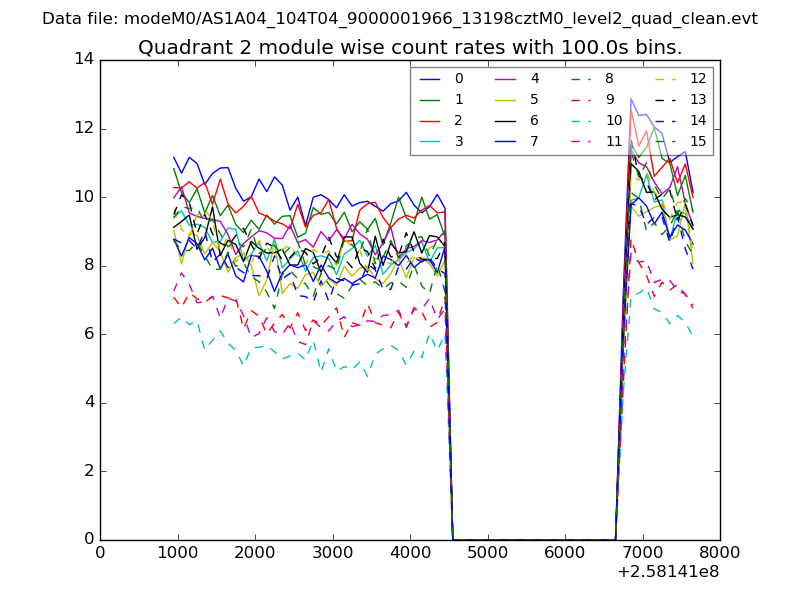 |
 |
| Module-wise count rates for Quadrant D Data is divided into 100 sec bins |
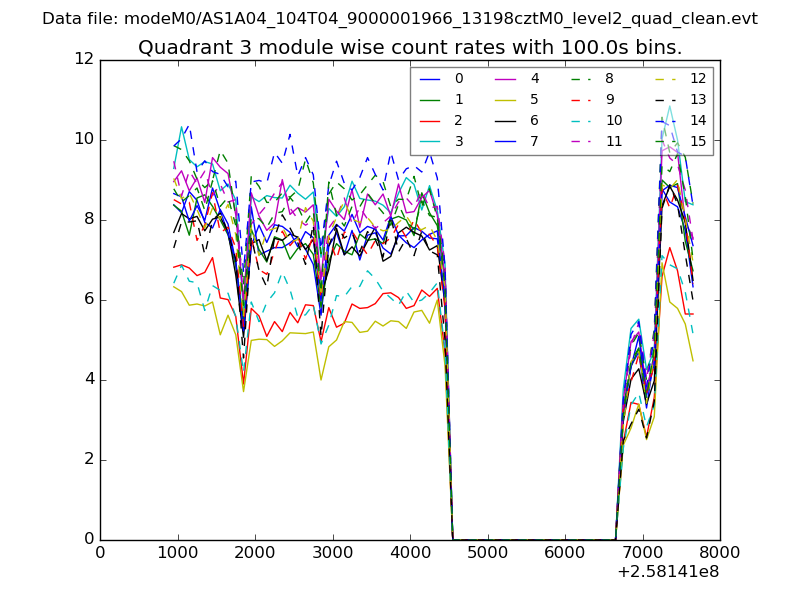 |
 |
| Parameter | Plot |
|---|---|
| CZT HV Monitor | 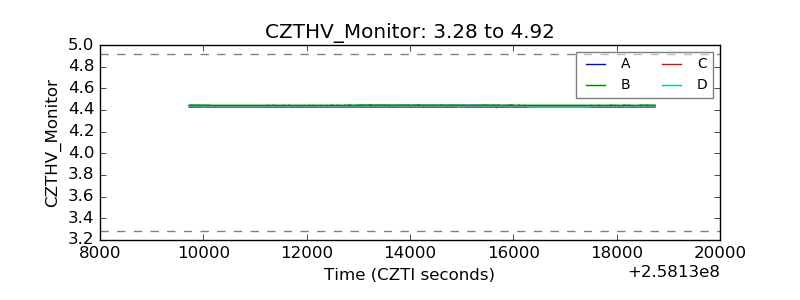 |
| D_VDD | 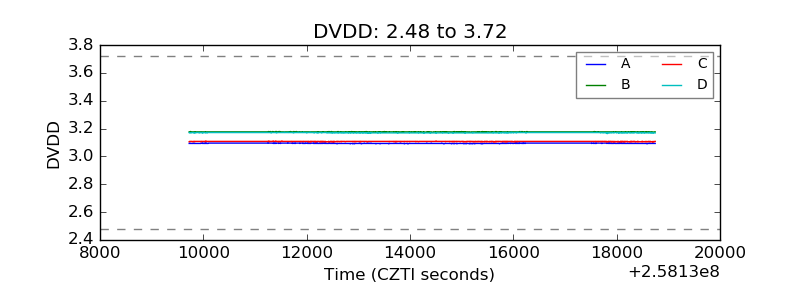 |
| Temperature 1 | 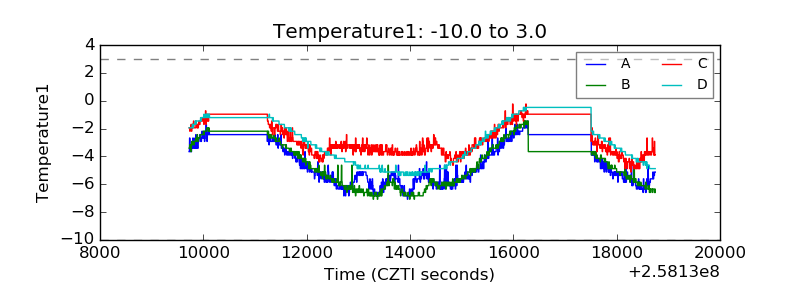 |
| Veto HV Monitor | 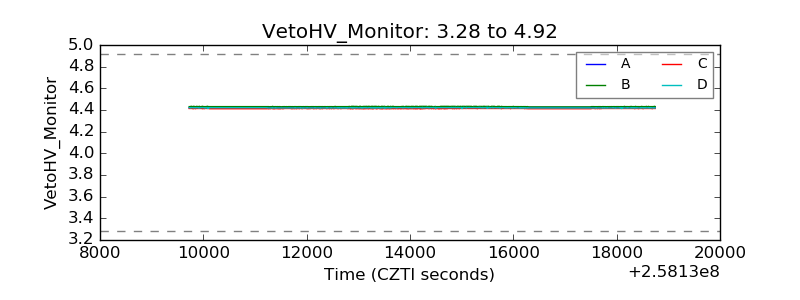 |
| Veto LLD | 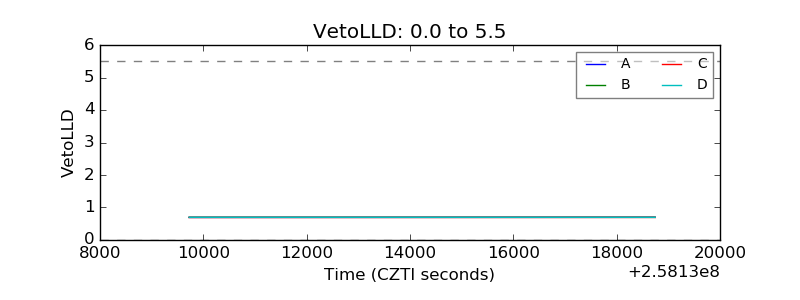 |
| Alpha Counter | 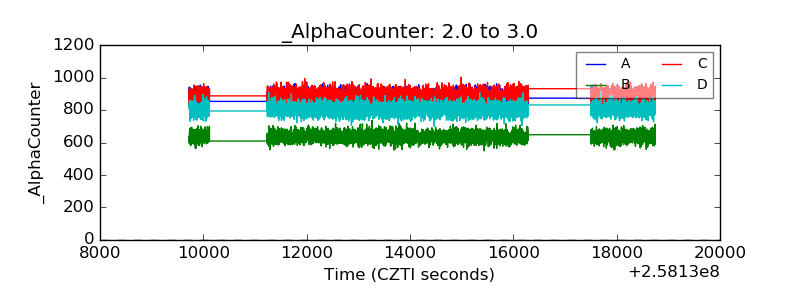 |
| _CPM_Rate | 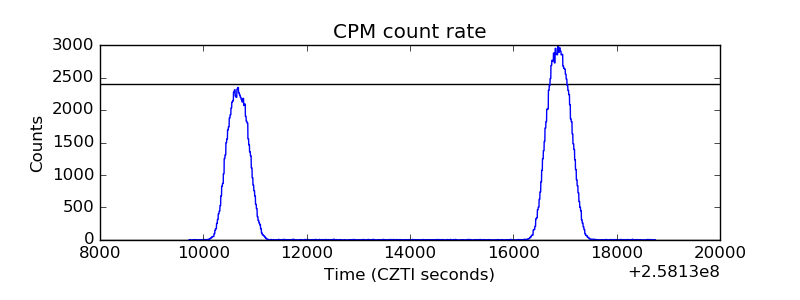 |
| CZT Counter |  |
| +2.5 Volts monitor |  |
| +5 Volts monitor |  |
| _ROLL_ROT | 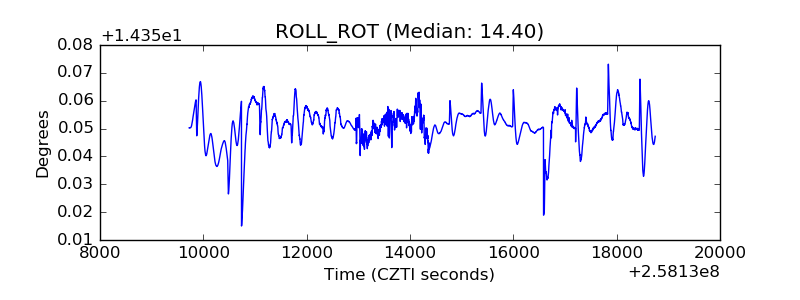 |
| _Roll_DEC | 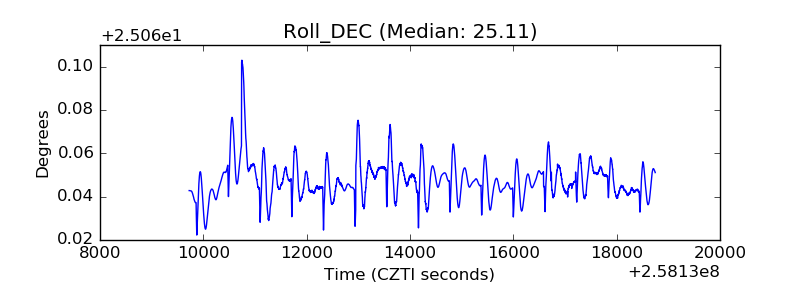 |
| _Roll_RA | 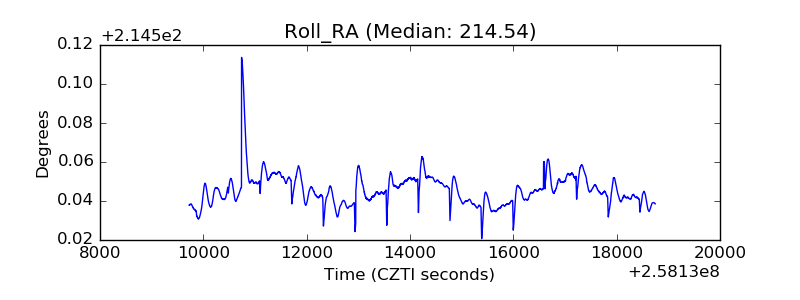 |
| Veto Counter | 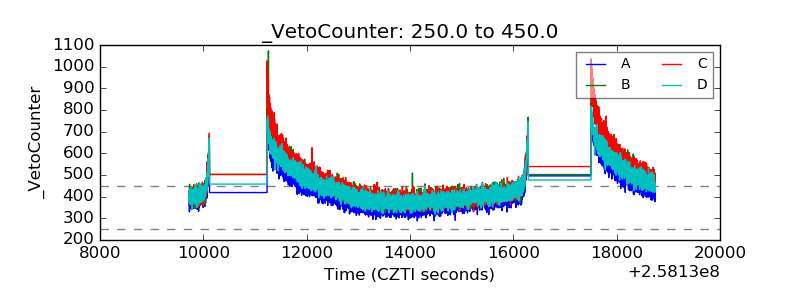 |