| Param | Original file | Final file |
|---|---|---|
| Filename | modeM0/AS1A04_104T04_9000001966_13200cztM0_level2.evt | modeM0/AS1A04_104T04_9000001966_13200cztM0_level2_quad_clean.evt |
| Size (bytes) | 626,002,560 | 99,273,600 |
| Size | 597.0 MB | 94.7 MB |
| Events in quadrant A | 3,036,111 | 672,000 |
| Events in quadrant B | 4,003,118 | 679,955 |
| Events in quadrant C | 3,027,303 | 690,134 |
| Events in quadrant D | 8,477,500 | 536,460 |
| Mode M9 | |||
|---|---|---|---|
| Quadrant | BADHDUFLAG | Total packets | Discarded packets |
| A | 0 | 13 | 0 |
| B | 0 | 13 | 0 |
| C | 0 | 13 | 0 |
| D | 0 | 14 | 0 |
| Mode M0 | |||
|---|---|---|---|
| Quadrant | BADHDUFLAG | Total packets | Discarded packets |
| A | 0 | 12961 | 3 |
| B | 0 | 15843 | 2 |
| C | 0 | 12925 | 2 |
| D | 0 | 29487 | 2 |
| Mode SS | |||
|---|---|---|---|
| Quadrant | BADHDUFLAG | Total packets | Discarded packets |
| A | 0 | 126 | 0 |
| B | 0 | 126 | 0 |
| C | 0 | 126 | 0 |
| D | 0 | 126 | 0 |
| Quadrant | Total seconds | Saturated seconds | Saturation percentage |
|---|---|---|---|
| A | 6116 | 16 | 0.261609% |
| B | 6116 | 343 | 5.608241% |
| C | 6116 | 12 | 0.196207% |
| D | 6116 | 1890 | 30.902551% |
Noise dominated data is calculated using 1-second bins in cleaned event files. If a bin has >2000 counts, and if more than 50% of those come from <1% of pixels, then it is considered to be noise-dominated and hence unusable.
| Quadrant | # 1 sec bins | Bins with >0 counts | Bins with >2000 counts | High rate bins dominated by noise | Noise dominated (total time) | Noise dominated (detector-on time) | Marked lightcurve |
|---|---|---|---|---|---|---|---|
| A | 7472 | 6118 | 0 | 0 | 0.00% | 0.00% | 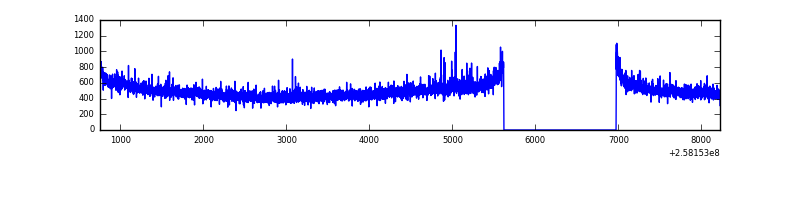 |
| B | 7472 | 6118 | 191 | 191 | 2.56% | 3.12% | 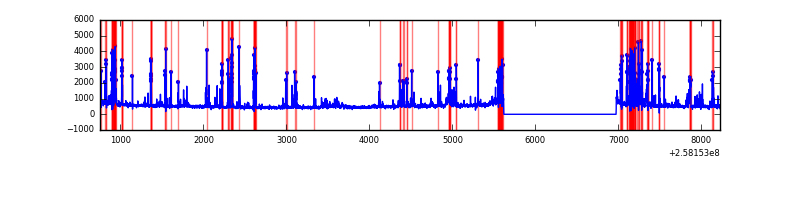 |
| C | 7472 | 6118 | 0 | 0 | 0.00% | 0.00% | 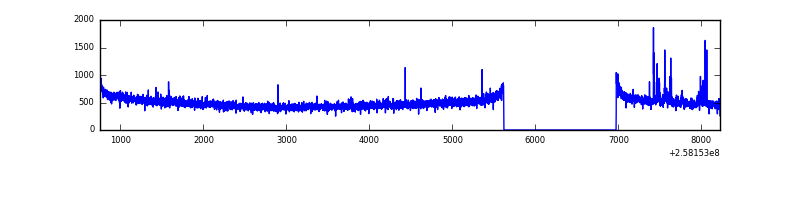 |
| D | 7472 | 6118 | 1428 | 1428 | 19.11% | 23.34% | 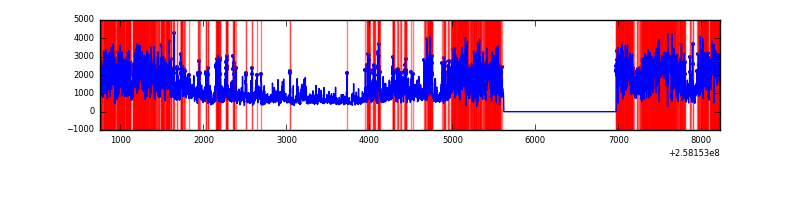 |
Top three noisy pixels from each quadrant. If the there are fewer than three noisy pixels in the level2.evt file, extra rows are filled as -1
| Pixel properties | Quadrant properties | ||||||
|---|---|---|---|---|---|---|---|
| Quadrant | DetID | PixID | Counts | Sigma | Mean | Median | Sigma |
| A | 1 | 162 | 25766 | 158.71 | 773 | 758 | 157.6 |
| A | 4 | 2 | 9073 | 52.77 | 773 | 758 | 157.6 |
| A | 1 | 178 | 8827 | 51.21 | 773 | 758 | 157.6 |
| B | 4 | 239 | 816885 | 5657.22 | 767 | 748 | 144.3 |
| B | 4 | 173 | 64431 | 441.43 | 767 | 748 | 144.3 |
| B | 3 | 64 | 48088 | 328.15 | 767 | 748 | 144.3 |
| C | 15 | 208 | 43537 | 244.56 | 764 | 772 | 174.9 |
| C | 13 | 61 | 5684 | 28.09 | 764 | 772 | 174.9 |
| C | 3 | 233 | 2319 | 8.85 | 764 | 772 | 174.9 |
| D | 13 | 122 | 5542711 | 36018.41 | 642 | 623 | 153.9 |
| D | 1 | 52 | 410546 | 2664.12 | 642 | 623 | 153.9 |
| D | 2 | 234 | 22893 | 144.73 | 642 | 623 | 153.9 |
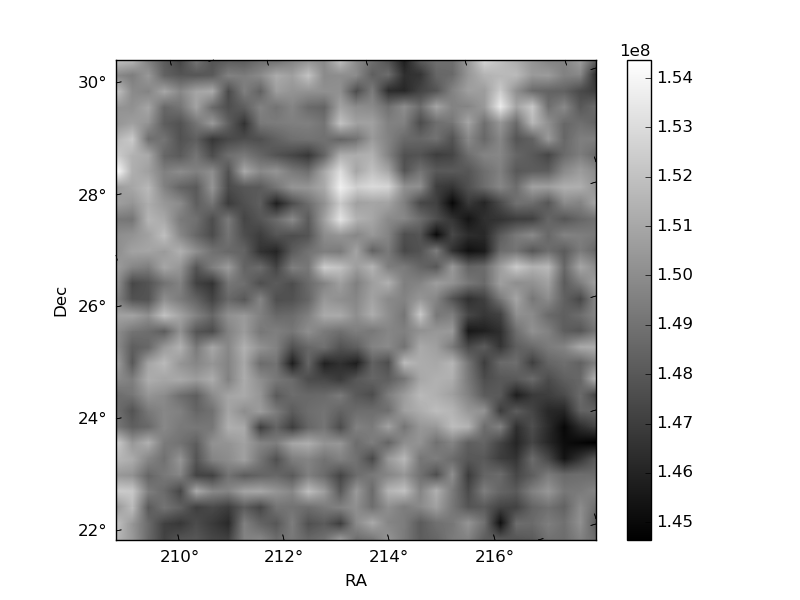
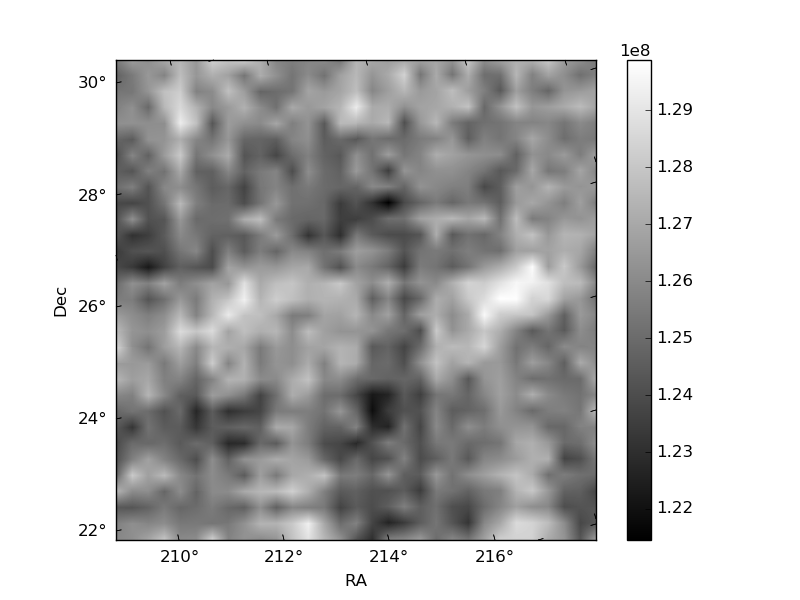
Histogram calculated using DETX and DETY for each event in the final _common_clean file
| Quadrant A |  |
 |
Quadrant B |
|---|---|---|---|
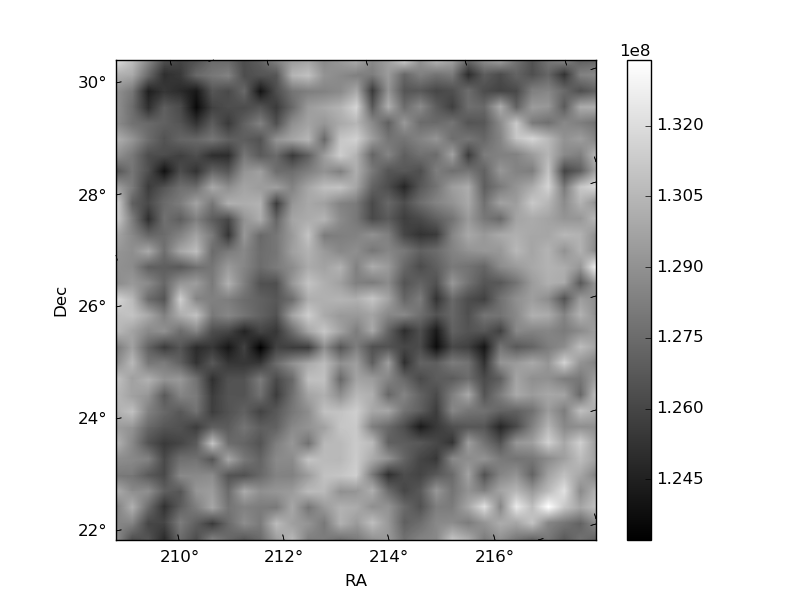
| Quadrant D |  |
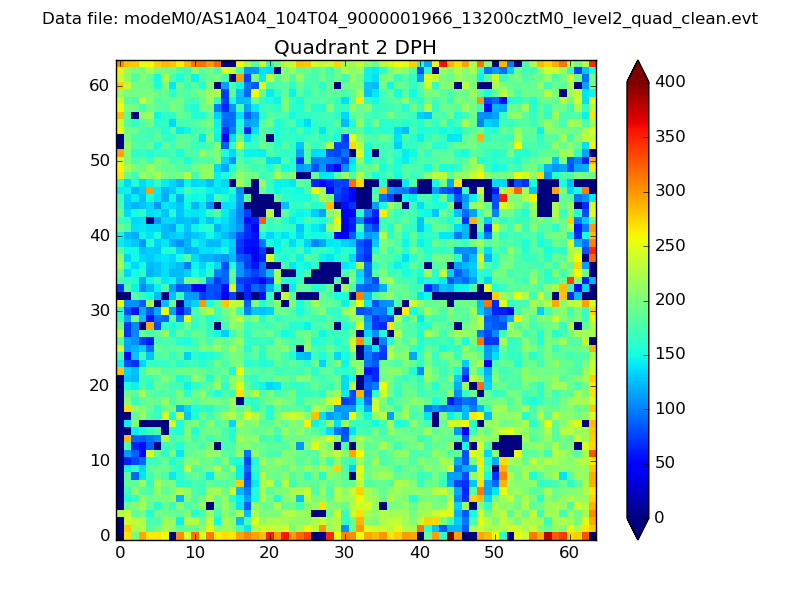 |
Quadrant C |
| Plot type | Count rate plots | Images |
|---|---|---|
| Comparison with Poisson distribution Blue bars denote a histogram of data divided into 1 sec bins. Red curve is a Poisson curve with rate = median count rate of data. |
 |
 |
| Quadrant-wise count rates Data is divided into 100 sec bins |
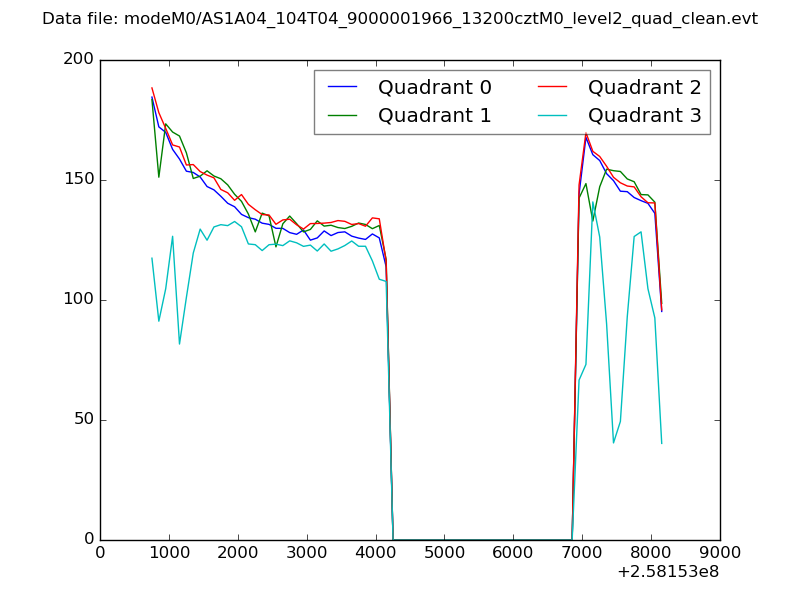 |
|
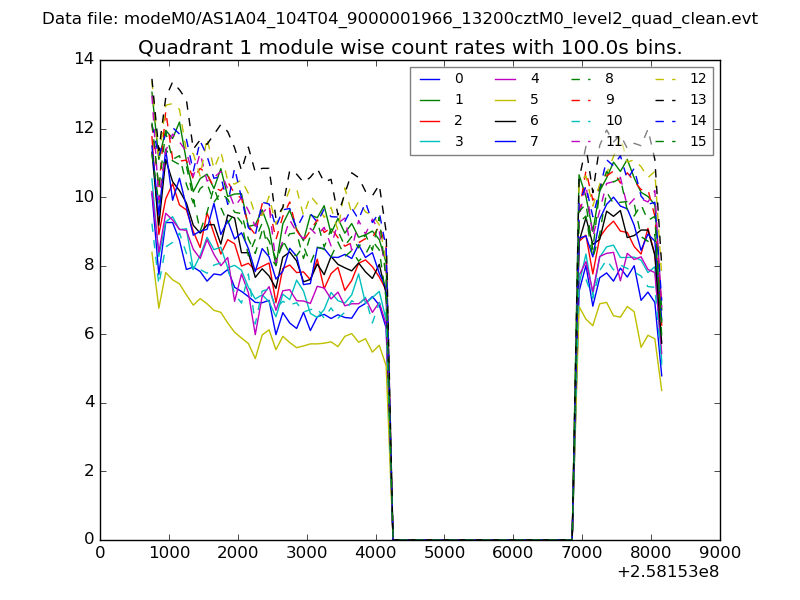
| Module-wise count rates for Quadrant A Data is divided into 100 sec bins |
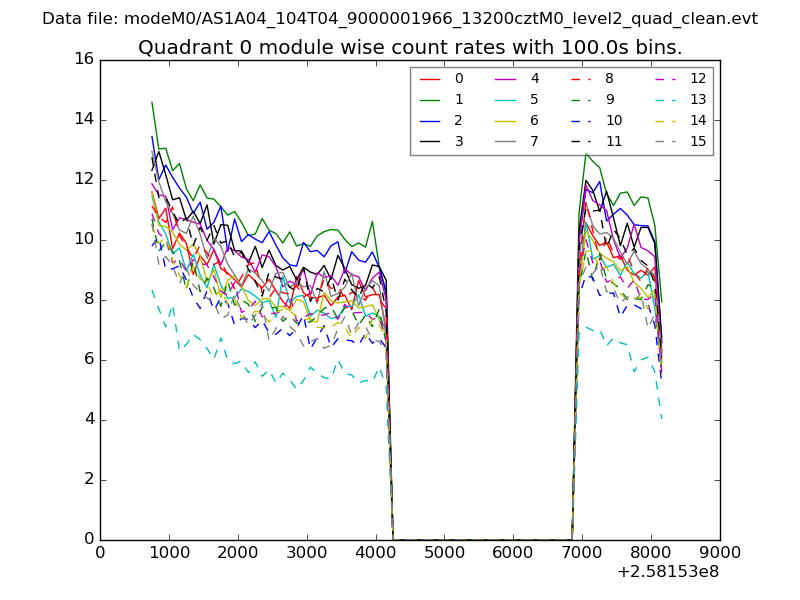 |
 |
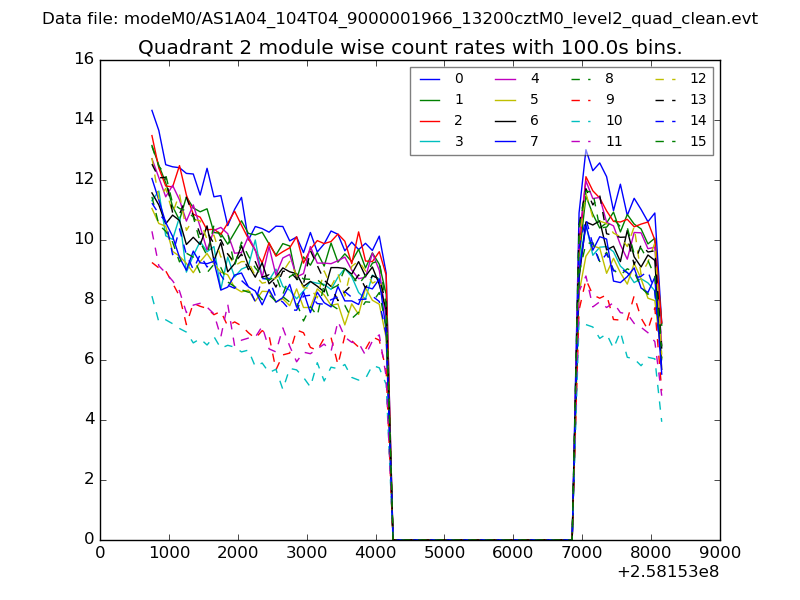
| Module-wise count rates for Quadrant B Data is divided into 100 sec bins |
 |
 |
| Module-wise count rates for Quadrant C Data is divided into 100 sec bins |
 |
 |
| Module-wise count rates for Quadrant D Data is divided into 100 sec bins |
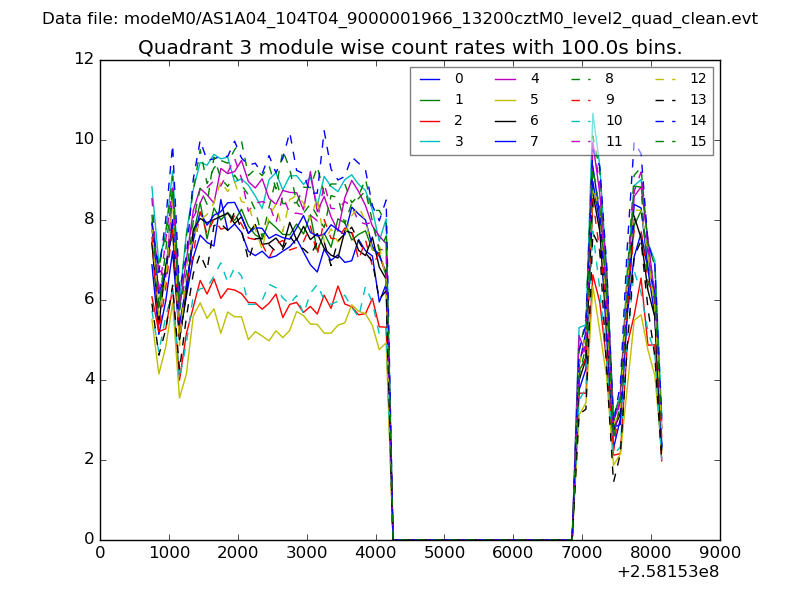 |
 |
| Parameter | Plot |
|---|---|
| CZT HV Monitor | 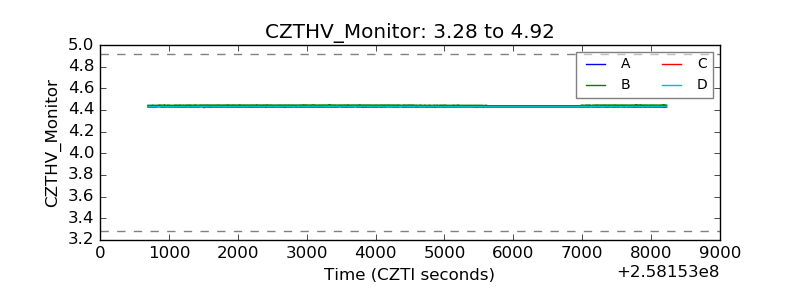 |
| D_VDD | 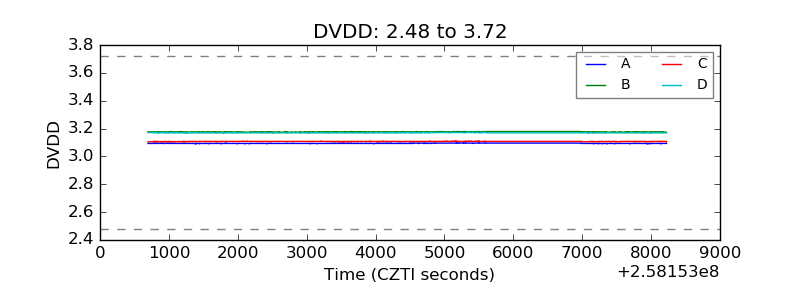 |
| Temperature 1 | 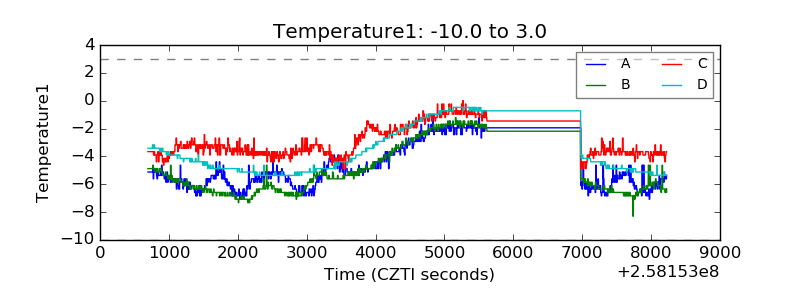 |
| Veto HV Monitor | 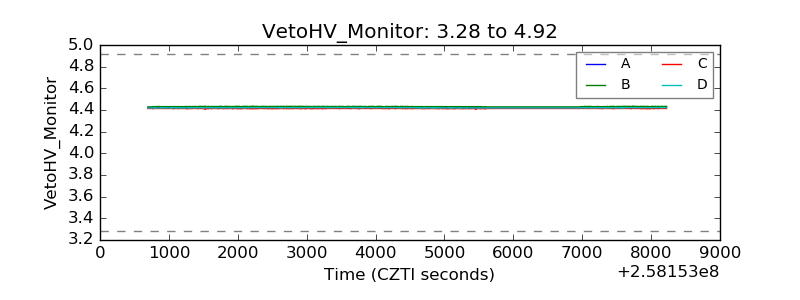 |
| Veto LLD |  |
| Alpha Counter | 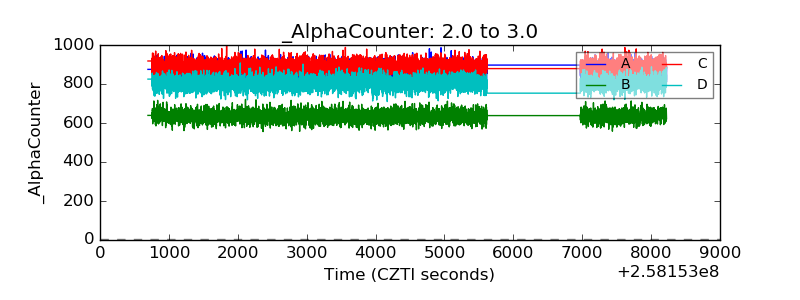 |
| _CPM_Rate | 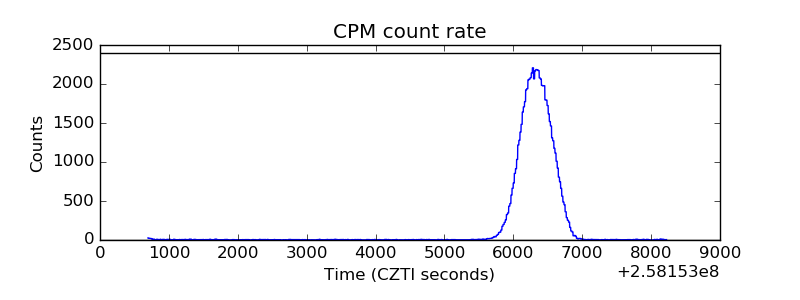 |
| CZT Counter | 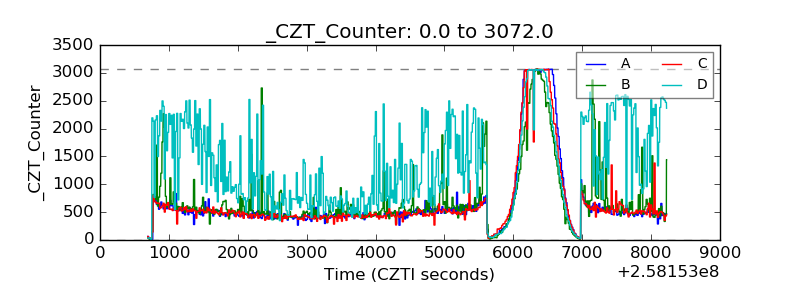 |
| +2.5 Volts monitor |  |
| +5 Volts monitor | 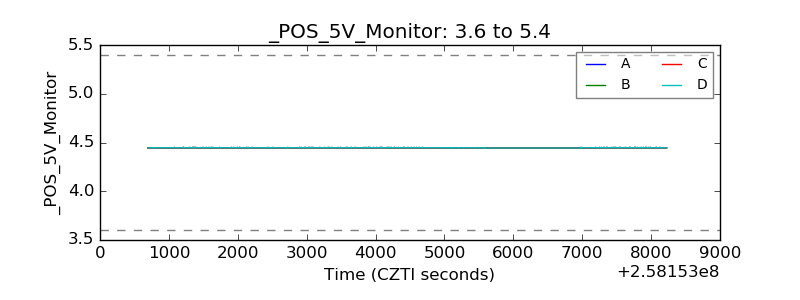 |
| _ROLL_ROT | 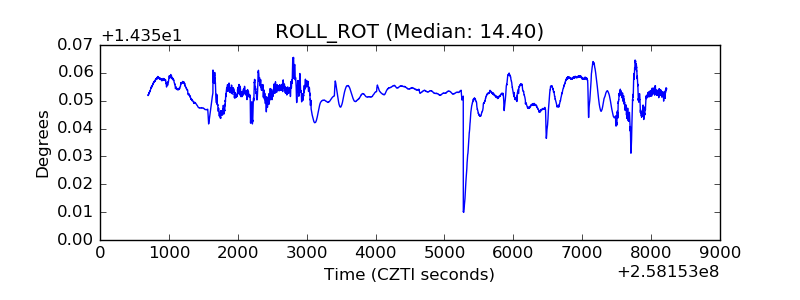 |
| _Roll_DEC | 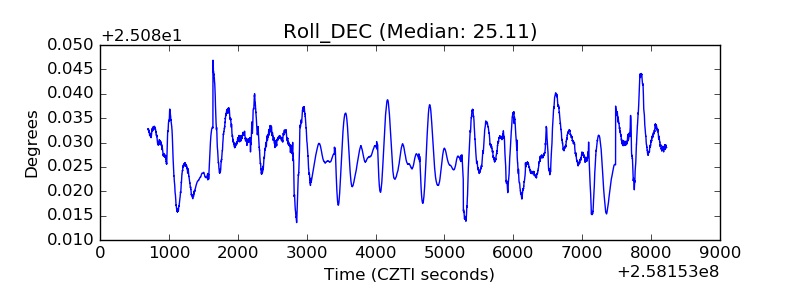 |
| _Roll_RA |  |
| Veto Counter | 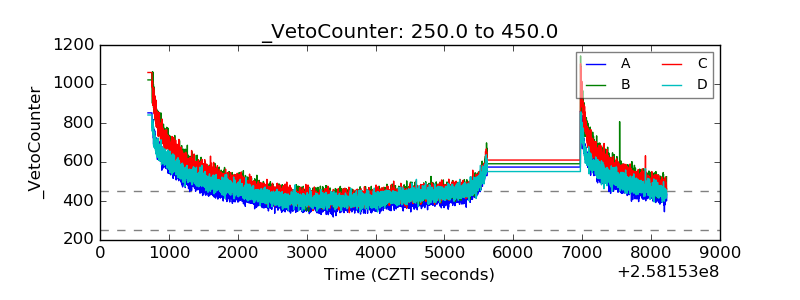 |