| Param | Original file | Final file |
|---|---|---|
| Filename | modeM0/AS1A04_104T04_9000001966_13201cztM0_level2.evt | modeM0/AS1A04_104T04_9000001966_13201cztM0_level2_quad_clean.evt |
| Size (bytes) | 755,922,240 | 88,813,440 |
| Size | 720.9 MB | 84.7 MB |
| Events in quadrant A | 3,068,592 | 603,794 |
| Events in quadrant B | 3,724,892 | 616,427 |
| Events in quadrant C | 3,063,760 | 615,387 |
| Events in quadrant D | 12,613,802 | 417,400 |
| Mode M9 | |||
|---|---|---|---|
| Quadrant | BADHDUFLAG | Total packets | Discarded packets |
| A | 0 | 24 | 0 |
| B | 0 | 24 | 0 |
| C | 0 | 24 | 0 |
| D | 0 | 25 | 0 |
| Mode M0 | |||
|---|---|---|---|
| Quadrant | BADHDUFLAG | Total packets | Discarded packets |
| A | 0 | 13128 | 3 |
| B | 0 | 15073 | 2 |
| C | 0 | 13214 | 2 |
| D | 0 | 41705 | 2 |
| Mode SS | |||
|---|---|---|---|
| Quadrant | BADHDUFLAG | Total packets | Discarded packets |
| A | 0 | 128 | 0 |
| B | 0 | 128 | 0 |
| C | 0 | 128 | 0 |
| D | 0 | 128 | 0 |
| Quadrant | Total seconds | Saturated seconds | Saturation percentage |
|---|---|---|---|
| A | 6239 | 51 | 0.817439% |
| B | 6239 | 249 | 3.991024% |
| C | 6239 | 38 | 0.609072% |
| D | 6239 | 4153 | 66.565155% |
Noise dominated data is calculated using 1-second bins in cleaned event files. If a bin has >2000 counts, and if more than 50% of those come from <1% of pixels, then it is considered to be noise-dominated and hence unusable.
| Quadrant | # 1 sec bins | Bins with >0 counts | Bins with >2000 counts | High rate bins dominated by noise | Noise dominated (total time) | Noise dominated (detector-on time) | Marked lightcurve |
|---|---|---|---|---|---|---|---|
| A | 7530 | 6242 | 0 | 0 | 0.00% | 0.00% | 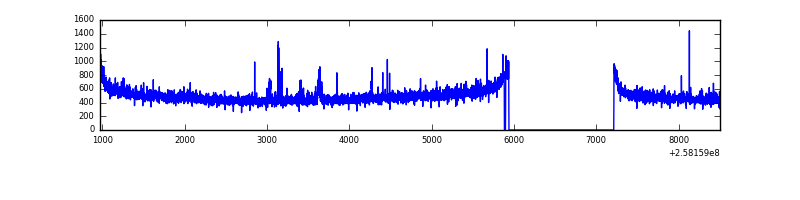 |
| B | 7530 | 6242 | 105 | 105 | 1.39% | 1.68% | 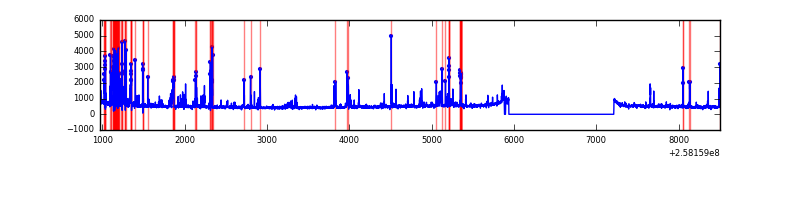 |
| C | 7530 | 6242 | 4 | 4 | 0.05% | 0.06% | 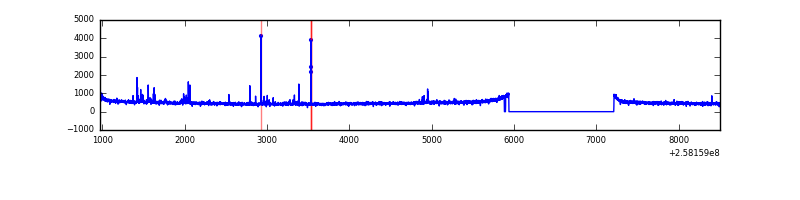 |
| D | 7530 | 6242 | 3552 | 3552 | 47.17% | 56.90% | 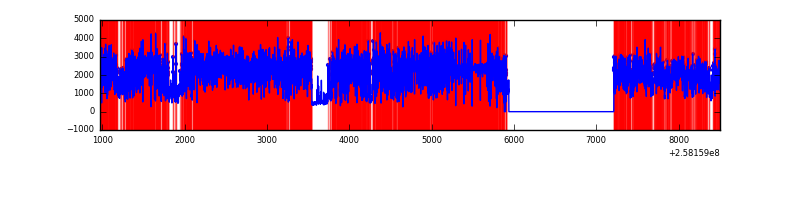 |
Top three noisy pixels from each quadrant. If the there are fewer than three noisy pixels in the level2.evt file, extra rows are filled as -1
| Pixel properties | Quadrant properties | ||||||
|---|---|---|---|---|---|---|---|
| Quadrant | DetID | PixID | Counts | Sigma | Mean | Median | Sigma |
| A | 1 | 162 | 26007 | 159.05 | 778 | 762 | 158.7 |
| A | 4 | 2 | 17985 | 108.51 | 778 | 762 | 158.7 |
| A | 9 | 143 | 11332 | 66.59 | 778 | 762 | 158.7 |
| B | 4 | 239 | 445763 | 3010.43 | 778 | 761 | 147.8 |
| B | 4 | 173 | 111821 | 751.32 | 778 | 761 | 147.8 |
| B | 3 | 209 | 44333 | 294.76 | 778 | 761 | 147.8 |
| C | 15 | 208 | 82485 | 464.72 | 764 | 770 | 175.8 |
| C | 13 | 61 | 5519 | 27.01 | 764 | 770 | 175.8 |
| C | 8 | 222 | 1975 | 6.85 | 764 | 770 | 175.8 |
| D | 13 | 122 | 10188215 | 81854.5 | 514 | 501 | 124.5 |
| D | 1 | 52 | 400208 | 3211.5 | 514 | 501 | 124.5 |
| D | 14 | 34 | 22391 | 175.88 | 514 | 501 | 124.5 |
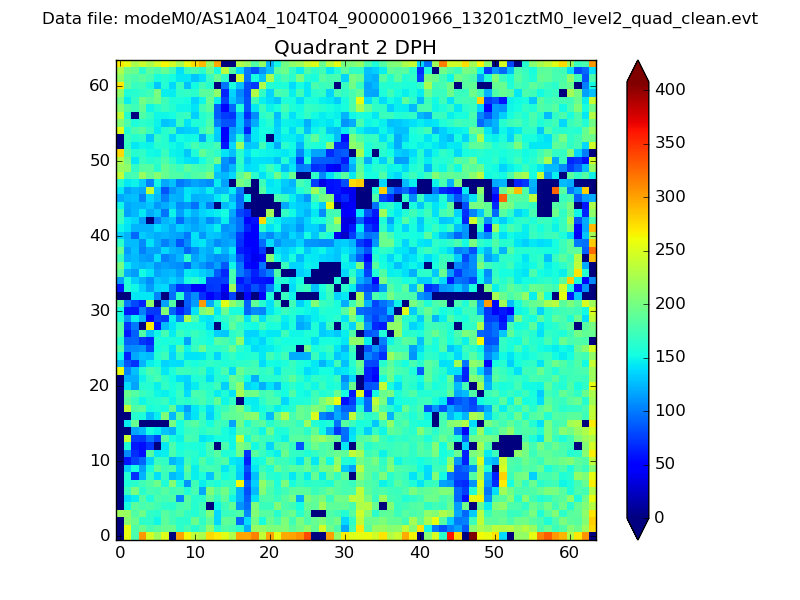
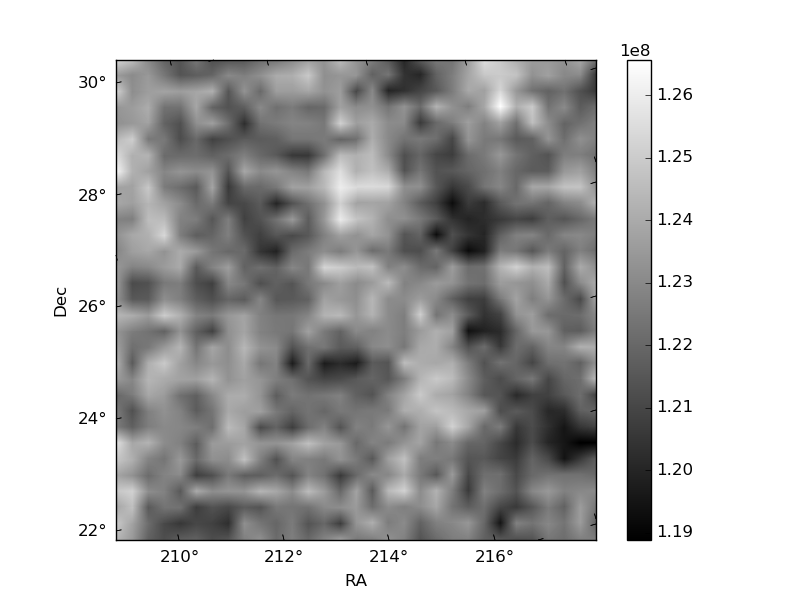
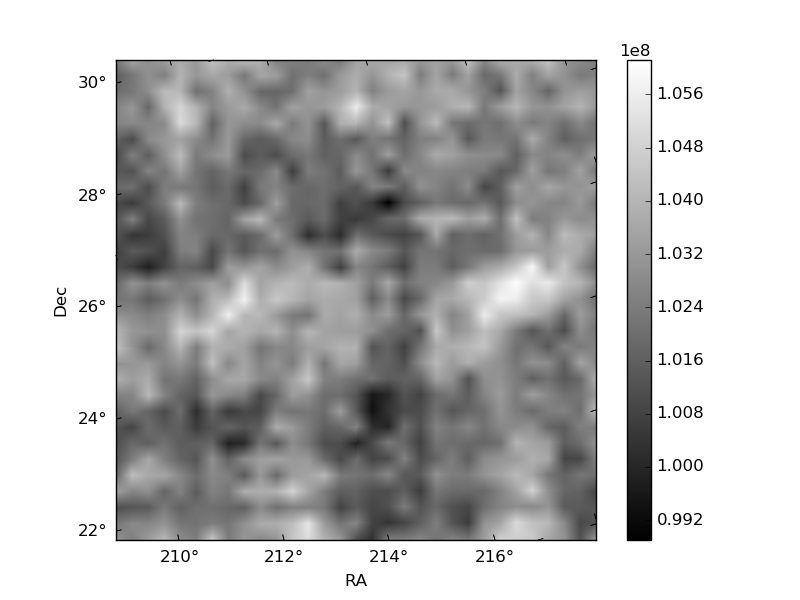
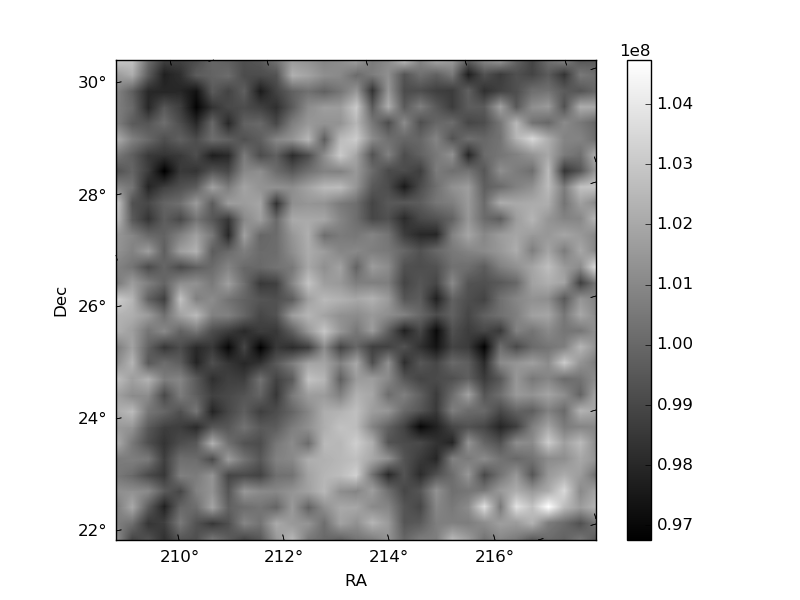
Histogram calculated using DETX and DETY for each event in the final _common_clean file
| Quadrant A | 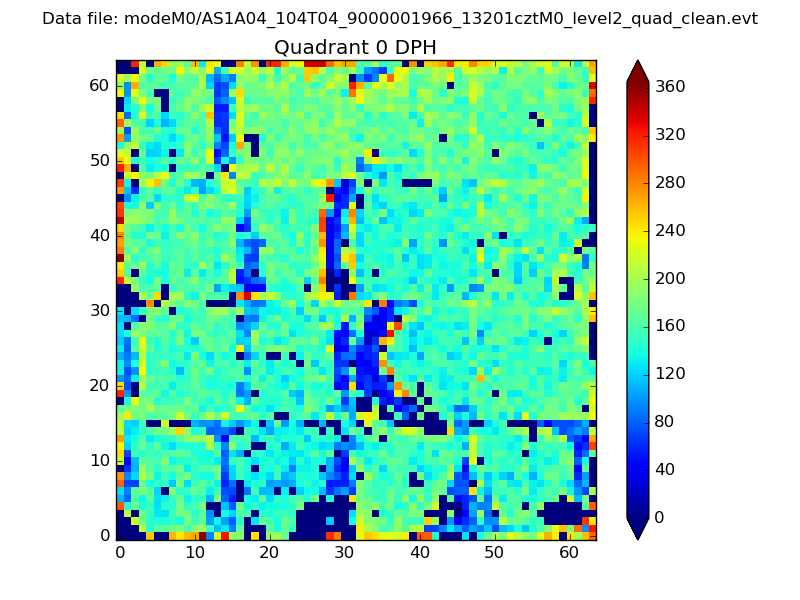 |
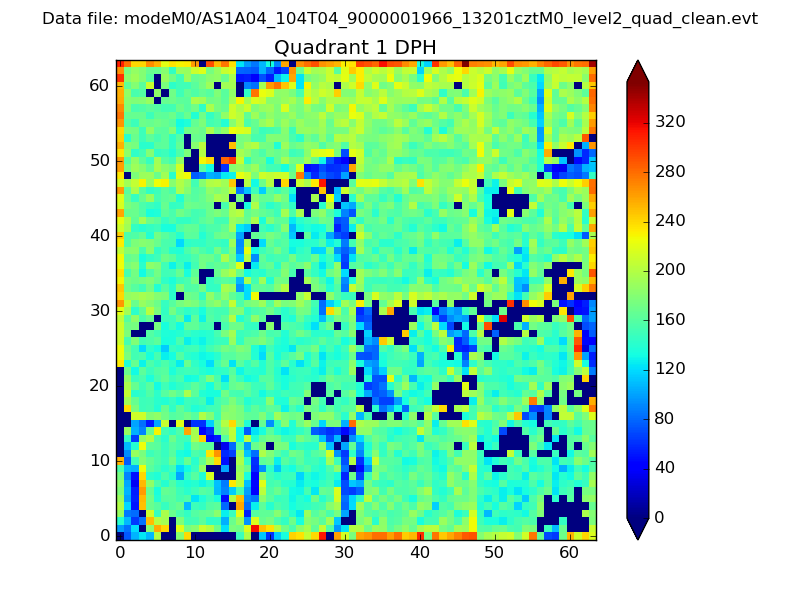 |
Quadrant B |
|---|---|---|---|
| Quadrant D | 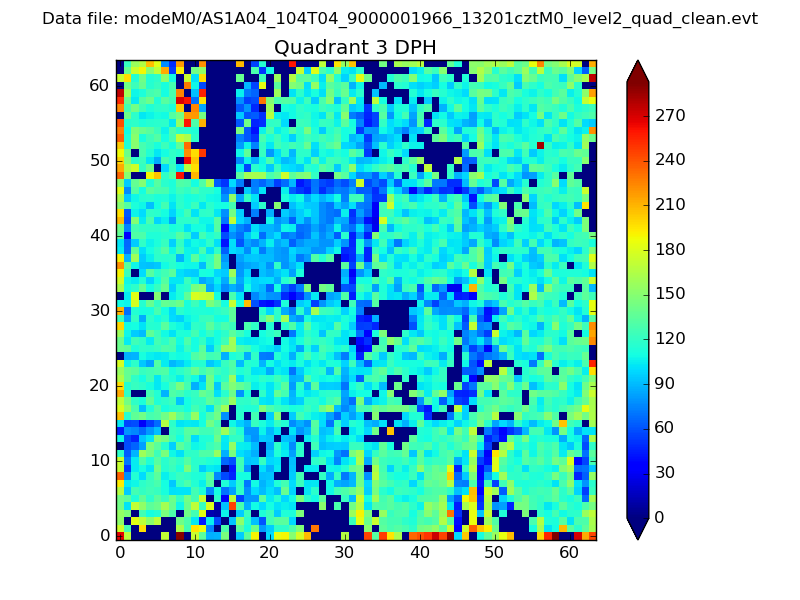 |
 |
Quadrant C |
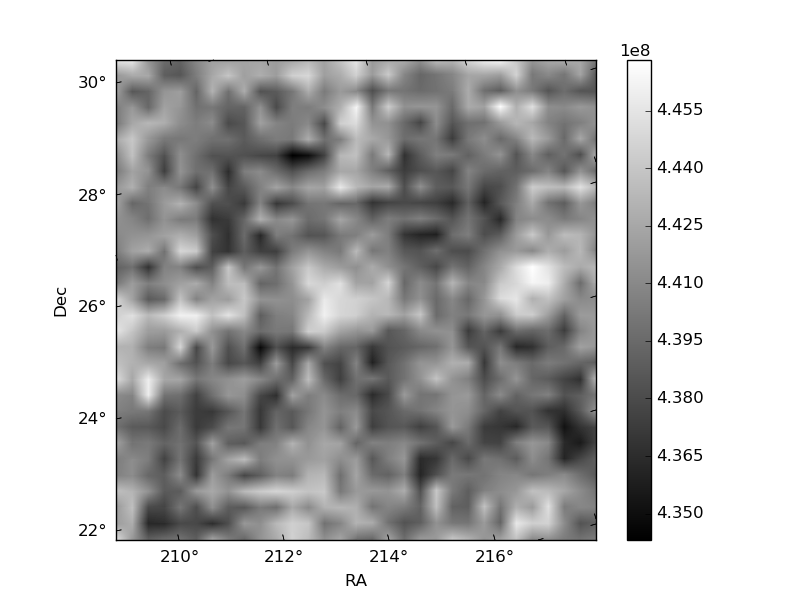
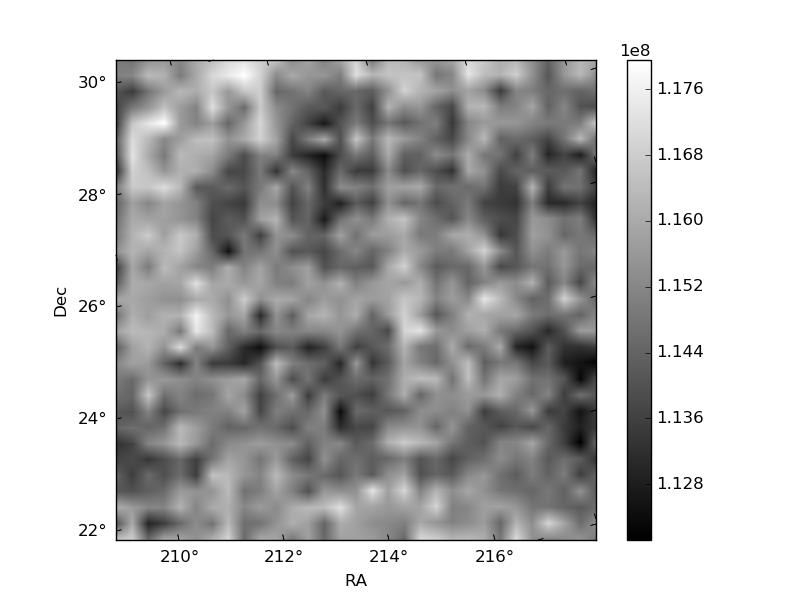
| Plot type | Count rate plots | Images |
|---|---|---|
| Comparison with Poisson distribution Blue bars denote a histogram of data divided into 1 sec bins. Red curve is a Poisson curve with rate = median count rate of data. |
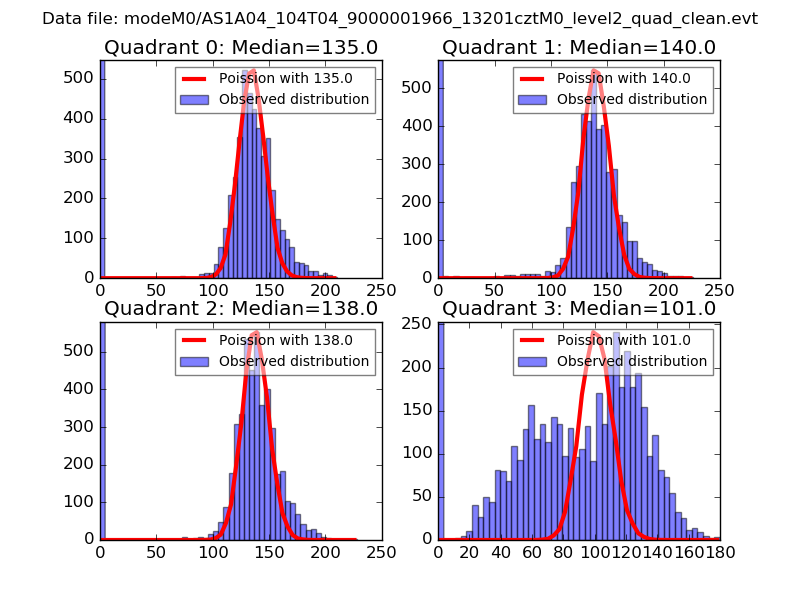 |
 |
| Quadrant-wise count rates Data is divided into 100 sec bins |
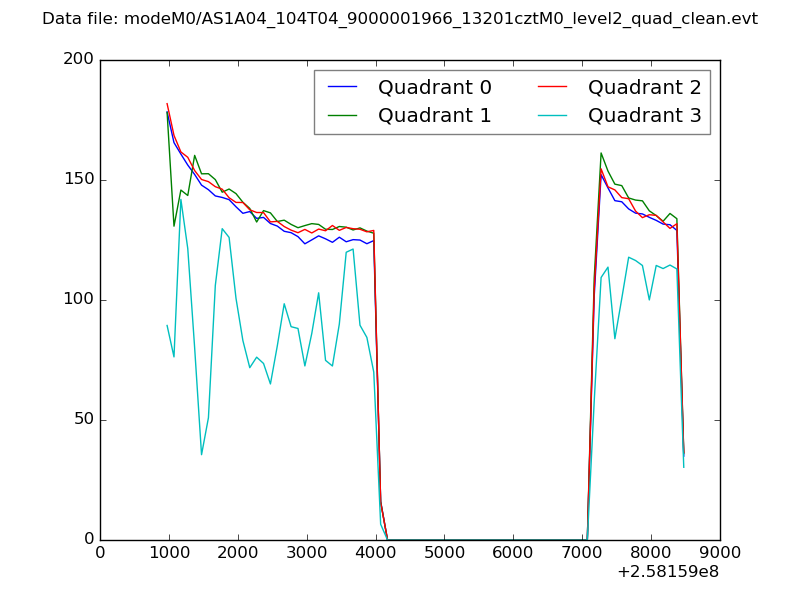 |
|
| Module-wise count rates for Quadrant A Data is divided into 100 sec bins |
 |
 |
| Module-wise count rates for Quadrant B Data is divided into 100 sec bins |
 |
 |
| Module-wise count rates for Quadrant C Data is divided into 100 sec bins |
 |
 |
| Module-wise count rates for Quadrant D Data is divided into 100 sec bins |
 |
 |
| Parameter | Plot |
|---|---|
| CZT HV Monitor | 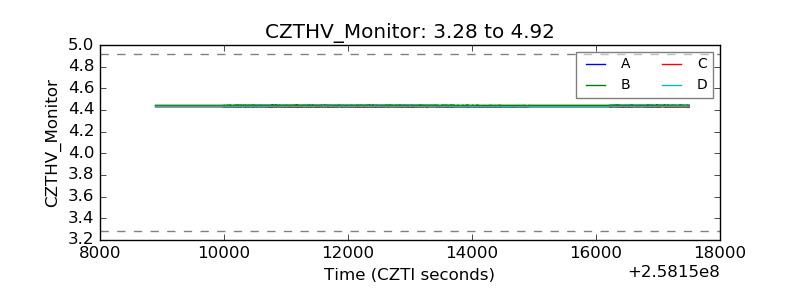 |
| D_VDD | 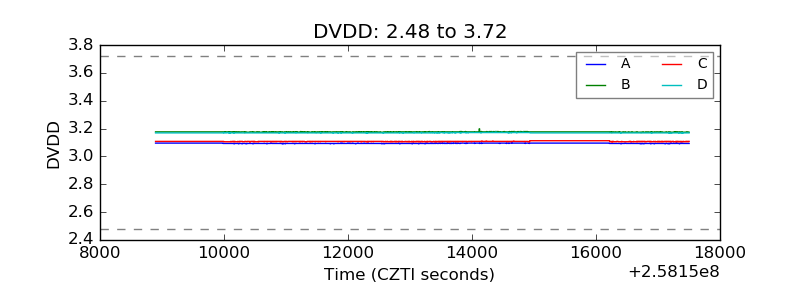 |
| Temperature 1 | 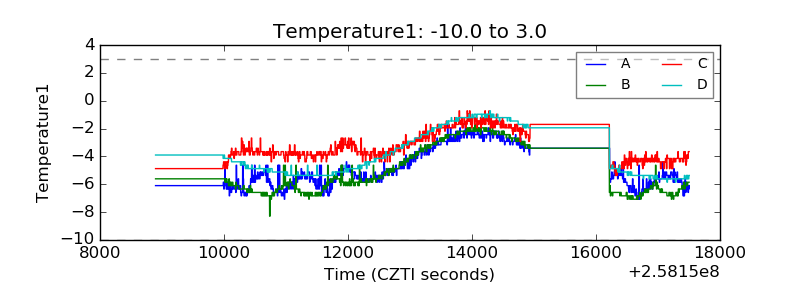 |
| Veto HV Monitor | 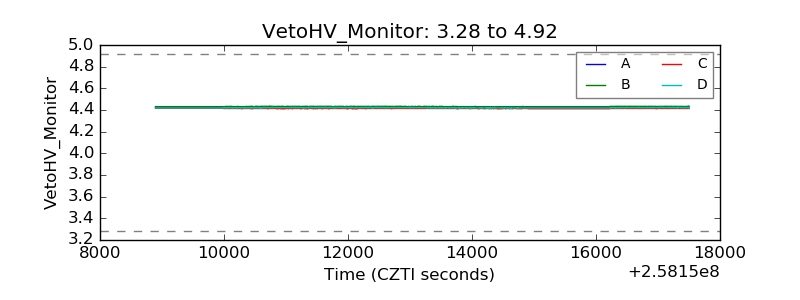 |
| Veto LLD | 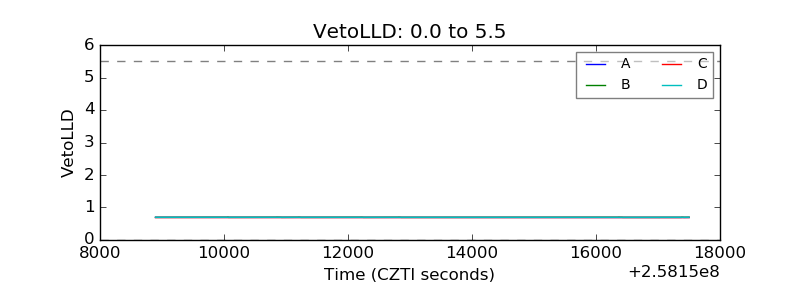 |
| Alpha Counter | 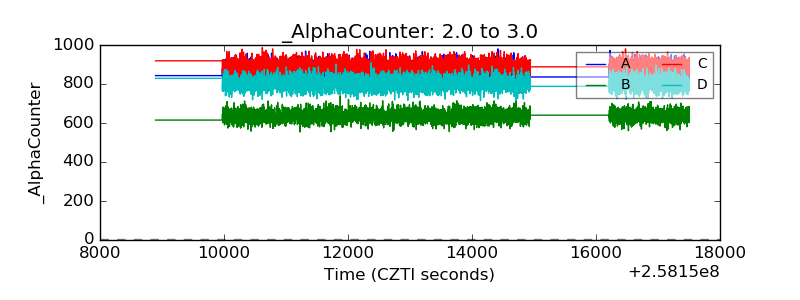 |
| _CPM_Rate | 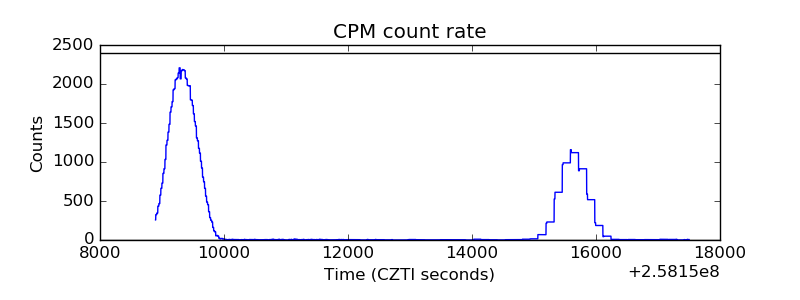 |
| CZT Counter | 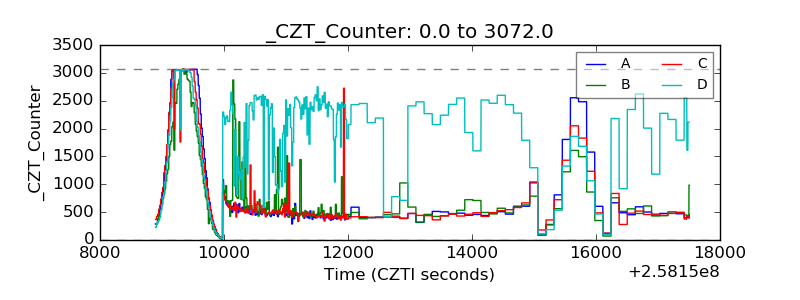 |
| +2.5 Volts monitor | 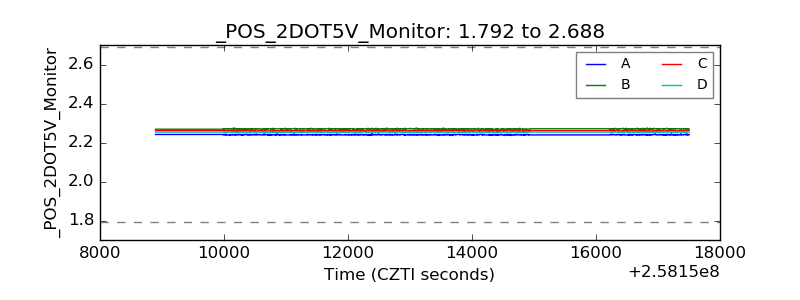 |
| +5 Volts monitor |  |
| _ROLL_ROT |  |
| _Roll_DEC | 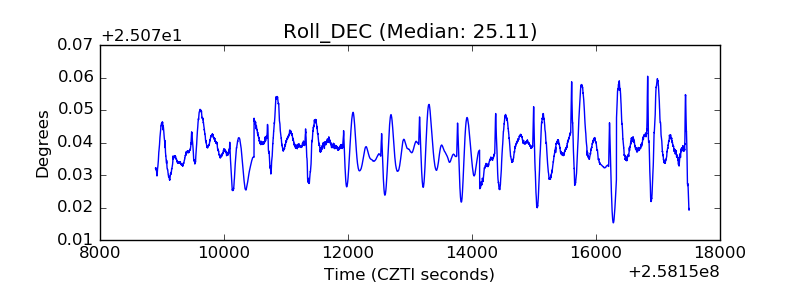 |
| _Roll_RA | 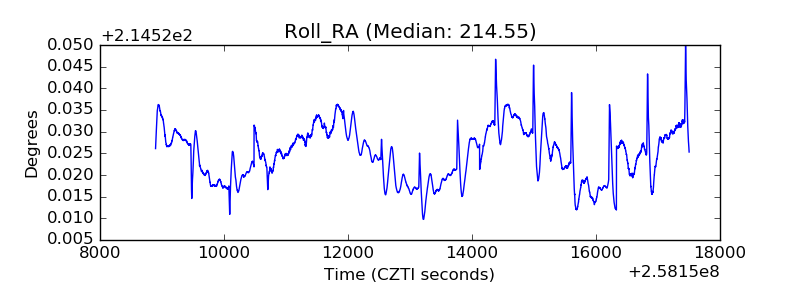 |
| Veto Counter |  |