| Param | Original file | Final file |
|---|---|---|
| Filename | modeM0/AS1A04_104T04_9000001966_13202cztM0_level2.evt | modeM0/AS1A04_104T04_9000001966_13202cztM0_level2_quad_clean.evt |
| Size (bytes) | 650,021,760 | 91,558,080 |
| Size | 619.9 MB | 87.3 MB |
| Events in quadrant A | 3,196,489 | 588,435 |
| Events in quadrant B | 3,671,587 | 604,503 |
| Events in quadrant C | 3,127,796 | 599,470 |
| Events in quadrant D | 9,229,512 | 505,643 |
| Mode M9 | |||
|---|---|---|---|
| Quadrant | BADHDUFLAG | Total packets | Discarded packets |
| A | 0 | 15 | 0 |
| B | 0 | 15 | 0 |
| C | 0 | 15 | 0 |
| D | 0 | 16 | 0 |
| Mode M0 | |||
|---|---|---|---|
| Quadrant | BADHDUFLAG | Total packets | Discarded packets |
| A | 0 | 14062 | 3 |
| B | 0 | 15411 | 2 |
| C | 0 | 13997 | 2 |
| D | 0 | 32191 | 2 |
| Mode SS | |||
|---|---|---|---|
| Quadrant | BADHDUFLAG | Total packets | Discarded packets |
| A | 0 | 138 | 0 |
| B | 0 | 138 | 0 |
| C | 0 | 138 | 0 |
| D | 0 | 138 | 0 |
| Quadrant | Total seconds | Saturated seconds | Saturation percentage |
|---|---|---|---|
| A | 6804 | 29 | 0.426220% |
| B | 6804 | 145 | 2.131099% |
| C | 6804 | 14 | 0.205761% |
| D | 6804 | 1657 | 24.353322% |
Noise dominated data is calculated using 1-second bins in cleaned event files. If a bin has >2000 counts, and if more than 50% of those come from <1% of pixels, then it is considered to be noise-dominated and hence unusable.
| Quadrant | # 1 sec bins | Bins with >0 counts | Bins with >2000 counts | High rate bins dominated by noise | Noise dominated (total time) | Noise dominated (detector-on time) | Marked lightcurve |
|---|---|---|---|---|---|---|---|
| A | 7930 | 6806 | 1 | 1 | 0.01% | 0.01% | 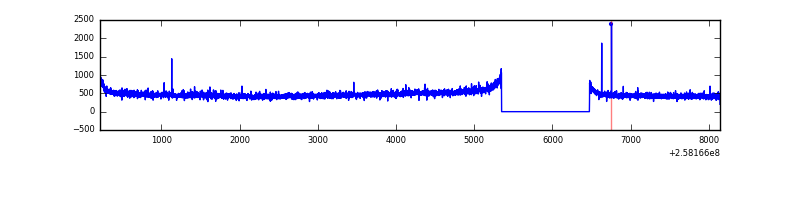 |
| B | 7930 | 6806 | 59 | 59 | 0.74% | 0.87% | 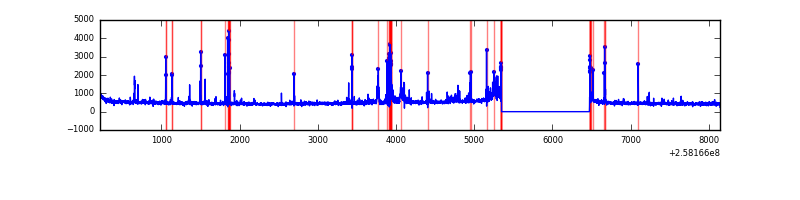 |
| C | 7930 | 6806 | 0 | 0 | 0.00% | 0.00% | 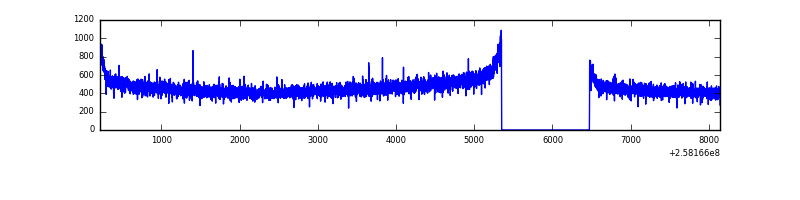 |
| D | 7930 | 6806 | 1347 | 1347 | 16.99% | 19.79% | 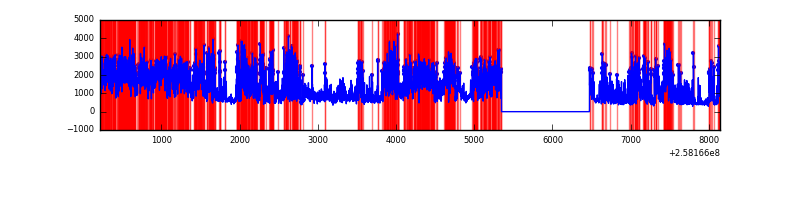 |
Top three noisy pixels from each quadrant. If the there are fewer than three noisy pixels in the level2.evt file, extra rows are filled as -1
| Pixel properties | Quadrant properties | ||||||
|---|---|---|---|---|---|---|---|
| Quadrant | DetID | PixID | Counts | Sigma | Mean | Median | Sigma |
| A | 1 | 162 | 18114 | 104.2 | 821 | 803 | 166.1 |
| A | 12 | 96 | 9982 | 55.25 | 821 | 803 | 166.1 |
| A | 0 | 226 | 7334 | 39.31 | 821 | 803 | 166.1 |
| B | 4 | 239 | 387789 | 2468.64 | 821 | 802 | 156.8 |
| B | 3 | 64 | 32298 | 200.92 | 821 | 802 | 156.8 |
| B | 0 | 214 | 22183 | 136.39 | 821 | 802 | 156.8 |
| C | 13 | 61 | 5714 | 26.43 | 801 | 806 | 185.7 |
| C | 15 | 208 | 3480 | 14.4 | 801 | 806 | 185.7 |
| C | 8 | 222 | 2597 | 9.65 | 801 | 806 | 185.7 |
| D | 13 | 122 | 5804863 | 33048.4 | 731 | 710 | 175.6 |
| D | 1 | 52 | 473274 | 2690.74 | 731 | 710 | 175.6 |
| D | 10 | 157 | 131636 | 745.48 | 731 | 710 | 175.6 |
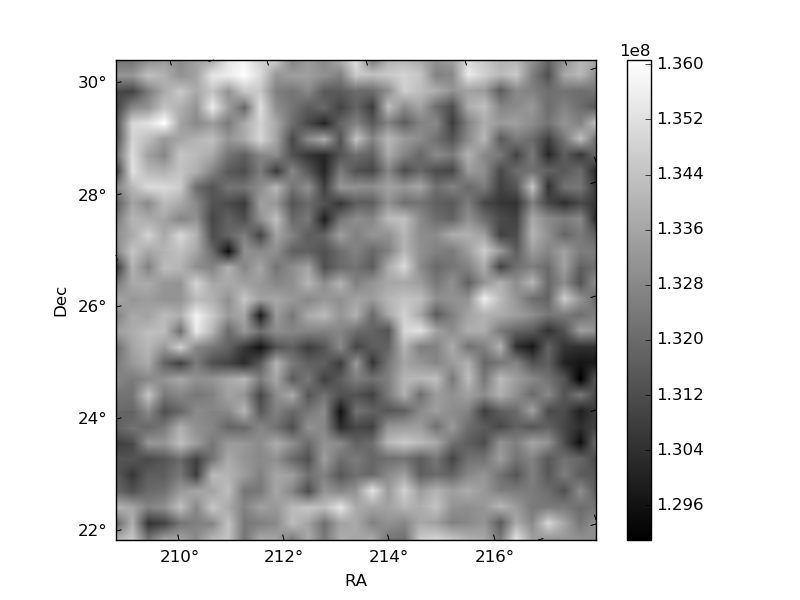
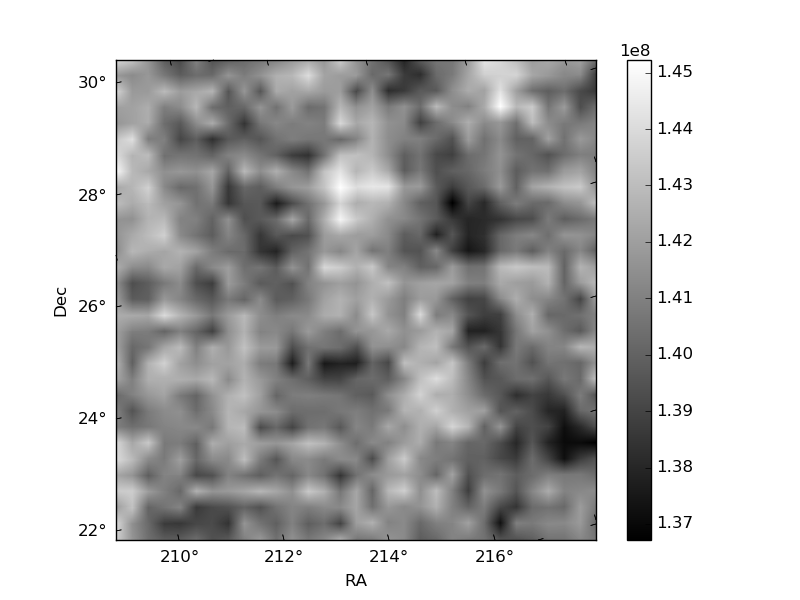
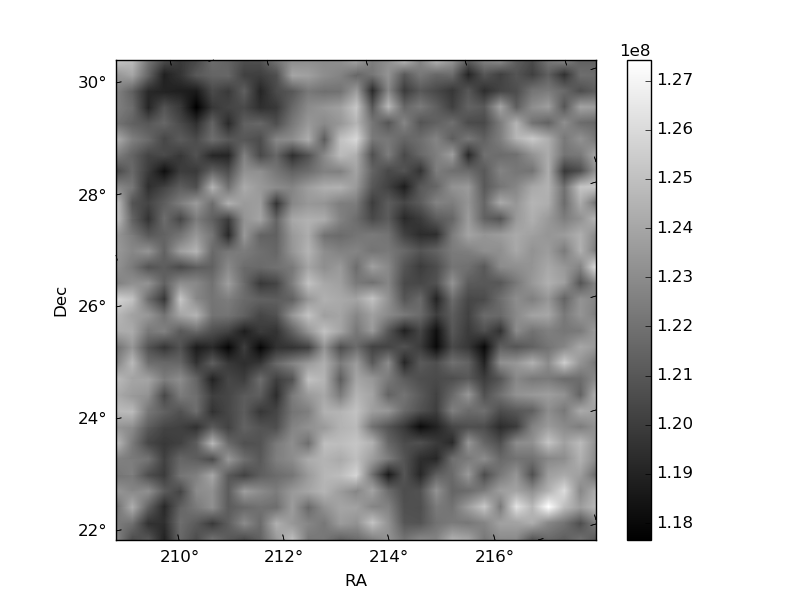
Histogram calculated using DETX and DETY for each event in the final _common_clean file
| Quadrant A | 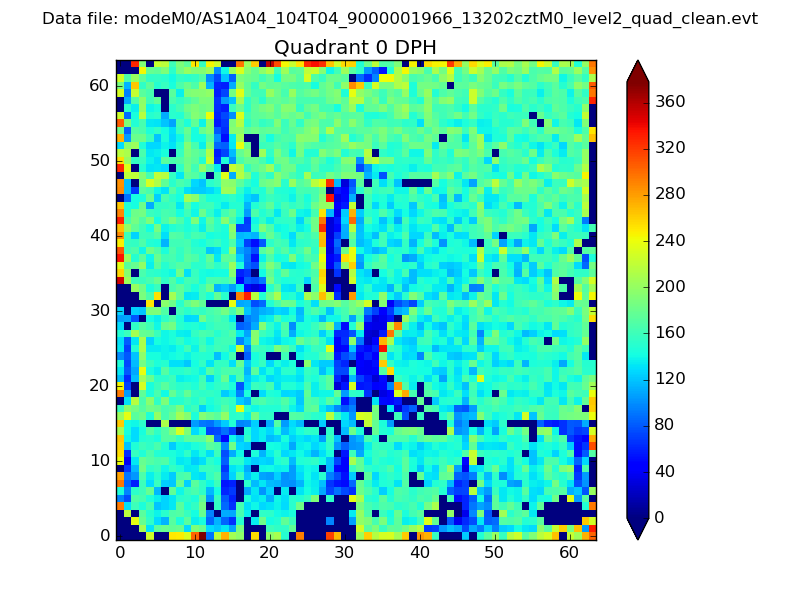 |
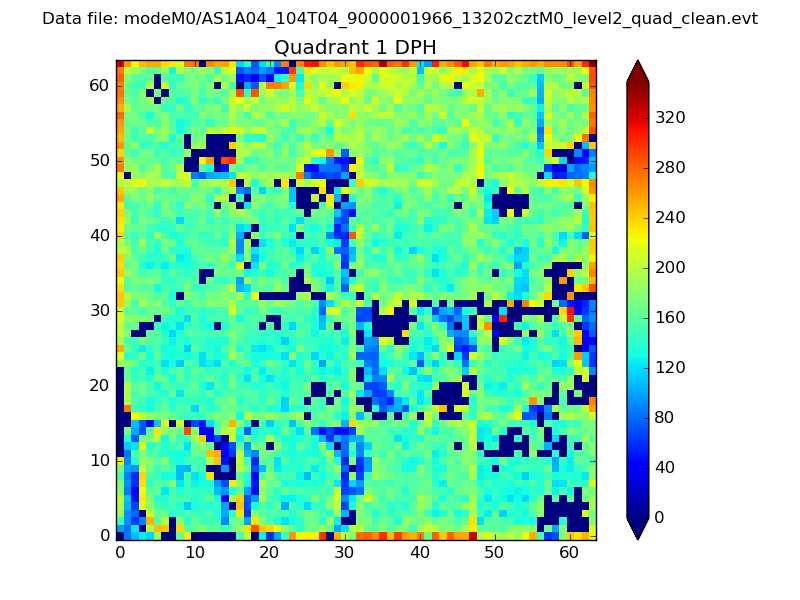 |
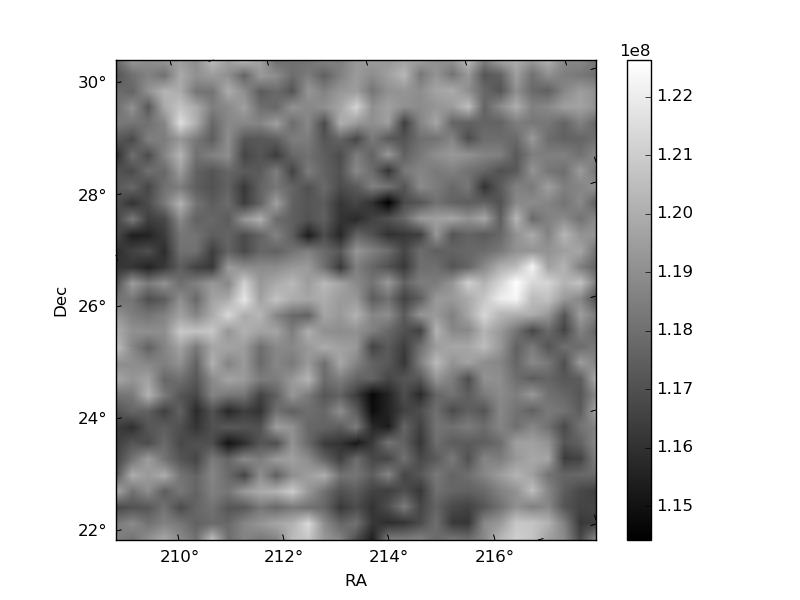
Quadrant B |
|---|---|---|---|
| Quadrant D | 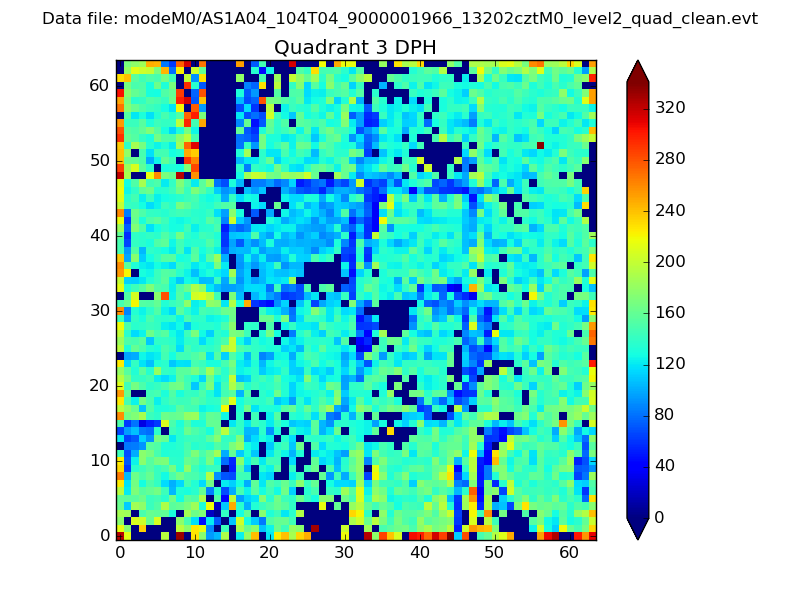 |
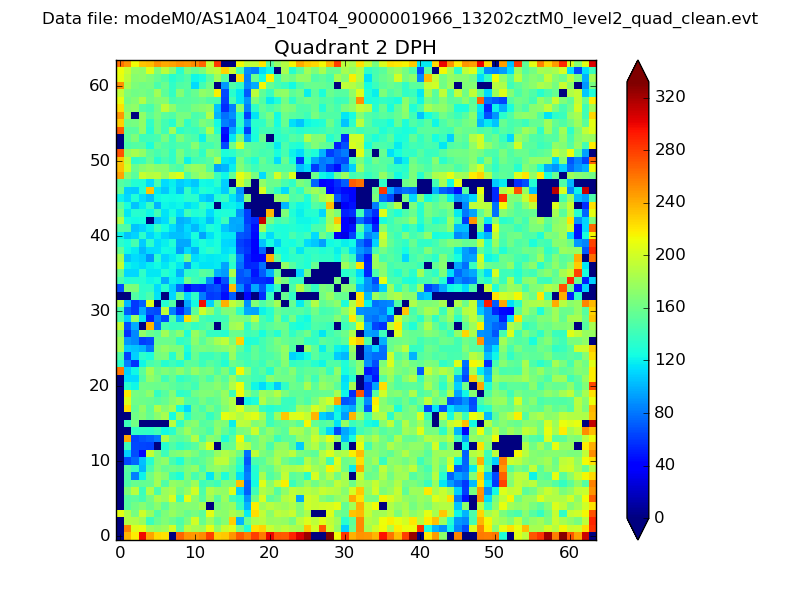 |
Quadrant C |
| Plot type | Count rate plots | Images |
|---|---|---|
| Comparison with Poisson distribution Blue bars denote a histogram of data divided into 1 sec bins. Red curve is a Poisson curve with rate = median count rate of data. |
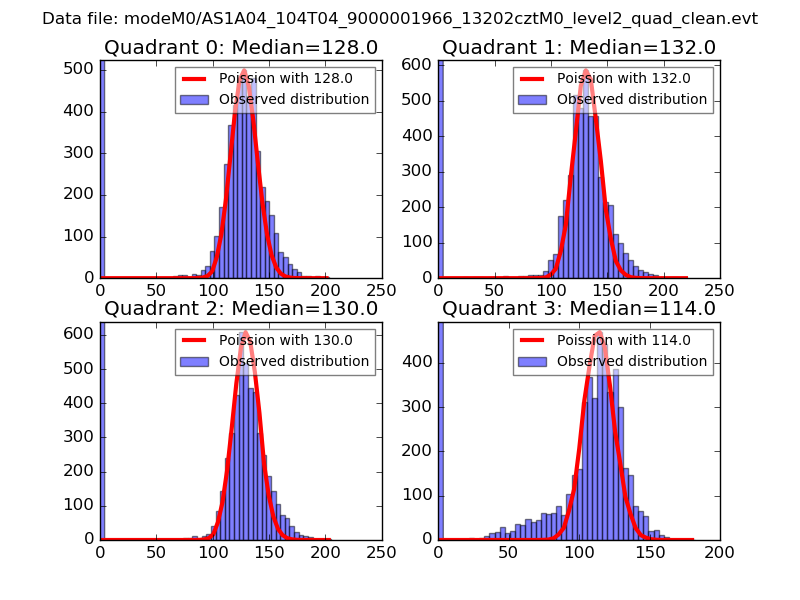 |
 |
| Quadrant-wise count rates Data is divided into 100 sec bins |
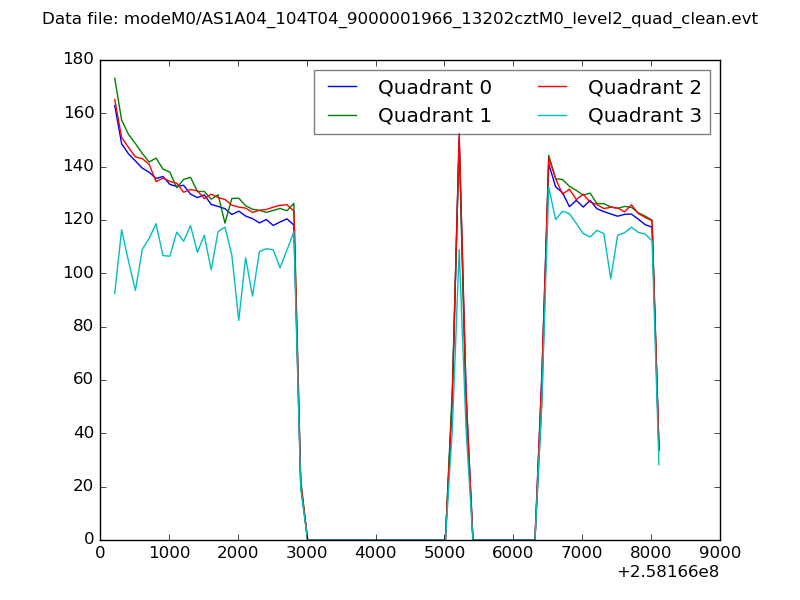 |
|
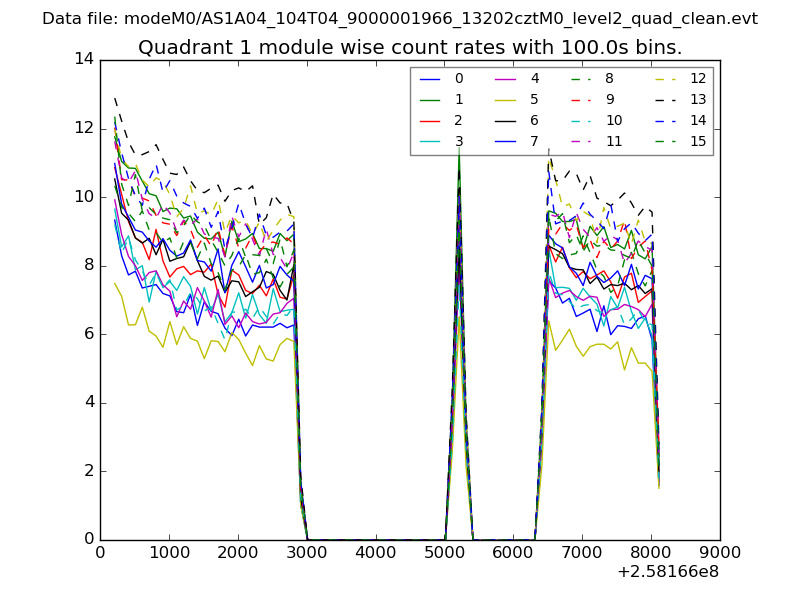
| Module-wise count rates for Quadrant A Data is divided into 100 sec bins |
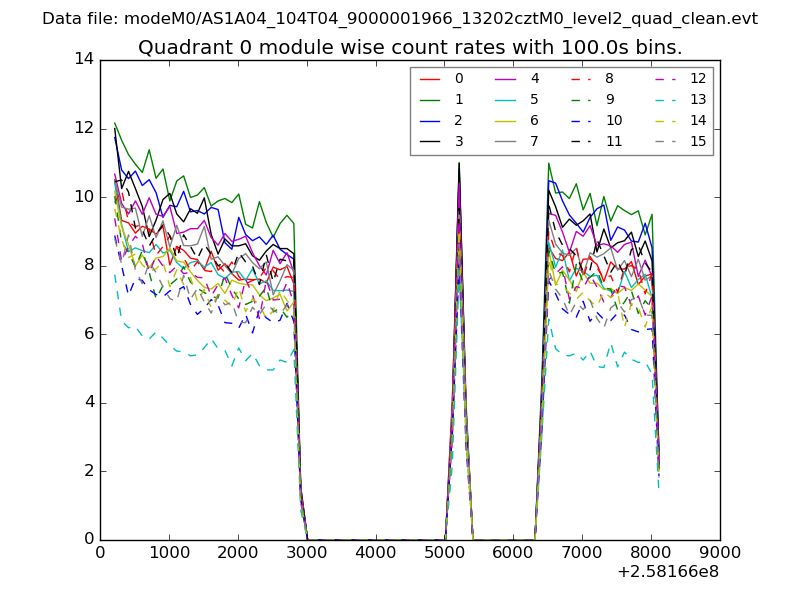 |
 |
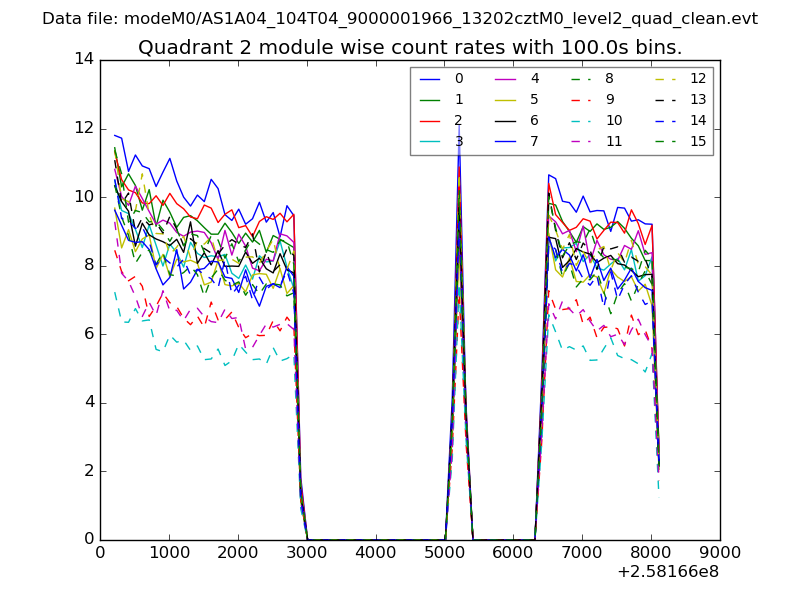
| Module-wise count rates for Quadrant B Data is divided into 100 sec bins |
 |
 |
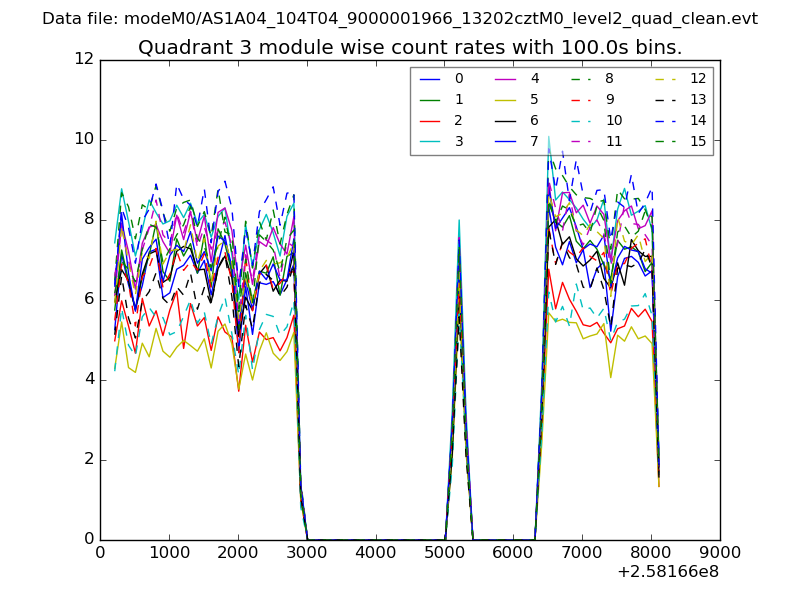
| Module-wise count rates for Quadrant C Data is divided into 100 sec bins |
 |
 |
| Module-wise count rates for Quadrant D Data is divided into 100 sec bins |
 |
 |
| Parameter | Plot |
|---|---|
| CZT HV Monitor | 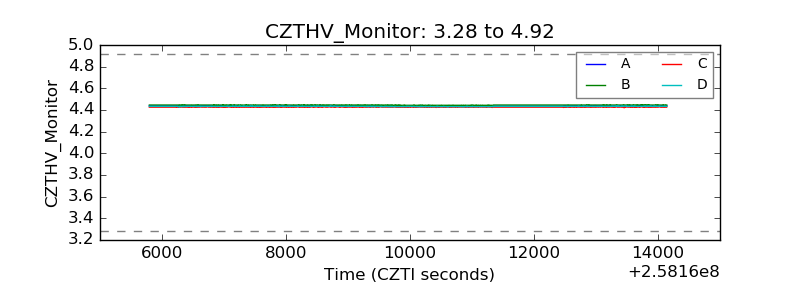 |
| D_VDD | 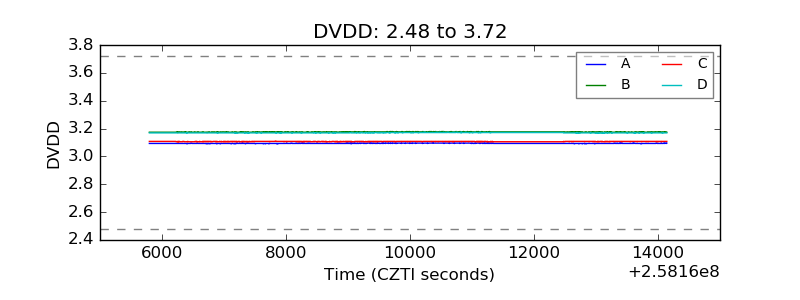 |
| Temperature 1 | 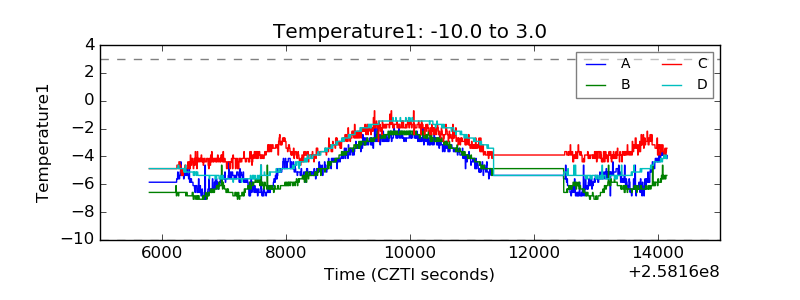 |
| Veto HV Monitor | 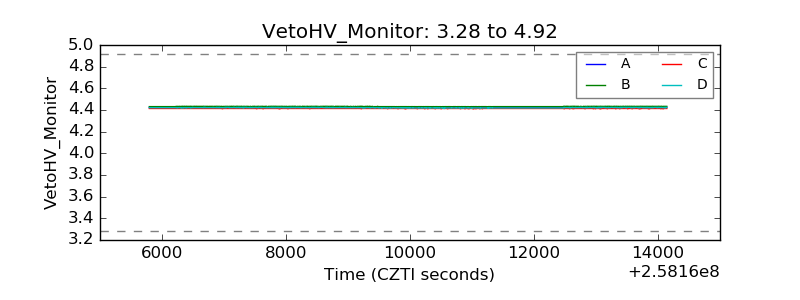 |
| Veto LLD | 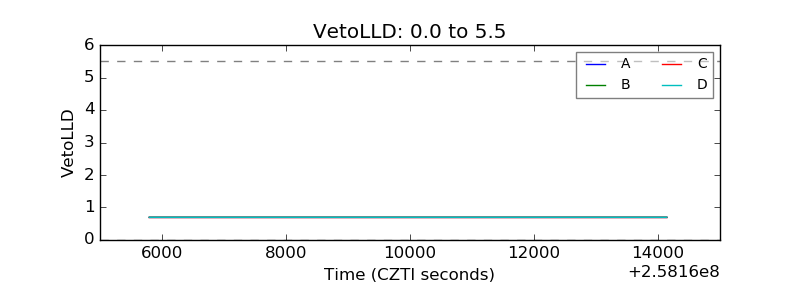 |
| Alpha Counter | 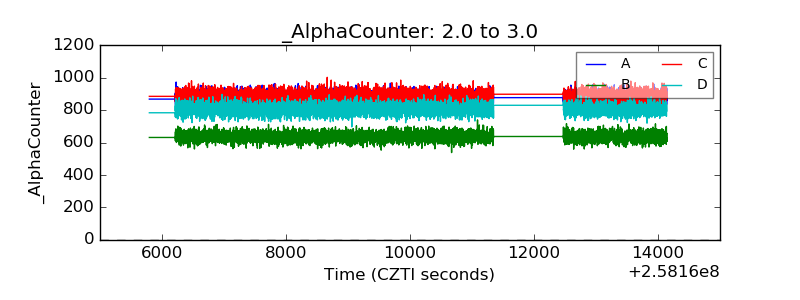 |
| _CPM_Rate | 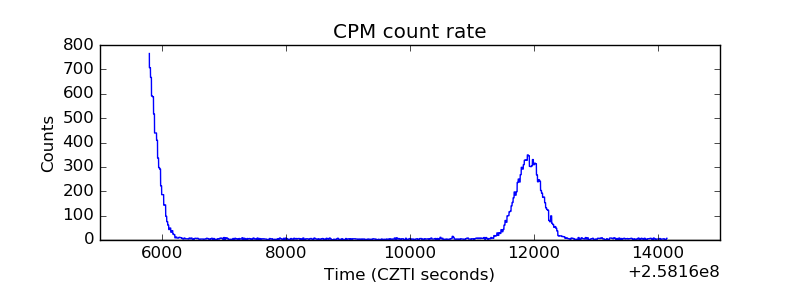 |
| CZT Counter |  |
| +2.5 Volts monitor |  |
| +5 Volts monitor |  |
| _ROLL_ROT | 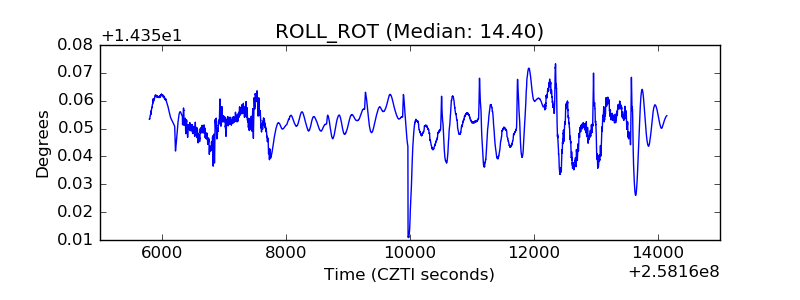 |
| _Roll_DEC | 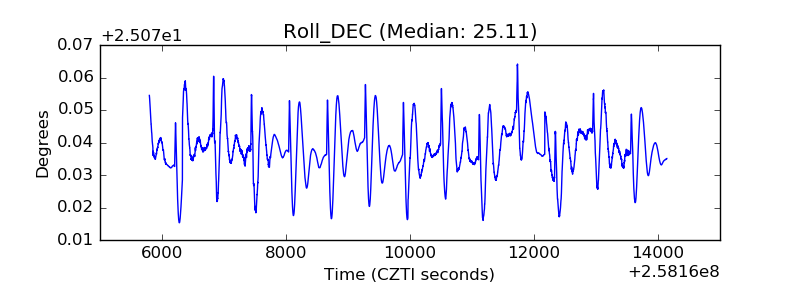 |
| _Roll_RA |  |
| Veto Counter | 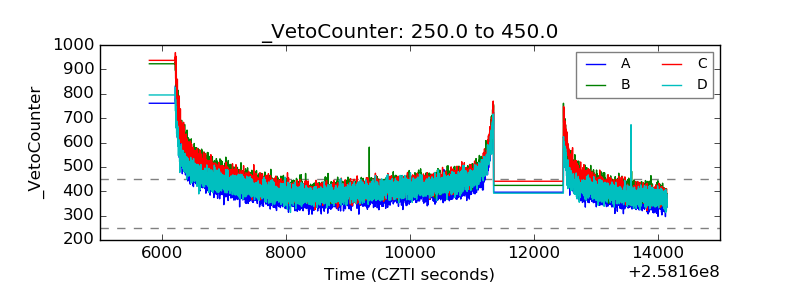 |