| Param | Original file | Final file |
|---|---|---|
| Filename | modeM0/AS1A04_104T04_9000001966_13203cztM0_level2.evt | modeM0/AS1A04_104T04_9000001966_13203cztM0_level2_quad_clean.evt |
| Size (bytes) | 627,168,960 | 93,807,360 |
| Size | 598.1 MB | 89.5 MB |
| Events in quadrant A | 3,305,933 | 598,469 |
| Events in quadrant B | 4,064,106 | 603,874 |
| Events in quadrant C | 3,182,216 | 612,046 |
| Events in quadrant D | 7,961,457 | 532,830 |
| Mode M9 | |||
|---|---|---|---|
| Quadrant | BADHDUFLAG | Total packets | Discarded packets |
| A | 0 | 8 | 0 |
| B | 0 | 8 | 0 |
| C | 0 | 8 | 0 |
| D | 0 | 9 | 0 |
| Mode M0 | |||
|---|---|---|---|
| Quadrant | BADHDUFLAG | Total packets | Discarded packets |
| A | 0 | 14584 | 7 |
| B | 0 | 16726 | 2 |
| C | 0 | 14444 | 12 |
| D | 0 | 28545 | 13 |
| Mode SS | |||
|---|---|---|---|
| Quadrant | BADHDUFLAG | Total packets | Discarded packets |
| A | 0 | 144 | 0 |
| B | 0 | 144 | 0 |
| C | 0 | 144 | 0 |
| D | 0 | 144 | 0 |
| Quadrant | Total seconds | Saturated seconds | Saturation percentage |
|---|---|---|---|
| A | 7081 | 53 | 0.748482% |
| B | 7083 | 326 | 4.602570% |
| C | 7079 | 19 | 0.268399% |
| D | 7080 | 1664 | 23.502825% |
Noise dominated data is calculated using 1-second bins in cleaned event files. If a bin has >2000 counts, and if more than 50% of those come from <1% of pixels, then it is considered to be noise-dominated and hence unusable.
| Quadrant | # 1 sec bins | Bins with >0 counts | Bins with >2000 counts | High rate bins dominated by noise | Noise dominated (total time) | Noise dominated (detector-on time) | Marked lightcurve |
|---|---|---|---|---|---|---|---|
| A | 7819 | 7085 | 1 | 1 | 0.01% | 0.01% | 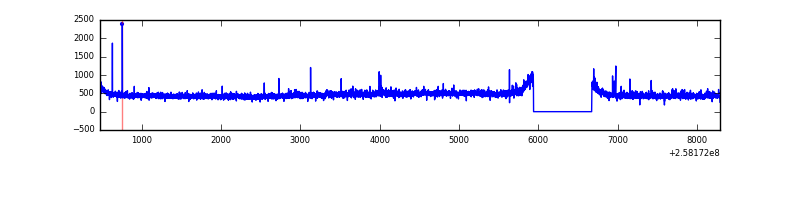 |
| B | 7819 | 7085 | 162 | 162 | 2.07% | 2.29% | 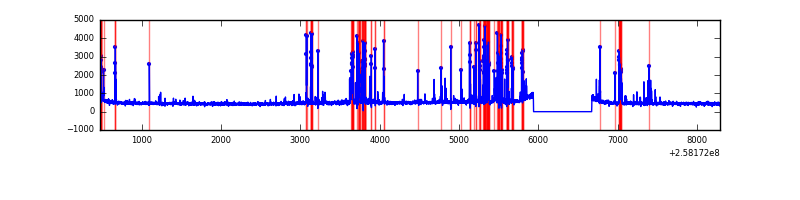 |
| C | 7819 | 7085 | 0 | 0 | 0.00% | 0.00% | 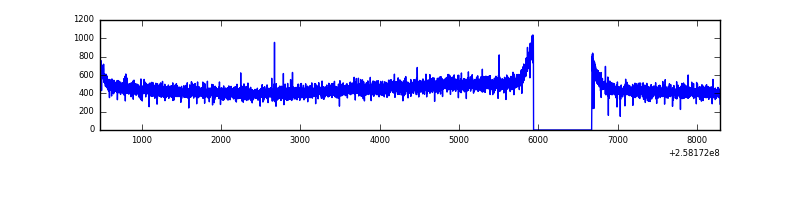 |
| D | 7819 | 7085 | 1203 | 1203 | 15.39% | 16.98% | 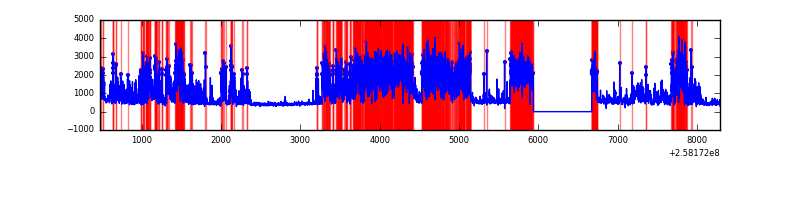 |
Top three noisy pixels from each quadrant. If the there are fewer than three noisy pixels in the level2.evt file, extra rows are filled as -1
| Pixel properties | Quadrant properties | ||||||
|---|---|---|---|---|---|---|---|
| Quadrant | DetID | PixID | Counts | Sigma | Mean | Median | Sigma |
| A | 12 | 189 | 26618 | 151.3 | 839 | 819 | 170.5 |
| A | 12 | 96 | 22036 | 124.43 | 839 | 819 | 170.5 |
| A | 1 | 162 | 17062 | 95.26 | 839 | 819 | 170.5 |
| B | 4 | 239 | 736270 | 4616.18 | 829 | 809 | 159.3 |
| B | 3 | 64 | 27420 | 167.03 | 829 | 809 | 159.3 |
| B | 0 | 214 | 27085 | 164.92 | 829 | 809 | 159.3 |
| C | 13 | 61 | 5872 | 26.76 | 815 | 823 | 188.7 |
| C | 8 | 222 | 3509 | 14.24 | 815 | 823 | 188.7 |
| C | 14 | 234 | 2322 | 7.94 | 815 | 823 | 188.7 |
| D | 13 | 122 | 4991949 | 28650.63 | 723 | 702 | 174.2 |
| D | 1 | 52 | 141584 | 808.69 | 723 | 702 | 174.2 |
| D | 8 | 195 | 51809 | 293.36 | 723 | 702 | 174.2 |
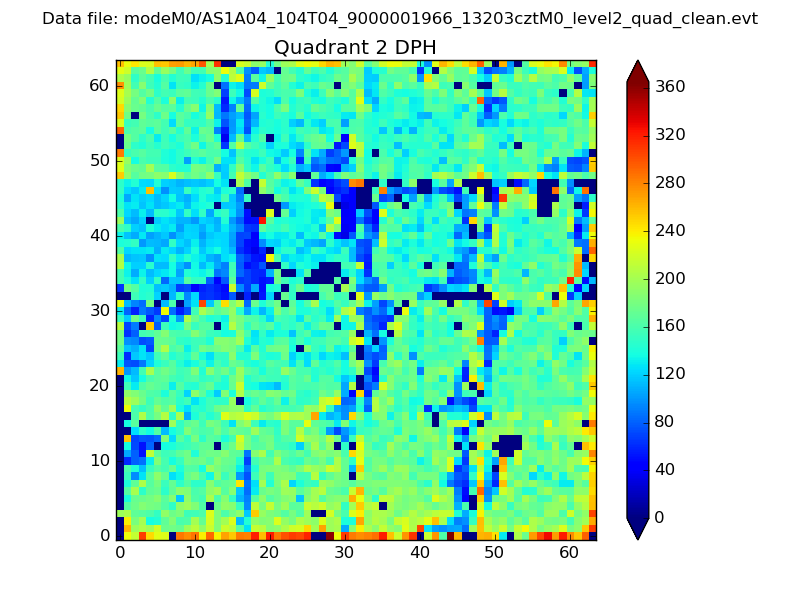
Histogram calculated using DETX and DETY for each event in the final _common_clean file
| Quadrant A | 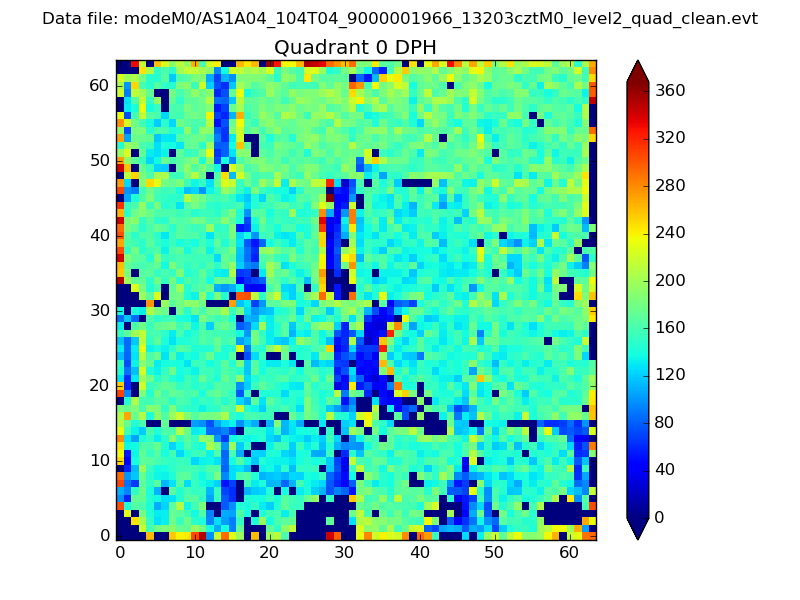 |
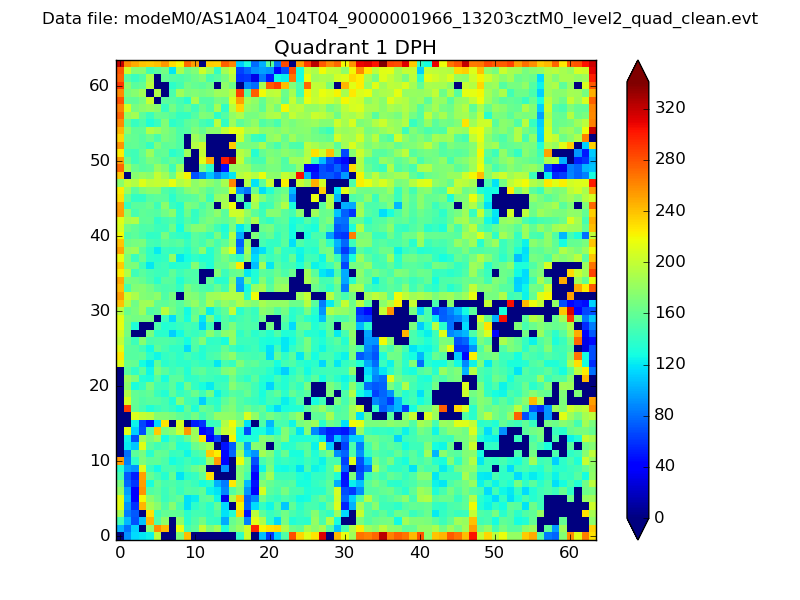 |
Quadrant B |
|---|---|---|---|
| Quadrant D | 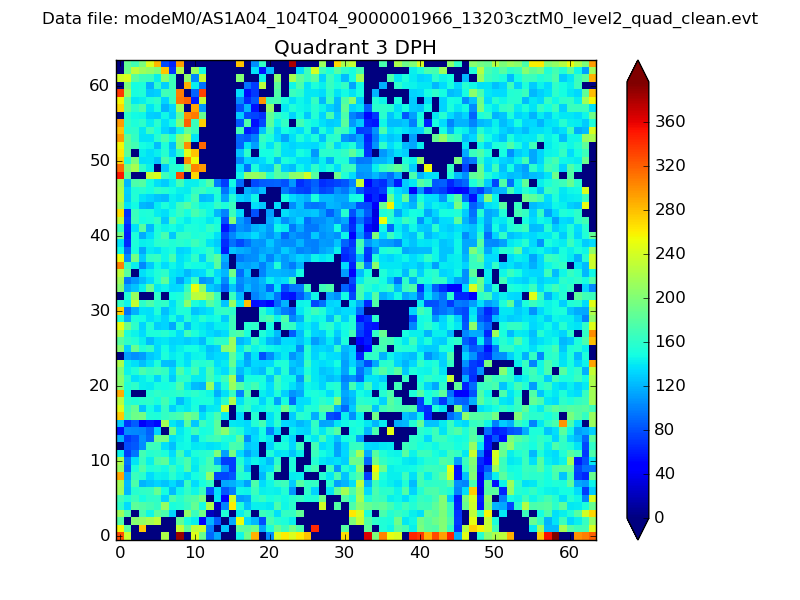 |
 |
Quadrant C |
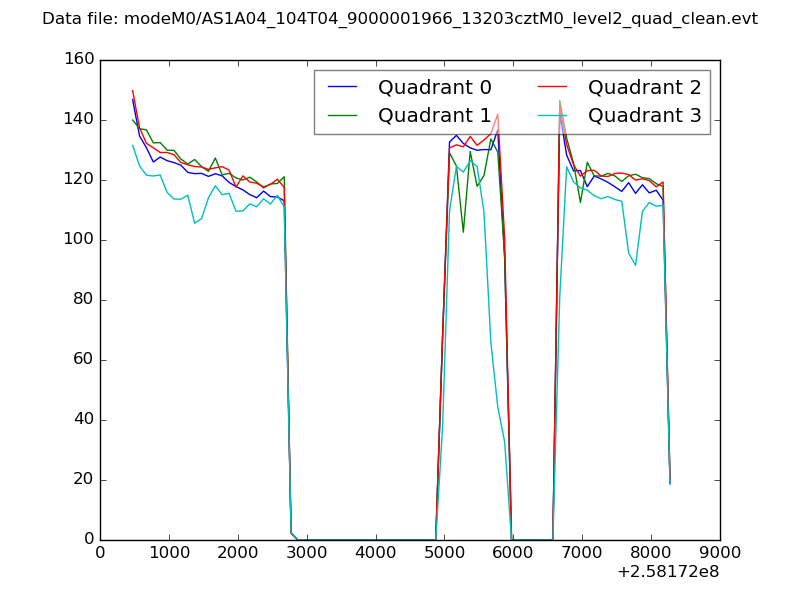
| Plot type | Count rate plots | Images |
|---|---|---|
| Comparison with Poisson distribution Blue bars denote a histogram of data divided into 1 sec bins. Red curve is a Poisson curve with rate = median count rate of data. |
 |
 |
| Quadrant-wise count rates Data is divided into 100 sec bins |
 |
|
| Module-wise count rates for Quadrant A Data is divided into 100 sec bins |
 |
 |
| Module-wise count rates for Quadrant B Data is divided into 100 sec bins |
 |
 |
| Module-wise count rates for Quadrant C Data is divided into 100 sec bins |
 |
 |
| Module-wise count rates for Quadrant D Data is divided into 100 sec bins |
 |
 |
| Parameter | Plot |
|---|---|
| CZT HV Monitor |  |
| D_VDD | 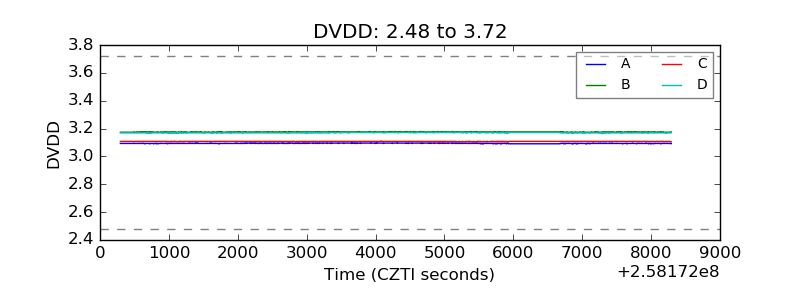 |
| Temperature 1 | 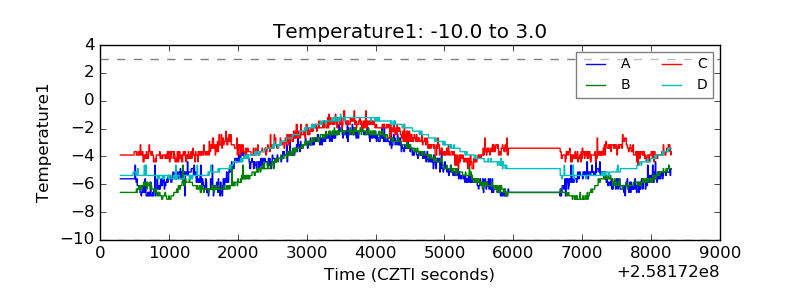 |
| Veto HV Monitor | 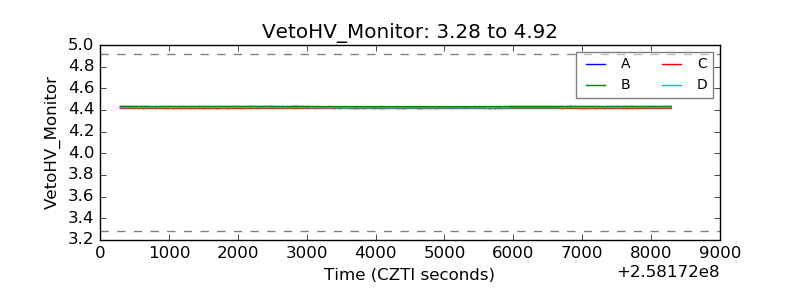 |
| Veto LLD | 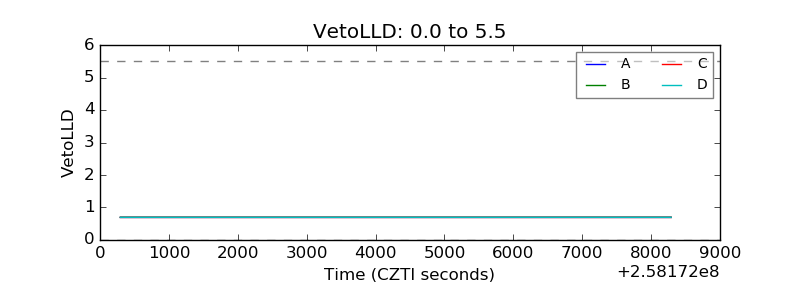 |
| Alpha Counter | 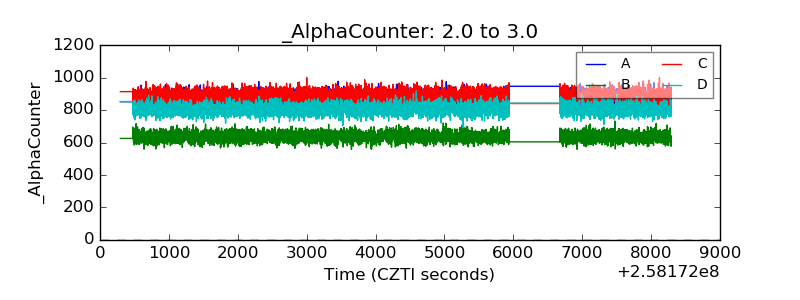 |
| _CPM_Rate | 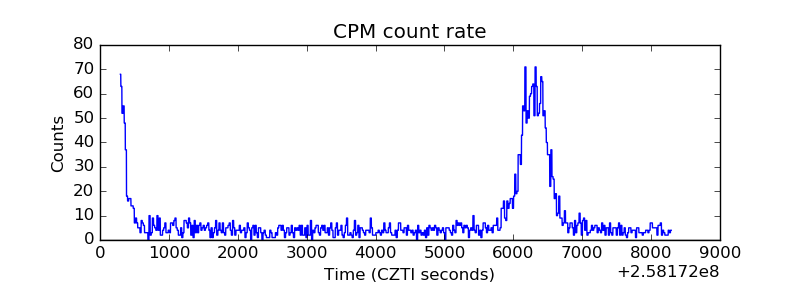 |
| CZT Counter | 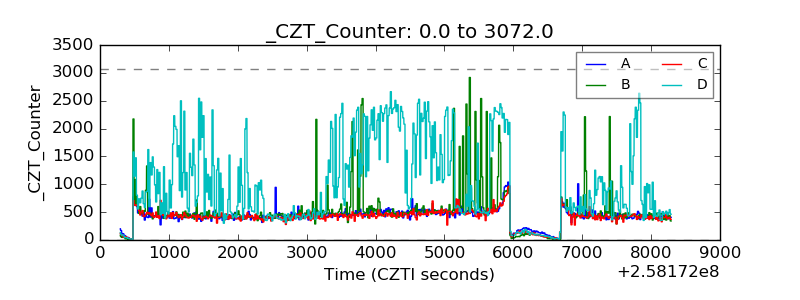 |
| +2.5 Volts monitor |  |
| +5 Volts monitor | 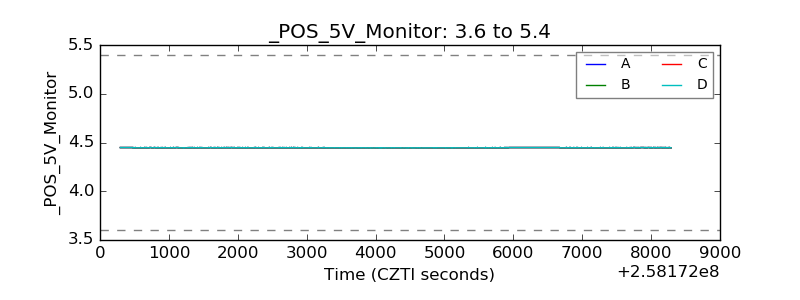 |
| _ROLL_ROT | 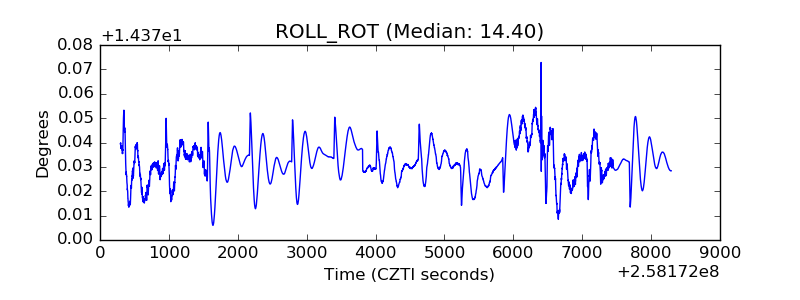 |
| _Roll_DEC | 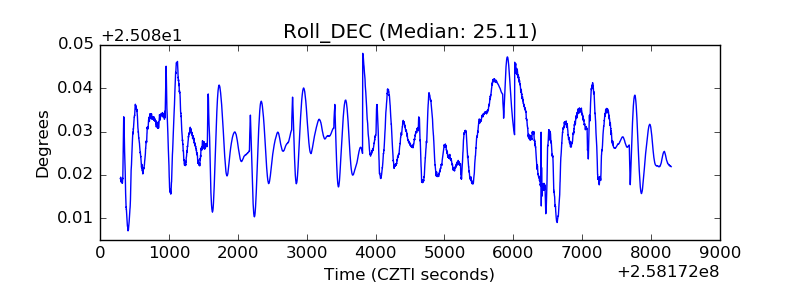 |
| _Roll_RA | 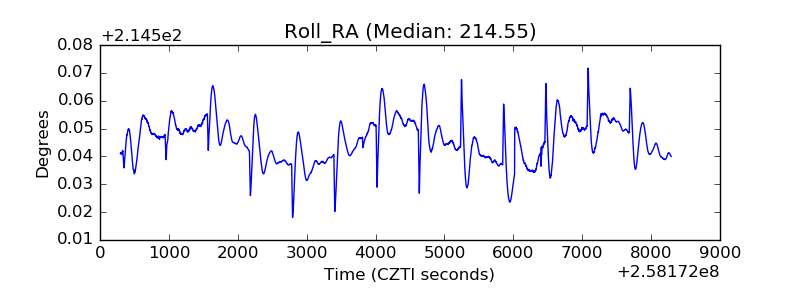 |
| Veto Counter |  |