| Param | Original file | Final file |
|---|---|---|
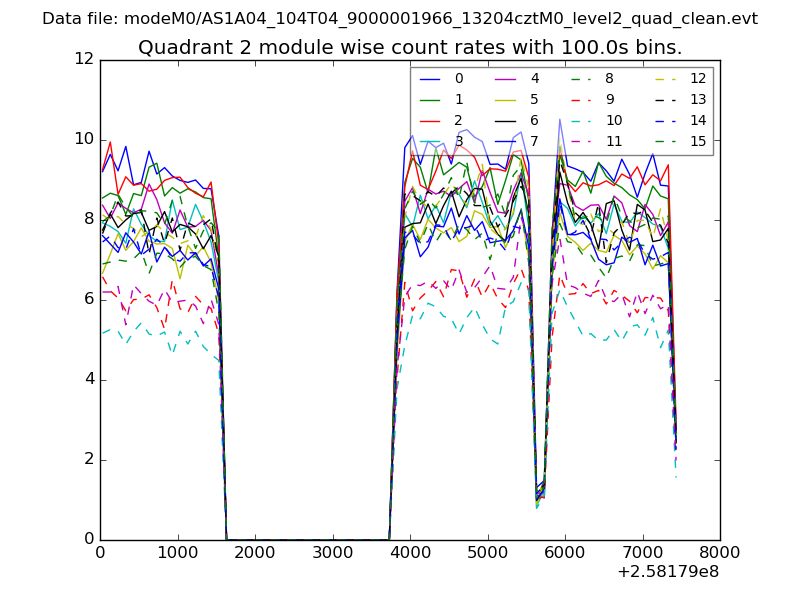
| Filename | modeM0/AS1A04_104T04_9000001966_13204cztM0_level2.evt | modeM0/AS1A04_104T04_9000001966_13204cztM0_level2_quad_clean.evt |
| Size (bytes) | 571,579,200 | 96,013,440 |
| Size | 545.1 MB | 91.6 MB |
| Events in quadrant A | 3,489,401 | 598,684 |
| Events in quadrant B | 4,401,508 | 601,832 |
| Events in quadrant C | 3,309,196 | 619,588 |
| Events in quadrant D | 5,612,065 | 576,039 |
| Mode M9 | |||
|---|---|---|---|
| Quadrant | BADHDUFLAG | Total packets | Discarded packets |
| A | 0 | 2 | 0 |
| B | 0 | 2 | 0 |
| C | 0 | 2 | 0 |
| D | 0 | 2 | 0 |
| Mode M0 | |||
|---|---|---|---|
| Quadrant | BADHDUFLAG | Total packets | Discarded packets |
| A | 0 | 15325 | 2 |
| B | 0 | 17969 | 1 |
| C | 0 | 15050 | 1 |
| D | 0 | 21756 | 1 |
| Mode SS | |||
|---|---|---|---|
| Quadrant | BADHDUFLAG | Total packets | Discarded packets |
| A | 0 | 150 | 0 |
| B | 0 | 150 | 0 |
| C | 0 | 150 | 0 |
| D | 0 | 150 | 0 |
| Quadrant | Total seconds | Saturated seconds | Saturation percentage |
|---|---|---|---|
| A | 7347 | 198 | 2.694978% |
| B | 7347 | 510 | 6.941609% |
| C | 7347 | 106 | 1.442766% |
| D | 7347 | 395 | 5.376344% |
Noise dominated data is calculated using 1-second bins in cleaned event files. If a bin has >2000 counts, and if more than 50% of those come from <1% of pixels, then it is considered to be noise-dominated and hence unusable.
| Quadrant | # 1 sec bins | Bins with >0 counts | Bins with >2000 counts | High rate bins dominated by noise | Noise dominated (total time) | Noise dominated (detector-on time) | Marked lightcurve |
|---|---|---|---|---|---|---|---|
| A | 7558 | 7350 | 12 | 12 | 0.16% | 0.16% | 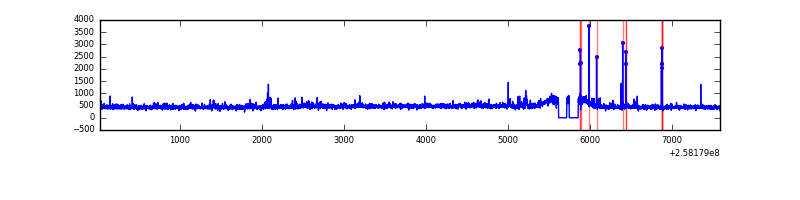 |
| B | 7558 | 7350 | 218 | 218 | 2.88% | 2.97% | 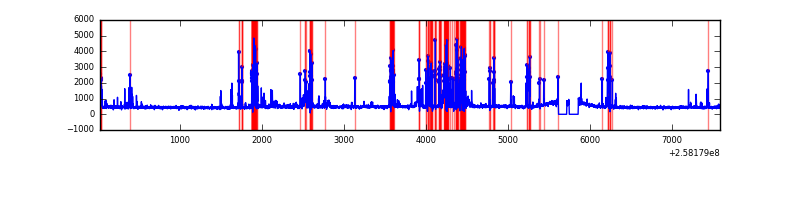 |
| C | 7558 | 7350 | 0 | 0 | 0.00% | 0.00% | 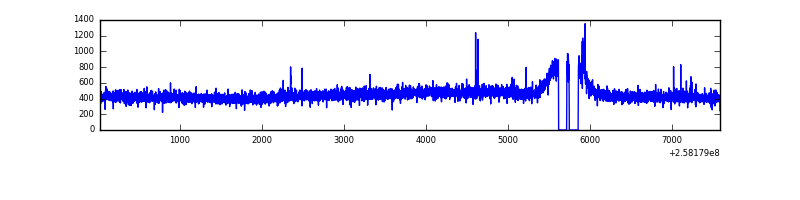 |
| D | 7558 | 7350 | 188 | 188 | 2.49% | 2.56% | 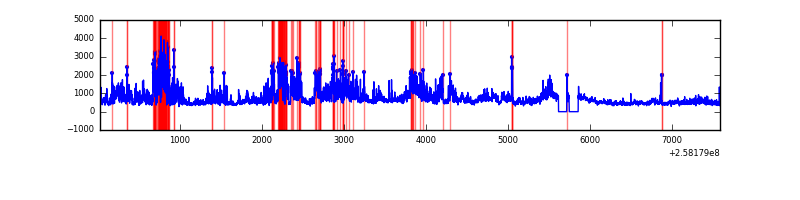 |
Top three noisy pixels from each quadrant. If the there are fewer than three noisy pixels in the level2.evt file, extra rows are filled as -1
| Pixel properties | Quadrant properties | ||||||
|---|---|---|---|---|---|---|---|
| Quadrant | DetID | PixID | Counts | Sigma | Mean | Median | Sigma |
| A | 12 | 96 | 72917 | 406.35 | 865 | 843 | 177.4 |
| A | 12 | 189 | 48275 | 267.42 | 865 | 843 | 177.4 |
| A | 1 | 162 | 19901 | 107.45 | 865 | 843 | 177.4 |
| B | 4 | 239 | 989203 | 6004.33 | 848 | 824 | 164.6 |
| B | 0 | 214 | 32239 | 190.84 | 848 | 824 | 164.6 |
| B | 3 | 64 | 29891 | 176.58 | 848 | 824 | 164.6 |
| C | 14 | 234 | 11469 | 54.41 | 844 | 848 | 195.2 |
| C | 15 | 208 | 8441 | 38.9 | 844 | 848 | 195.2 |
| C | 13 | 61 | 6151 | 27.16 | 844 | 848 | 195.2 |
| D | 13 | 122 | 1752460 | 8689.81 | 831 | 804 | 201.6 |
| D | 8 | 195 | 314792 | 1557.67 | 831 | 804 | 201.6 |
| D | 1 | 52 | 276032 | 1365.38 | 831 | 804 | 201.6 |
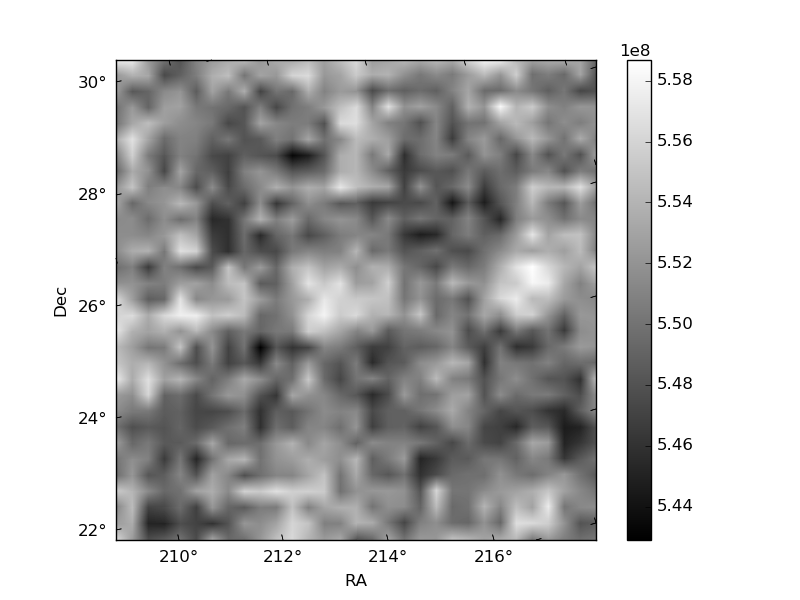
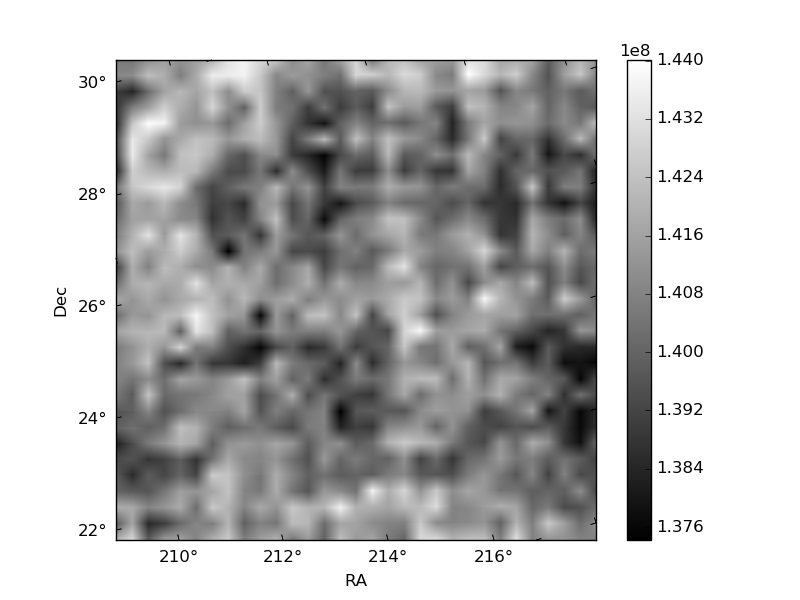
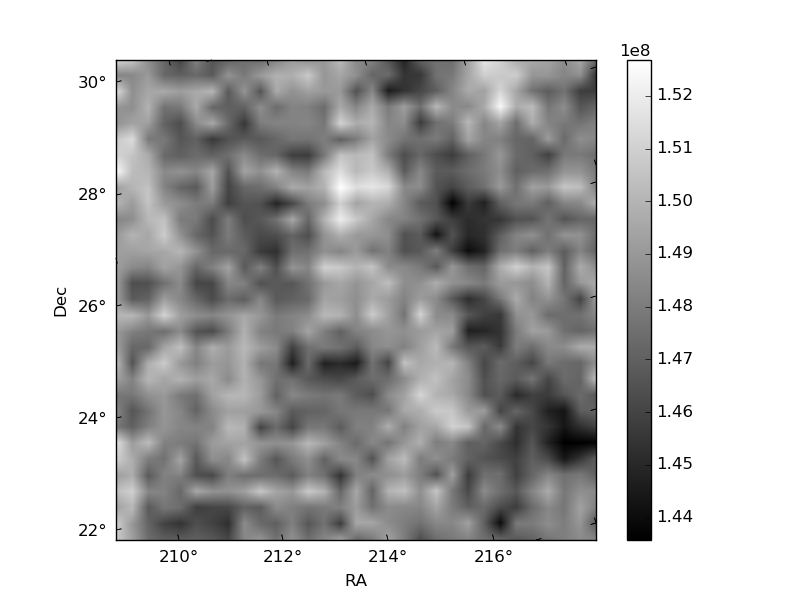
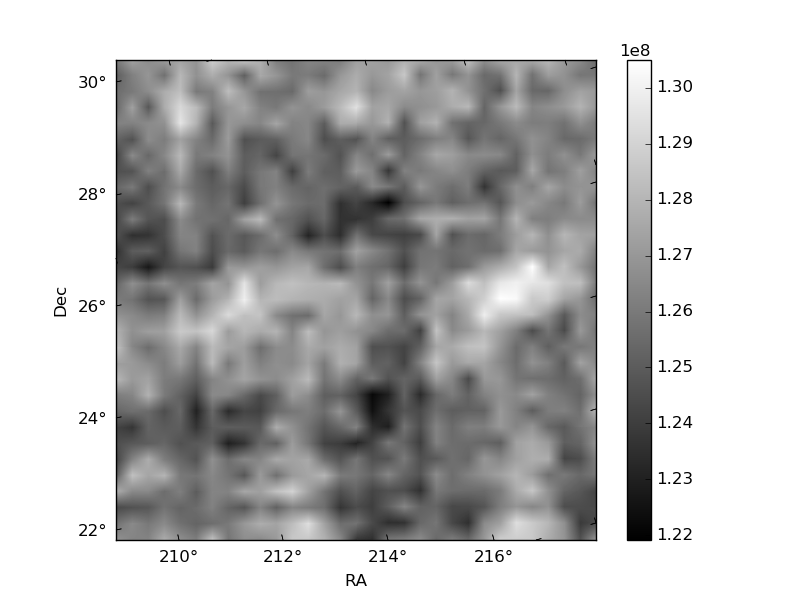
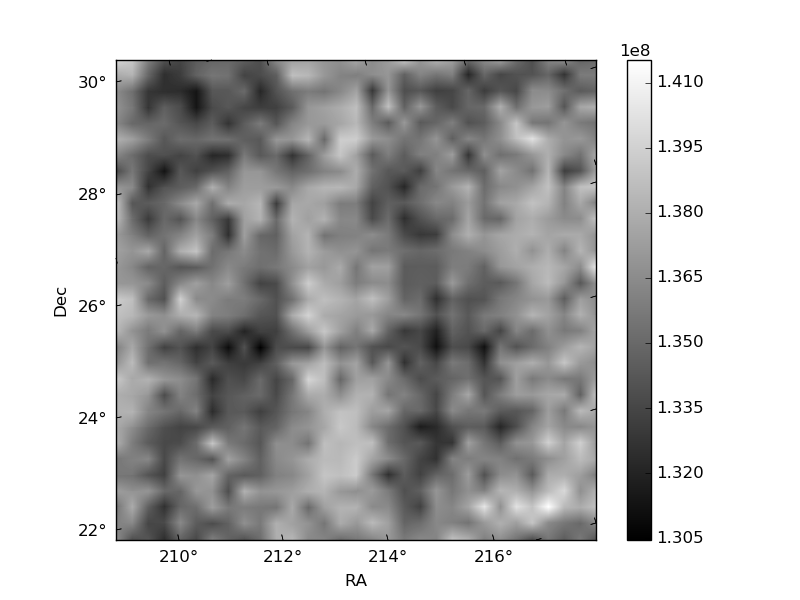
Histogram calculated using DETX and DETY for each event in the final _common_clean file
| Quadrant A | 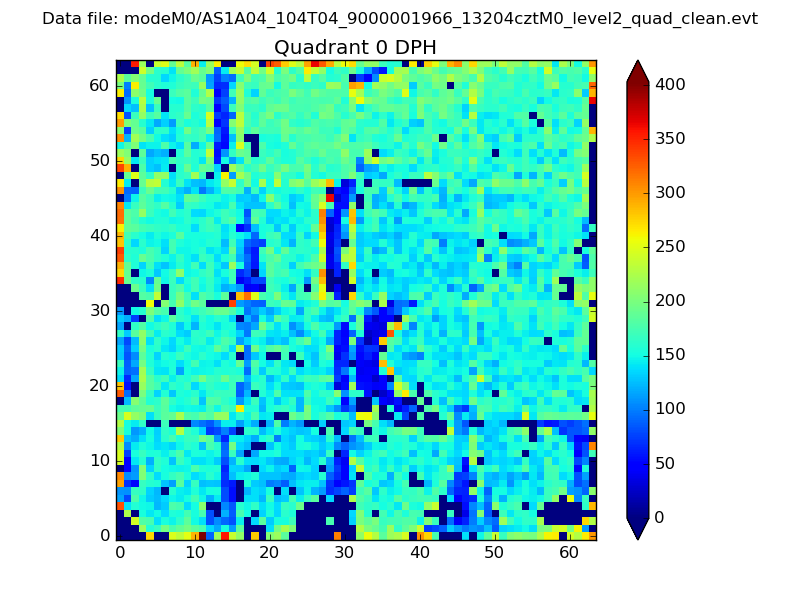 |
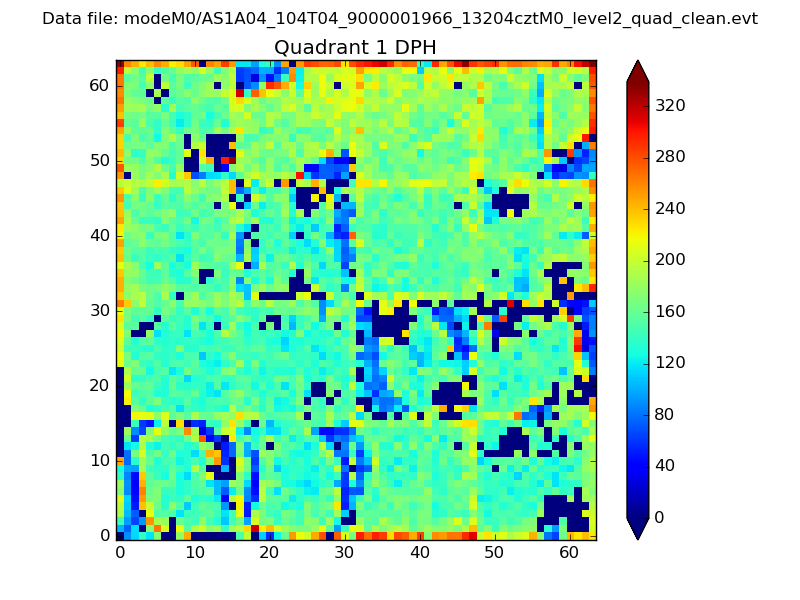 |
Quadrant B |
|---|---|---|---|
| Quadrant D | 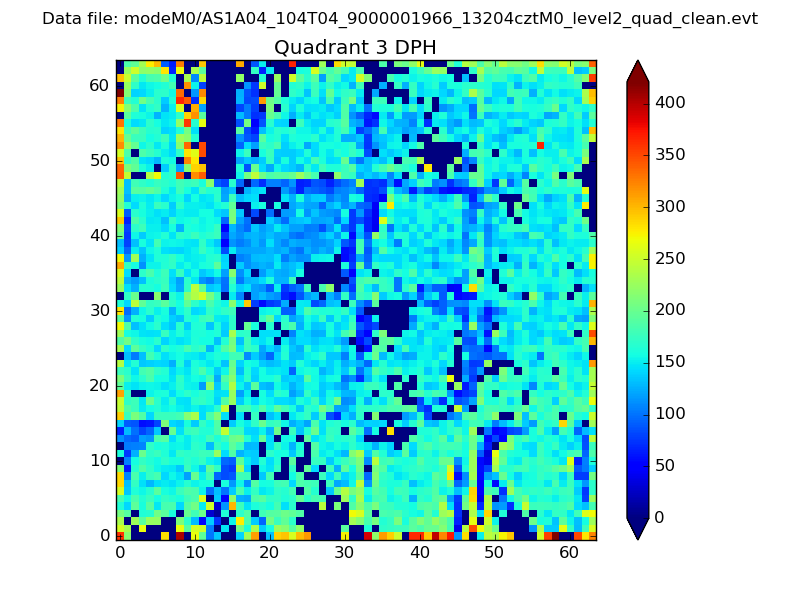 |
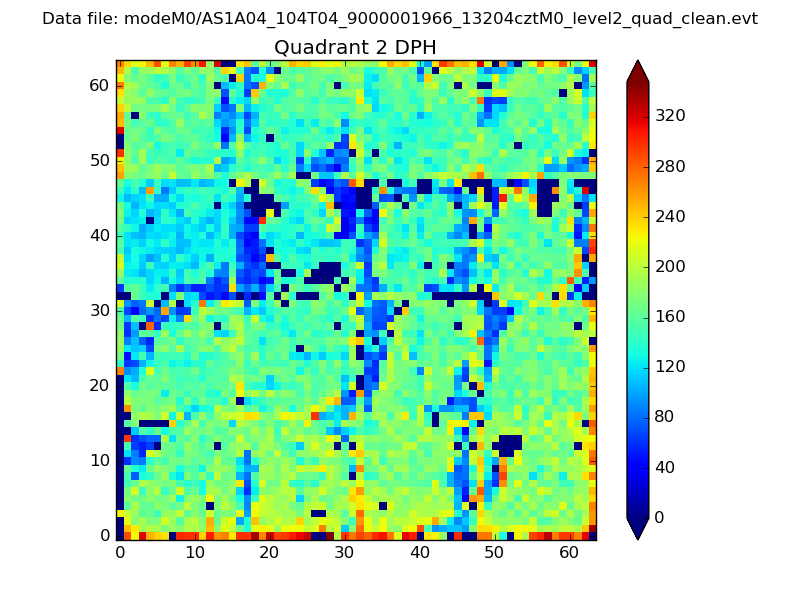 |
Quadrant C |
| Plot type | Count rate plots | Images |
|---|---|---|
| Comparison with Poisson distribution Blue bars denote a histogram of data divided into 1 sec bins. Red curve is a Poisson curve with rate = median count rate of data. |
 |
 |
| Quadrant-wise count rates Data is divided into 100 sec bins |
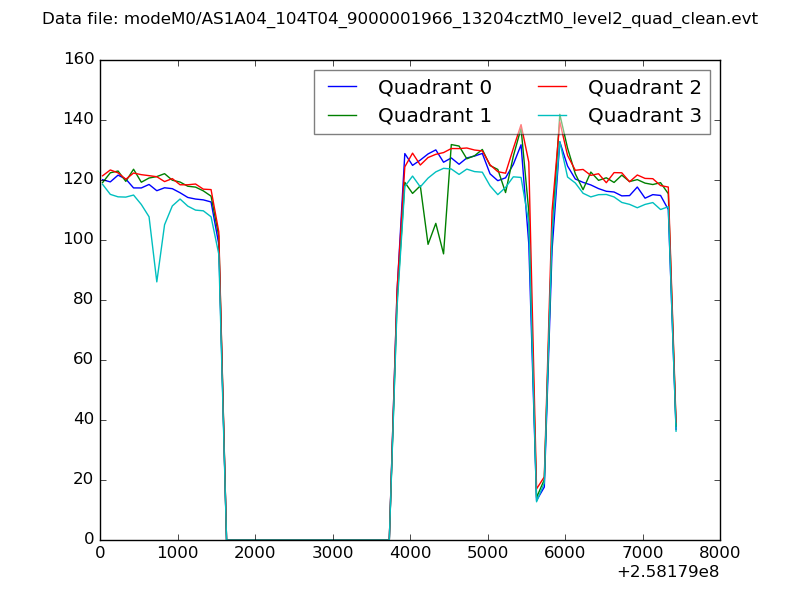 |
|
| Module-wise count rates for Quadrant A Data is divided into 100 sec bins |
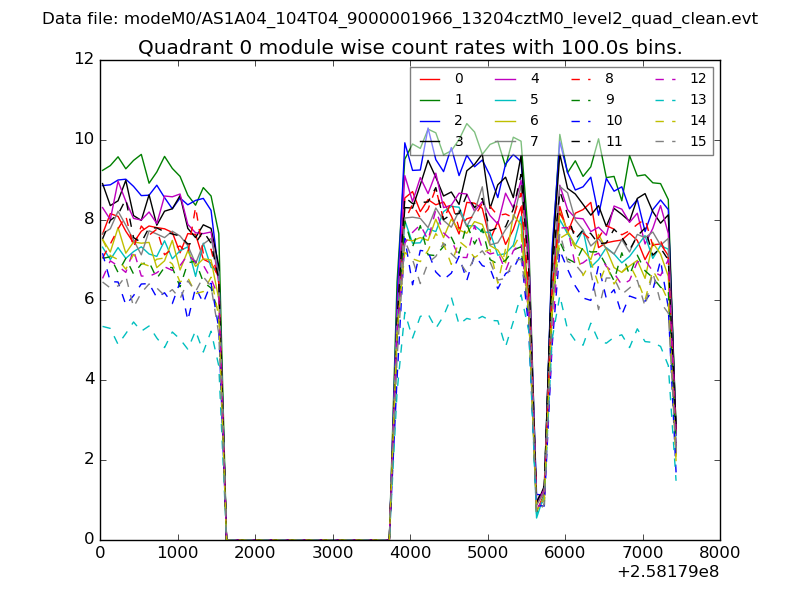 |
 |
| Module-wise count rates for Quadrant B Data is divided into 100 sec bins |
 |
 |
| Module-wise count rates for Quadrant C Data is divided into 100 sec bins |
 |
 |
| Module-wise count rates for Quadrant D Data is divided into 100 sec bins |
 |
 |
| Parameter | Plot |
|---|---|
| CZT HV Monitor | 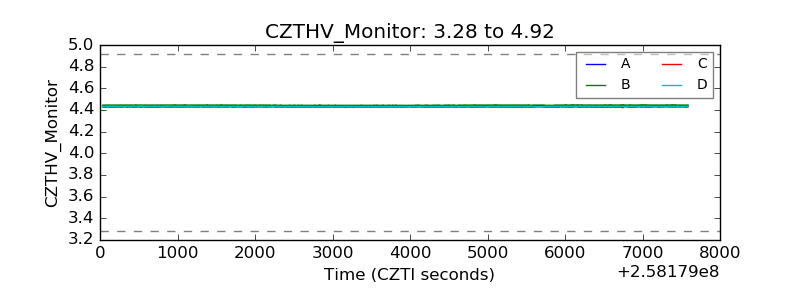 |
| D_VDD |  |
| Temperature 1 | 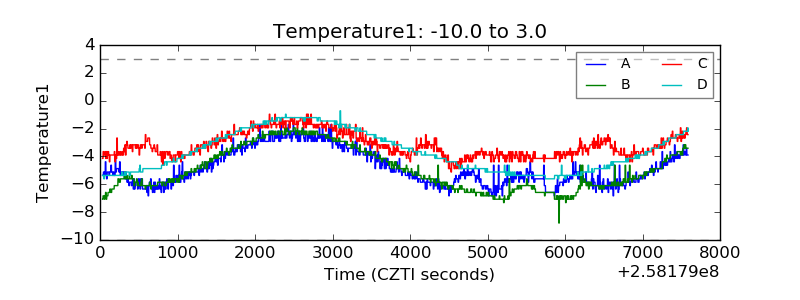 |
| Veto HV Monitor | 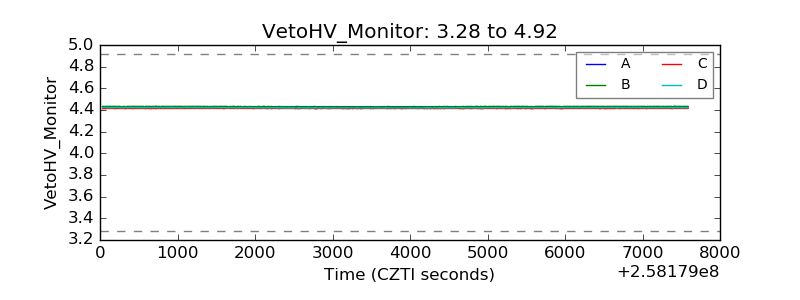 |
| Veto LLD | 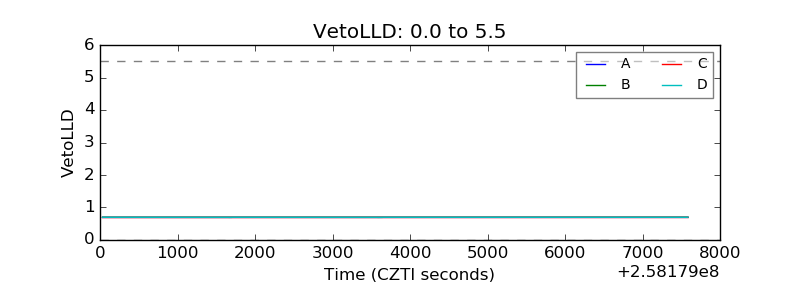 |
| Alpha Counter | 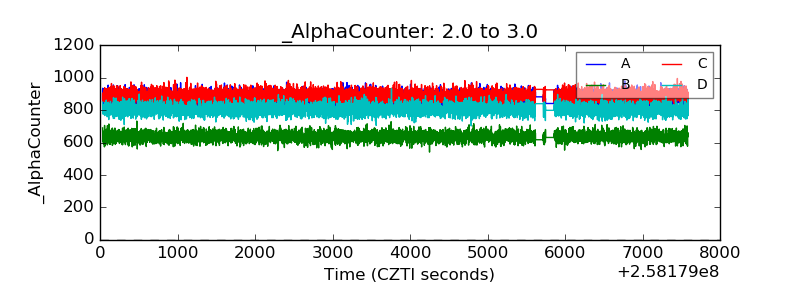 |
| _CPM_Rate | 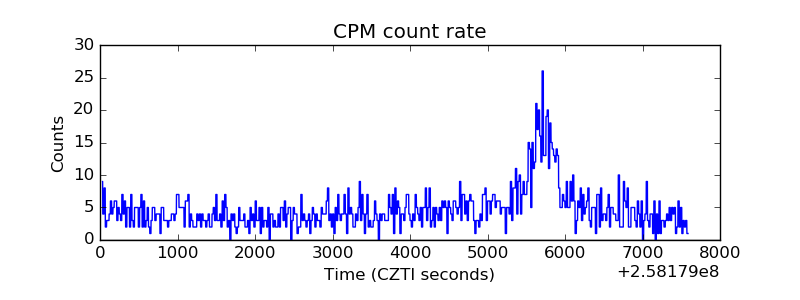 |
| CZT Counter | 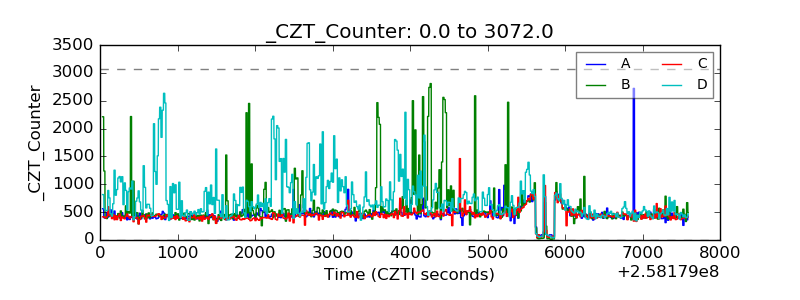 |
| +2.5 Volts monitor |  |
| +5 Volts monitor |  |
| _ROLL_ROT |  |
| _Roll_DEC |  |
| _Roll_RA | 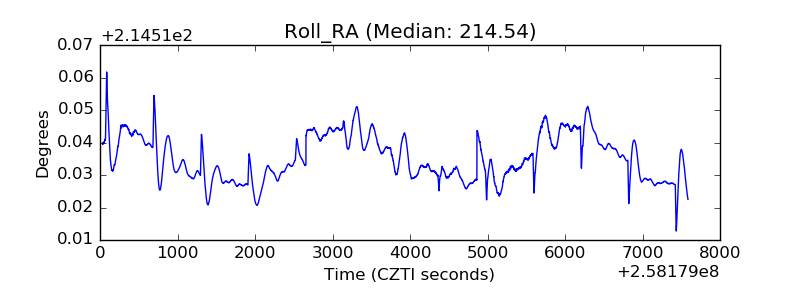 |
| Veto Counter | 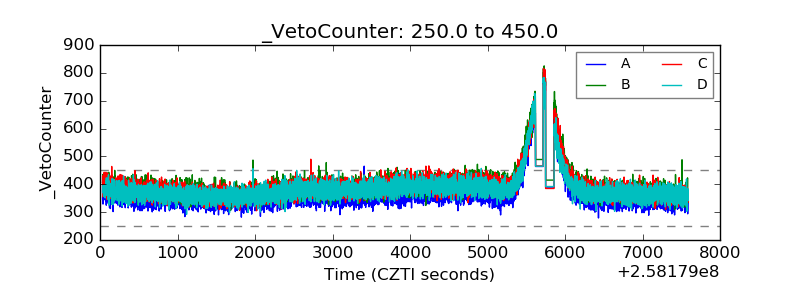 |