| Param | Original file | Final file |
|---|---|---|
| Filename | modeM0/AS1A04_104T04_9000001966_13205cztM0_level2.evt | modeM0/AS1A04_104T04_9000001966_13205cztM0_level2_quad_clean.evt |
| Size (bytes) | 527,155,200 | 87,088,320 |
| Size | 502.7 MB | 83.1 MB |
| Events in quadrant A | 3,569,375 | 529,193 |
| Events in quadrant B | 4,591,118 | 539,517 |
| Events in quadrant C | 3,255,672 | 549,963 |
| Events in quadrant D | 4,061,536 | 518,852 |
| Mode M9 | |||
|---|---|---|---|
| Quadrant | BADHDUFLAG | Total packets | Discarded packets |
| A | 0 | 1 | 0 |
| B | 0 | 1 | 0 |
| C | 0 | 1 | 0 |
| D | 0 | 1 | 0 |
| Mode M0 | |||
|---|---|---|---|
| Quadrant | BADHDUFLAG | Total packets | Discarded packets |
| A | 0 | 15446 | 2 |
| B | 0 | 18272 | 1 |
| C | 0 | 14724 | 1 |
| D | 0 | 16536 | 1 |
| Mode SS | |||
|---|---|---|---|
| Quadrant | BADHDUFLAG | Total packets | Discarded packets |
| A | 0 | 146 | 0 |
| B | 0 | 146 | 0 |
| C | 0 | 146 | 0 |
| D | 0 | 146 | 0 |
| Quadrant | Total seconds | Saturated seconds | Saturation percentage |
|---|---|---|---|
| A | 7170 | 266 | 3.709902% |
| B | 7170 | 588 | 8.200837% |
| C | 7170 | 135 | 1.882845% |
| D | 7170 | 169 | 2.357043% |
Noise dominated data is calculated using 1-second bins in cleaned event files. If a bin has >2000 counts, and if more than 50% of those come from <1% of pixels, then it is considered to be noise-dominated and hence unusable.
| Quadrant | # 1 sec bins | Bins with >0 counts | Bins with >2000 counts | High rate bins dominated by noise | Noise dominated (total time) | Noise dominated (detector-on time) | Marked lightcurve |
|---|---|---|---|---|---|---|---|
| A | 7261 | 7172 | 50 | 50 | 0.69% | 0.70% | 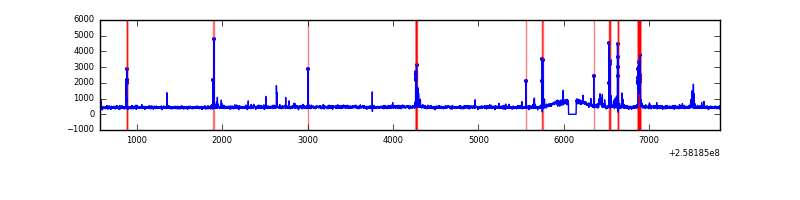 |
| B | 7261 | 7172 | 253 | 253 | 3.48% | 3.53% | 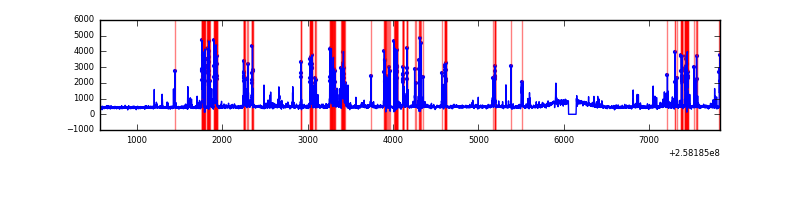 |
| C | 7261 | 7172 | 0 | 0 | 0.00% | 0.00% | 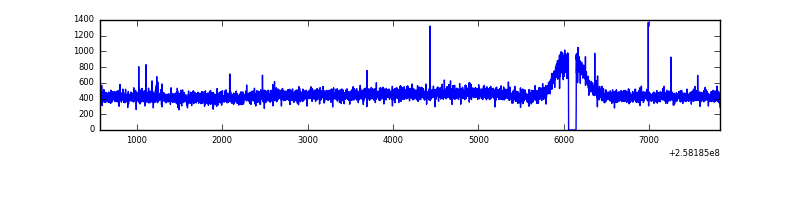 |
| D | 7261 | 7172 | 12 | 12 | 0.17% | 0.17% | 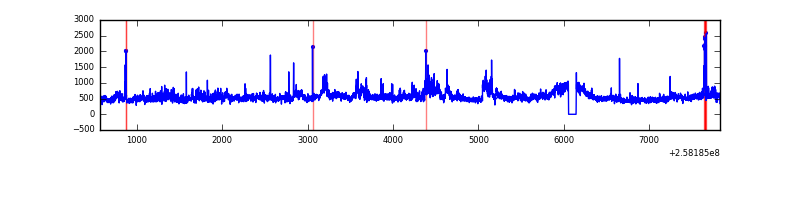 |
Top three noisy pixels from each quadrant. If the there are fewer than three noisy pixels in the level2.evt file, extra rows are filled as -1
| Pixel properties | Quadrant properties | ||||||
|---|---|---|---|---|---|---|---|
| Quadrant | DetID | PixID | Counts | Sigma | Mean | Median | Sigma |
| A | 12 | 96 | 208968 | 1183.0 | 848 | 827 | 175.9 |
| A | 4 | 2 | 43655 | 243.42 | 848 | 827 | 175.9 |
| A | 8 | 15 | 21363 | 116.72 | 848 | 827 | 175.9 |
| B | 4 | 239 | 1058041 | 6527.71 | 832 | 811 | 162.0 |
| B | 3 | 64 | 107249 | 657.19 | 832 | 811 | 162.0 |
| B | 0 | 214 | 41900 | 253.7 | 832 | 811 | 162.0 |
| C | 15 | 208 | 7094 | 32.52 | 832 | 834 | 192.5 |
| C | 13 | 61 | 6030 | 26.99 | 832 | 834 | 192.5 |
| C | 14 | 234 | 4785 | 20.52 | 832 | 834 | 192.5 |
| D | 8 | 195 | 571496 | 2839.3 | 828 | 803 | 201.0 |
| D | 1 | 52 | 222660 | 1103.78 | 828 | 803 | 201.0 |
| D | 10 | 157 | 61576 | 302.36 | 828 | 803 | 201.0 |
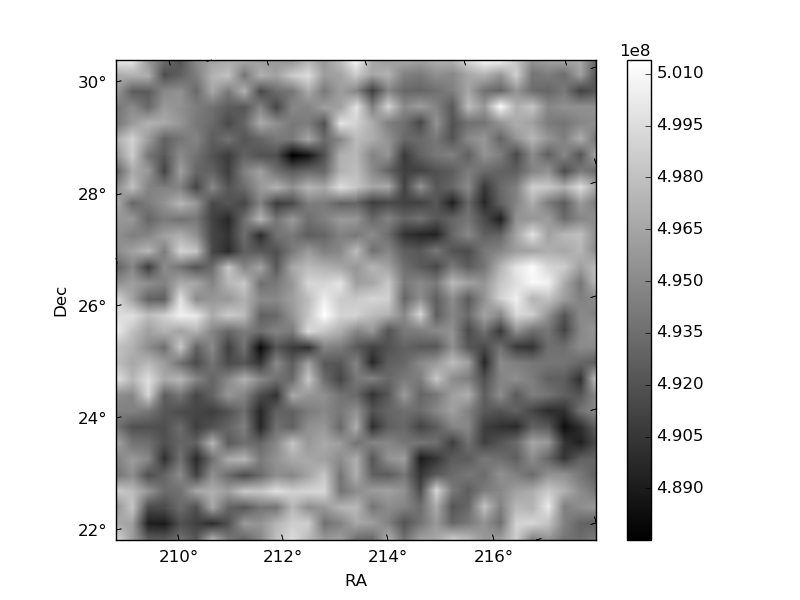
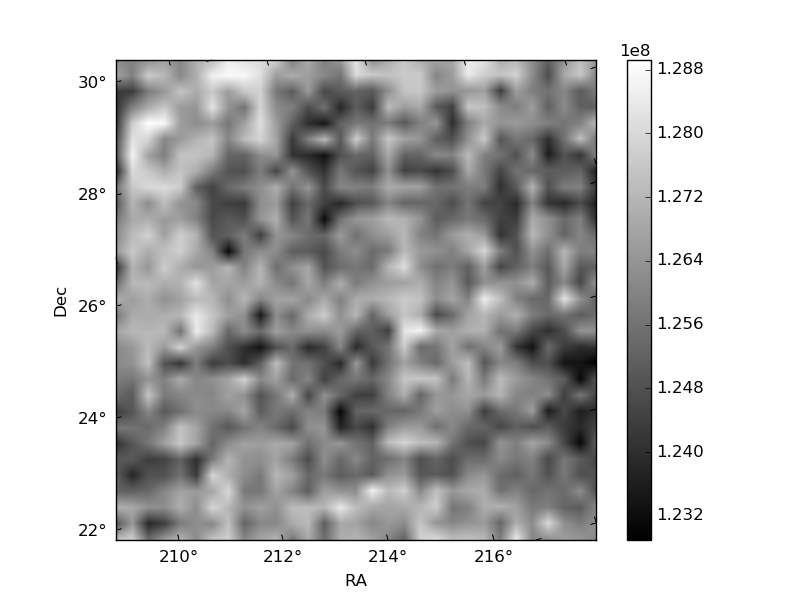
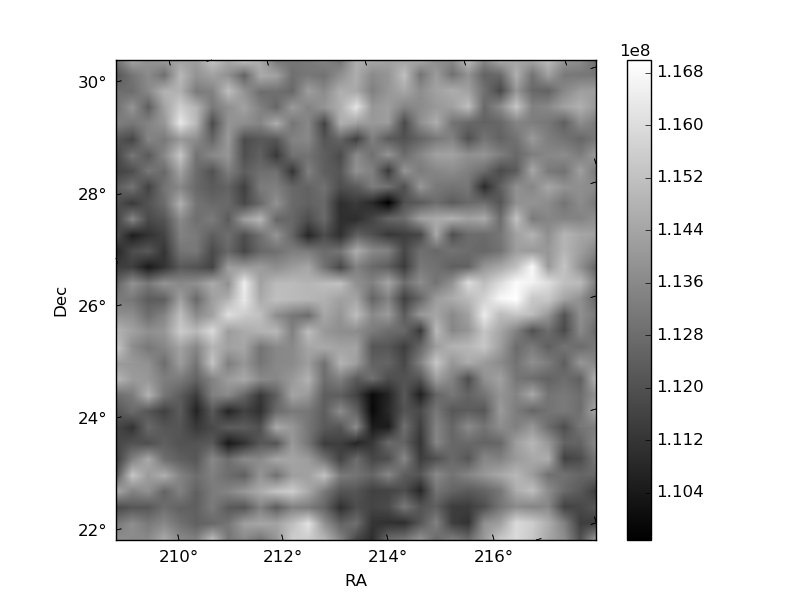
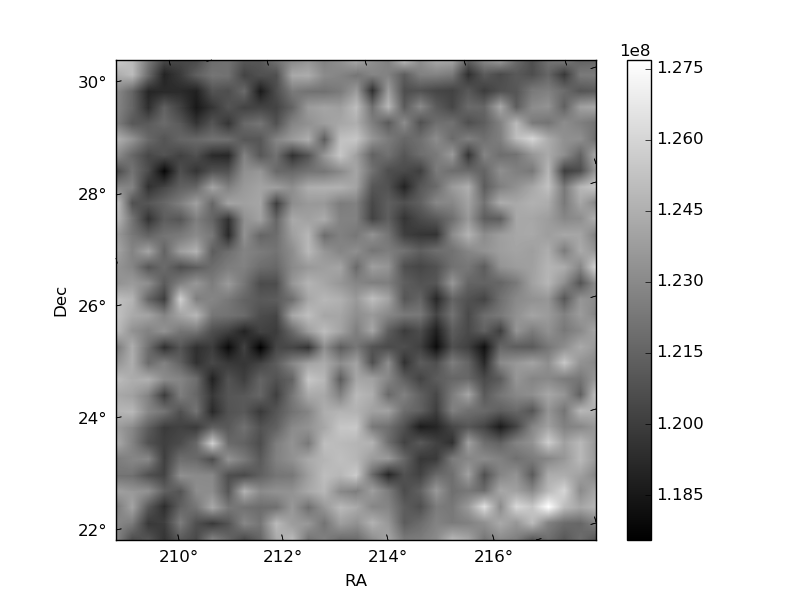
Histogram calculated using DETX and DETY for each event in the final _common_clean file
| Quadrant A | 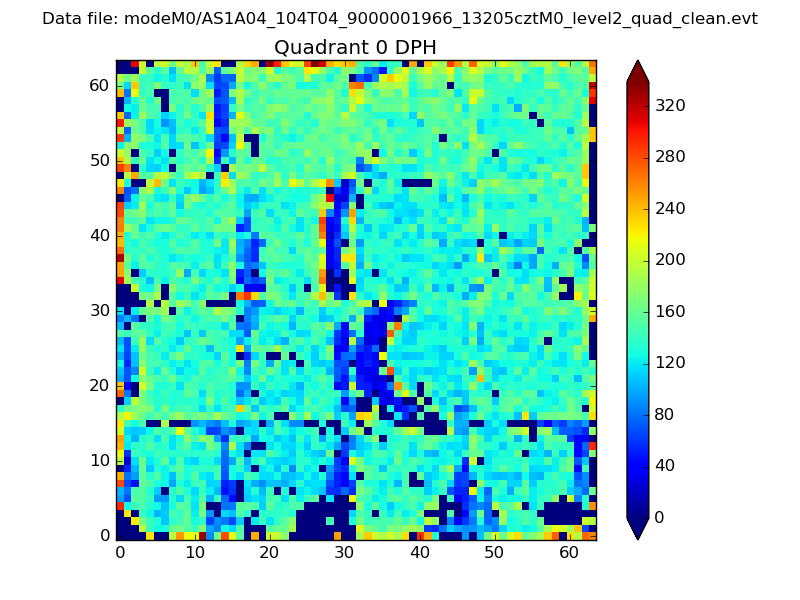 |
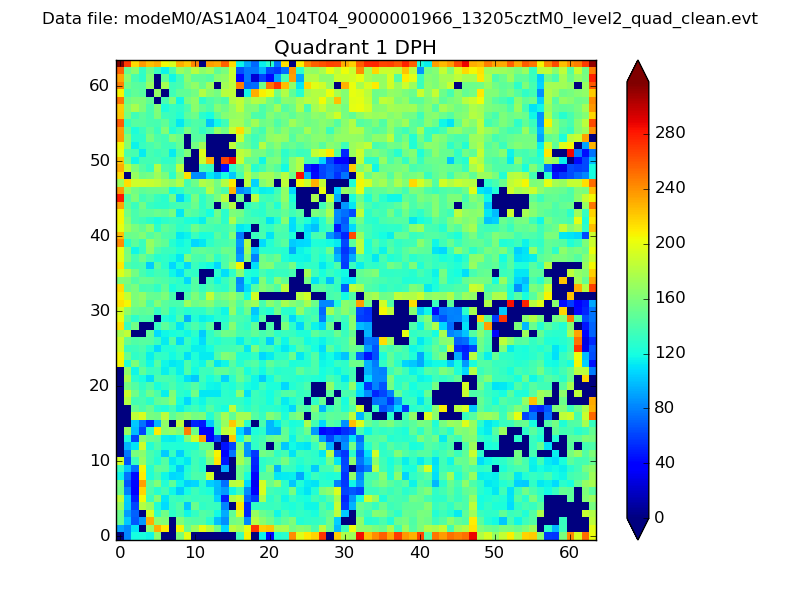 |
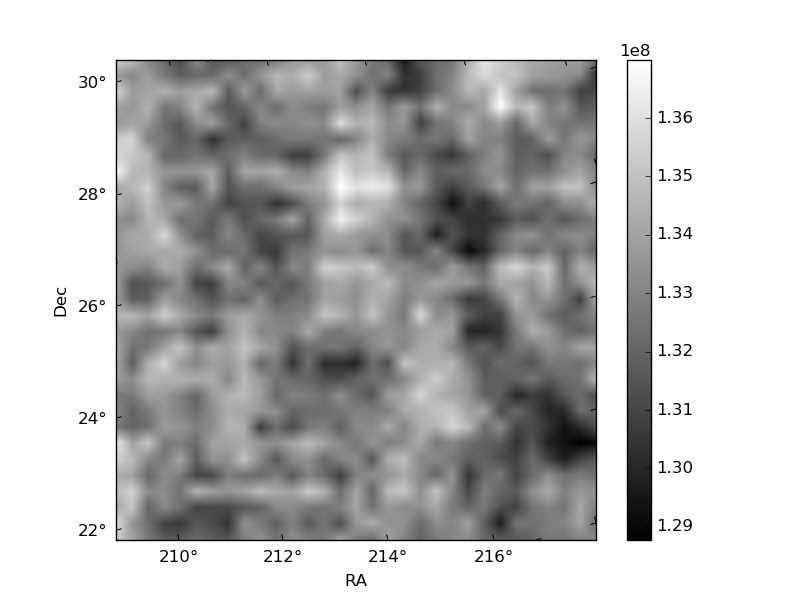
Quadrant B |
|---|---|---|---|
| Quadrant D | 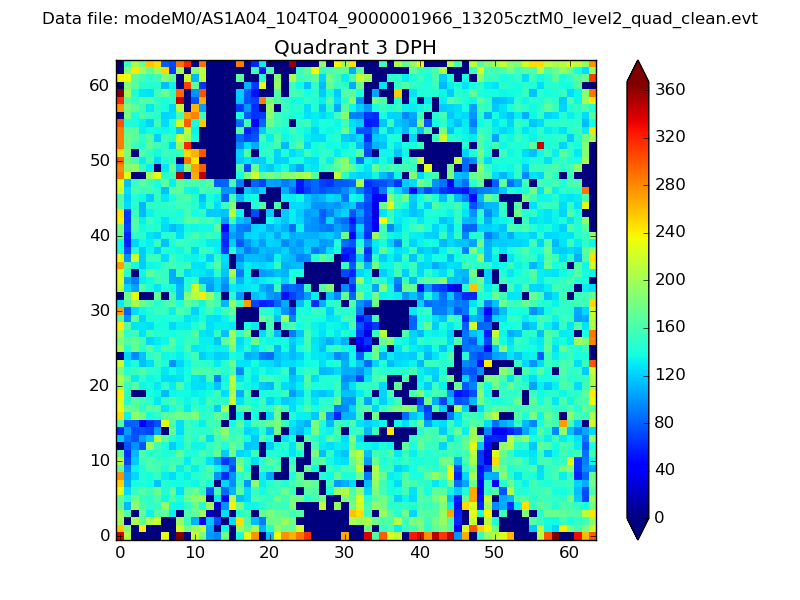 |
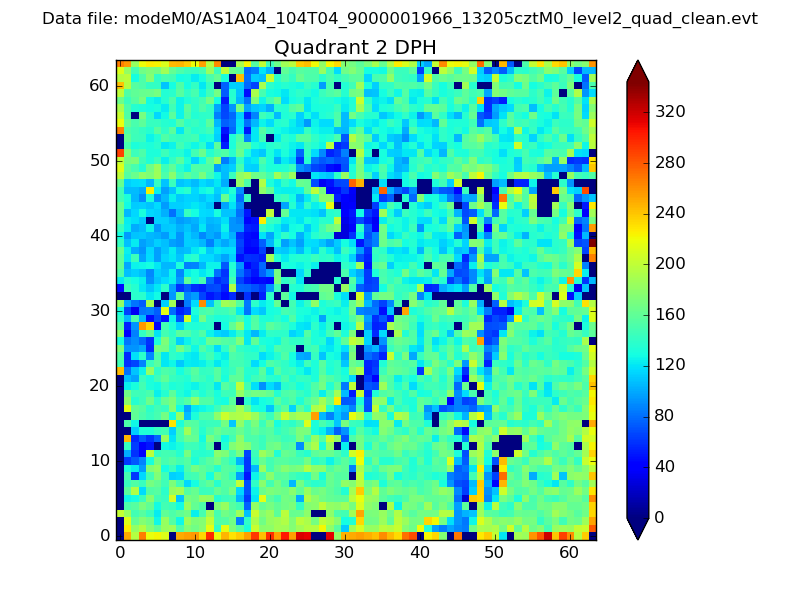 |
Quadrant C |
| Plot type | Count rate plots | Images |
|---|---|---|
| Comparison with Poisson distribution Blue bars denote a histogram of data divided into 1 sec bins. Red curve is a Poisson curve with rate = median count rate of data. |
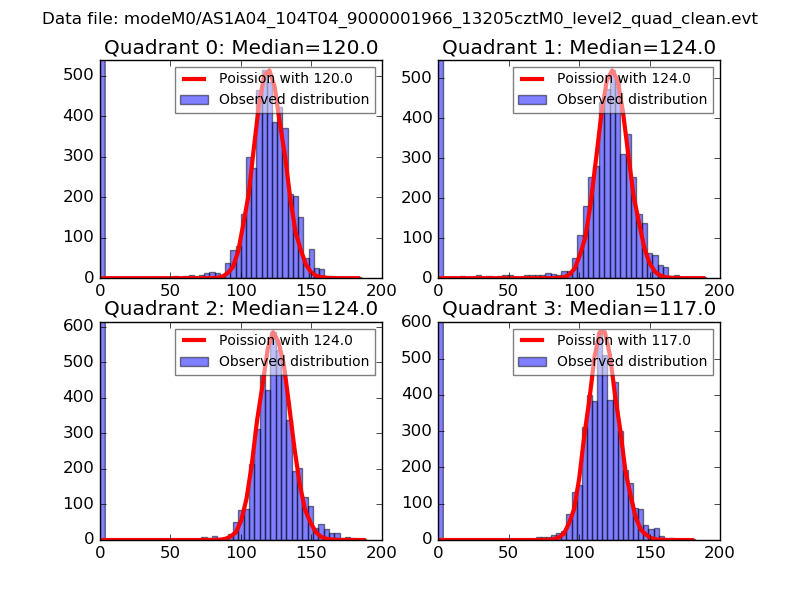 |
 |
| Quadrant-wise count rates Data is divided into 100 sec bins |
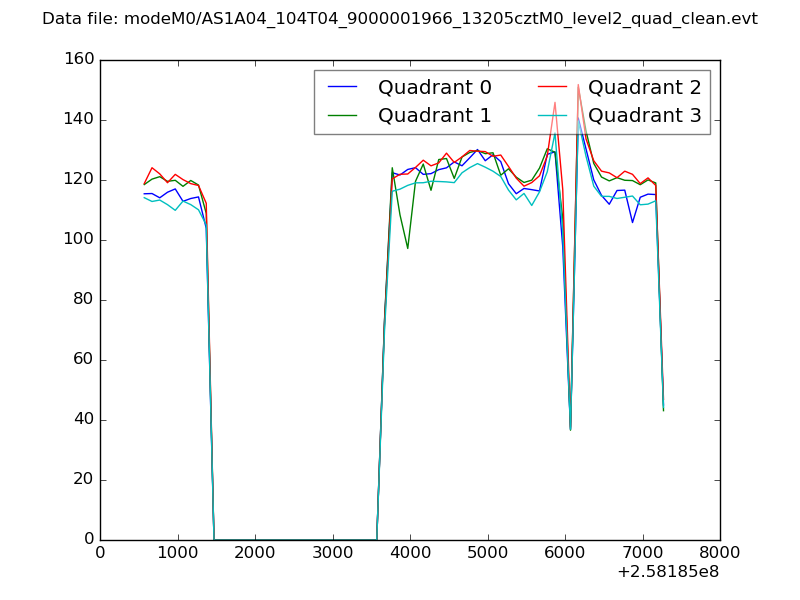 |
|
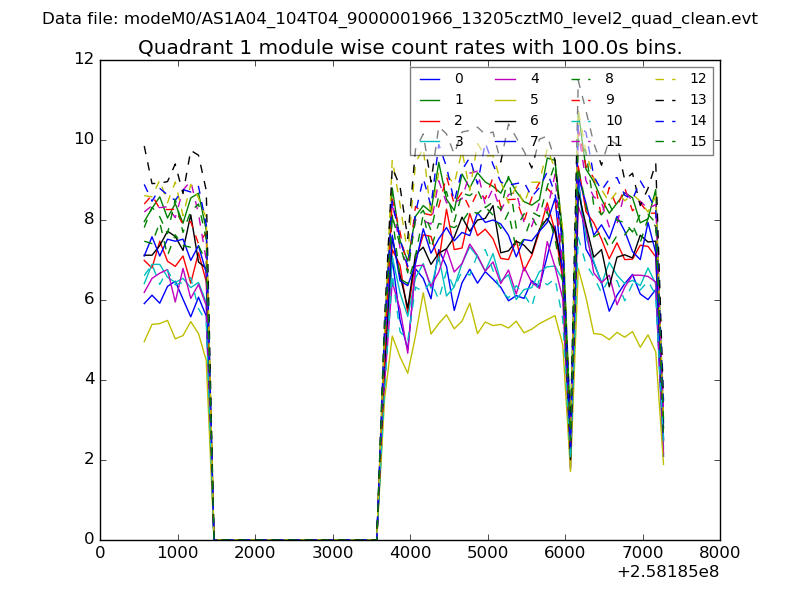
| Module-wise count rates for Quadrant A Data is divided into 100 sec bins |
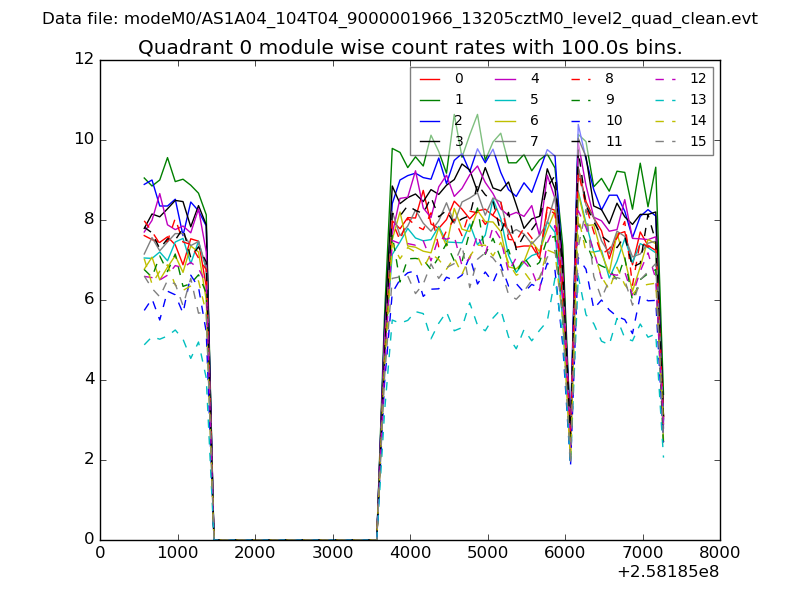 |
 |
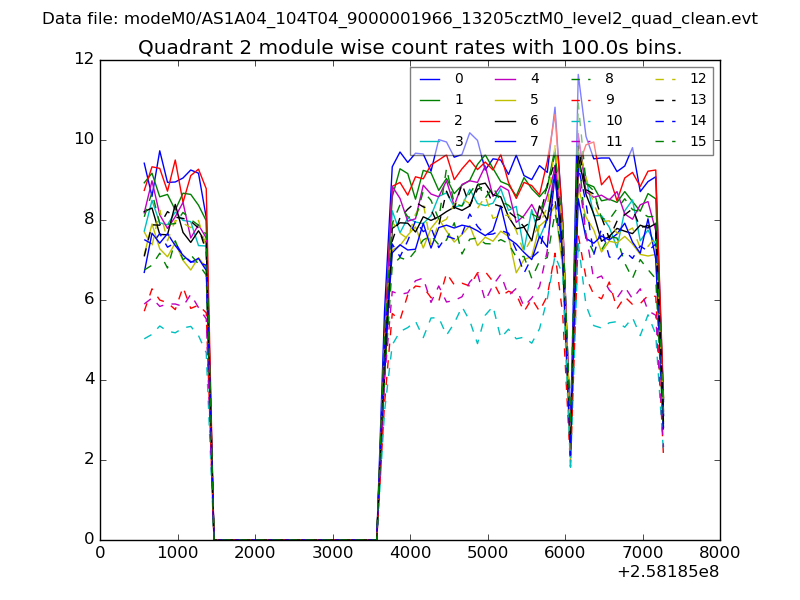
| Module-wise count rates for Quadrant B Data is divided into 100 sec bins |
 |
 |
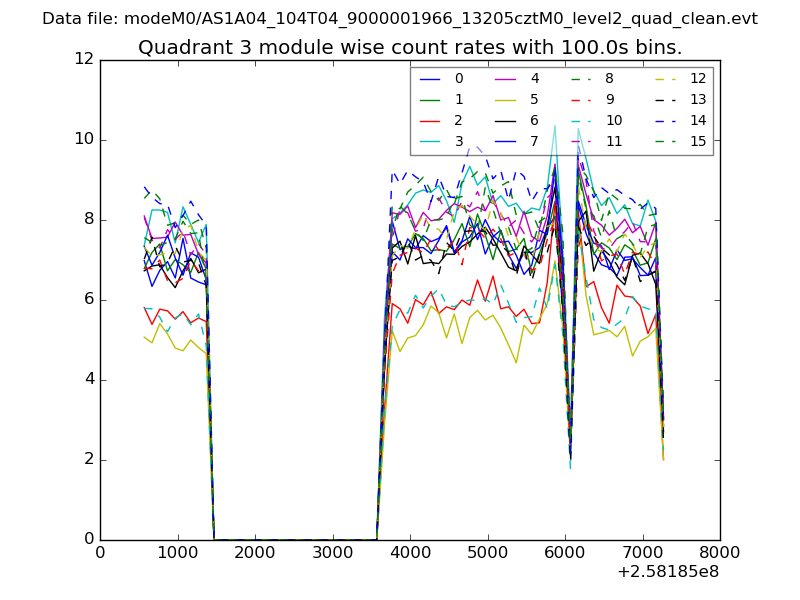
| Module-wise count rates for Quadrant C Data is divided into 100 sec bins |
 |
 |
| Module-wise count rates for Quadrant D Data is divided into 100 sec bins |
 |
 |
| Parameter | Plot |
|---|---|
| CZT HV Monitor | 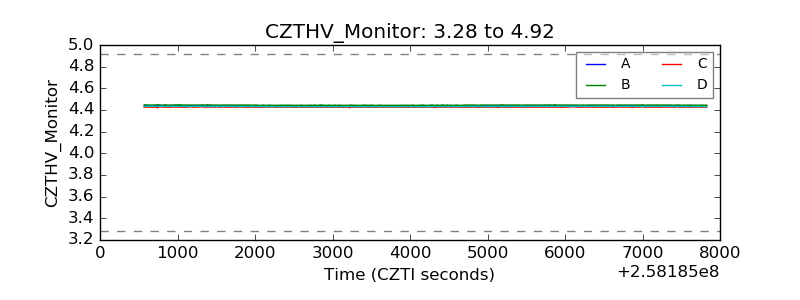 |
| D_VDD | 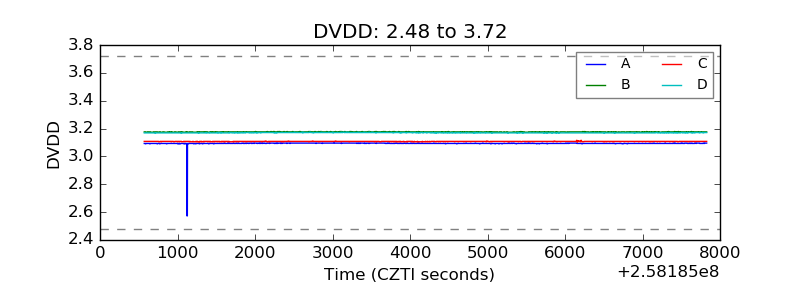 |
| Temperature 1 | 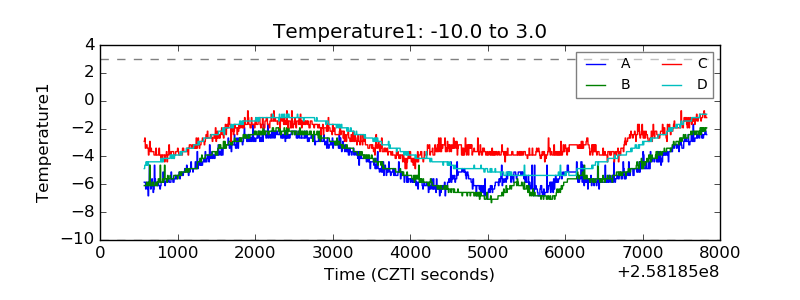 |
| Veto HV Monitor | 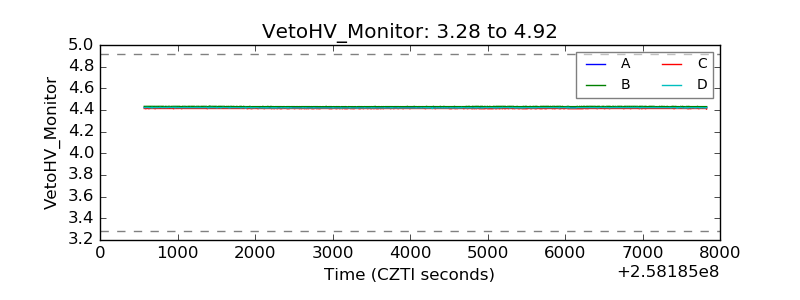 |
| Veto LLD | 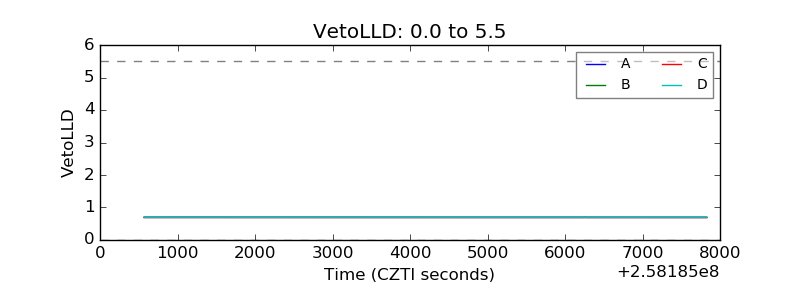 |
| Alpha Counter | 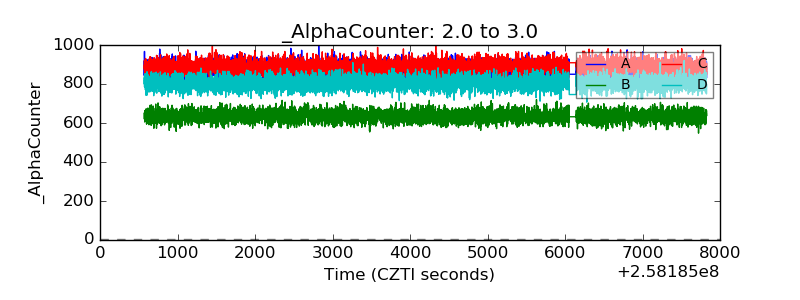 |
| _CPM_Rate | 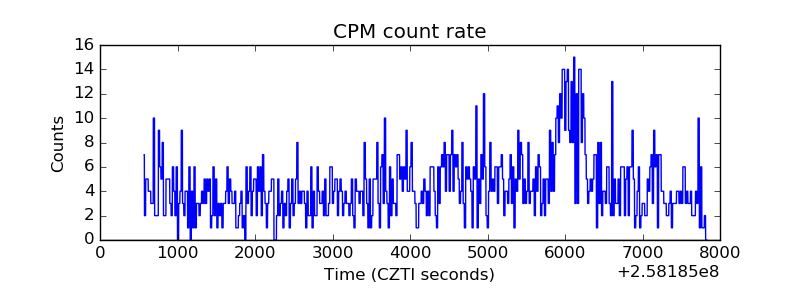 |
| CZT Counter | 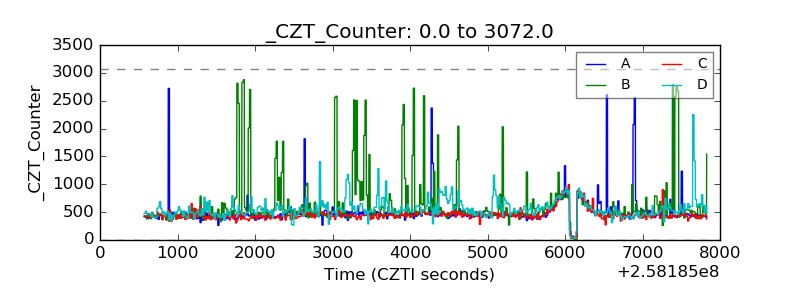 |
| +2.5 Volts monitor | 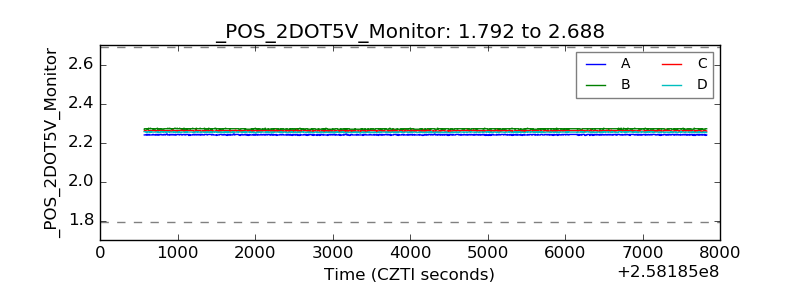 |
| +5 Volts monitor | 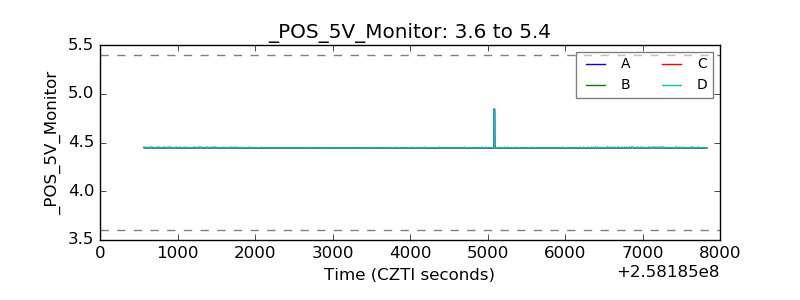 |
| _ROLL_ROT | 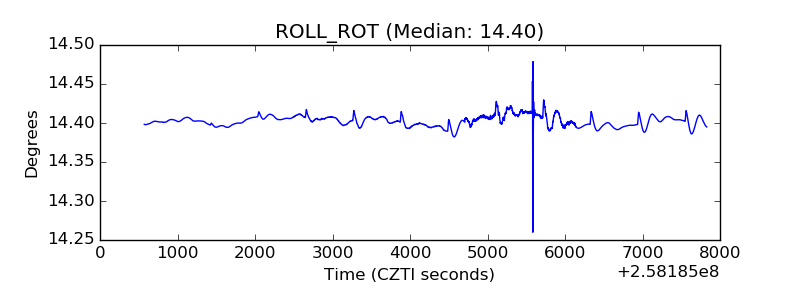 |
| _Roll_DEC | 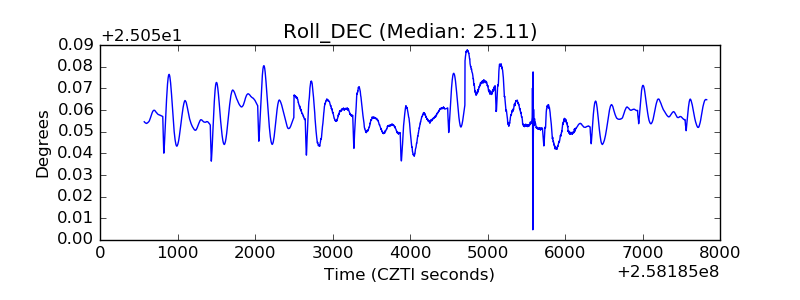 |
| _Roll_RA | 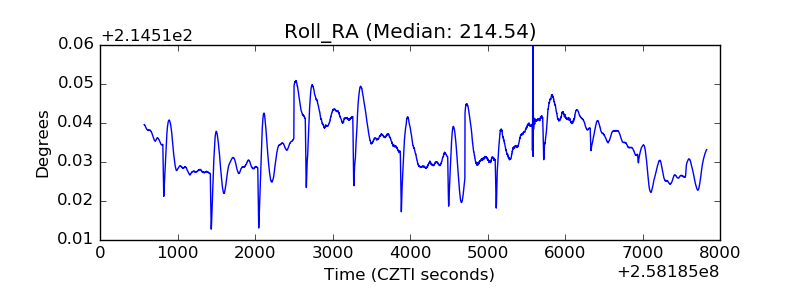 |
| Veto Counter | 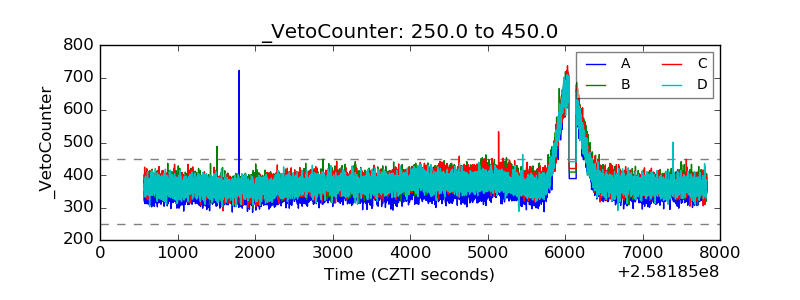 |