| Param | Original file | Final file |
|---|---|---|
| Filename | modeM0/AS1A04_104T04_9000001966_13208cztM0_level2.evt | modeM0/AS1A04_104T04_9000001966_13208cztM0_level2_quad_clean.evt |
| Size (bytes) | 1,010,802,240 | 138,654,720 |
| Size | 964.0 MB | 132.2 MB |
| Events in quadrant A | 6,220,838 | 833,480 |
| Events in quadrant B | 9,591,497 | 809,510 |
| Events in quadrant C | 5,955,436 | 845,992 |
| Events in quadrant D | 7,965,253 | 811,128 |
| Mode M9 | |||
|---|---|---|---|
| Quadrant | BADHDUFLAG | Total packets | Discarded packets |
| A | 0 | 12 | 0 |
| B | 0 | 12 | 0 |
| C | 0 | 12 | 0 |
| D | 0 | 12 | 0 |
| Mode M0 | |||
|---|---|---|---|
| Quadrant | BADHDUFLAG | Total packets | Discarded packets |
| A | 0 | 26835 | 3 |
| B | 0 | 36794 | 2 |
| C | 0 | 26599 | 2 |
| D | 0 | 32485 | 2 |
| Mode SS | |||
|---|---|---|---|
| Quadrant | BADHDUFLAG | Total packets | Discarded packets |
| A | 0 | 264 | 0 |
| B | 0 | 264 | 0 |
| C | 0 | 264 | 0 |
| D | 0 | 264 | 0 |
| Quadrant | Total seconds | Saturated seconds | Saturation percentage |
|---|---|---|---|
| A | 13000 | 168 | 1.292308% |
| B | 13000 | 1357 | 10.438462% |
| C | 13000 | 134 | 1.030769% |
| D | 13000 | 309 | 2.376923% |
Noise dominated data is calculated using 1-second bins in cleaned event files. If a bin has >2000 counts, and if more than 50% of those come from <1% of pixels, then it is considered to be noise-dominated and hence unusable.
| Quadrant | # 1 sec bins | Bins with >0 counts | Bins with >2000 counts | High rate bins dominated by noise | Noise dominated (total time) | Noise dominated (detector-on time) | Marked lightcurve |
|---|---|---|---|---|---|---|---|
| A | 14251 | 13003 | 1 | 1 | 0.01% | 0.01% | 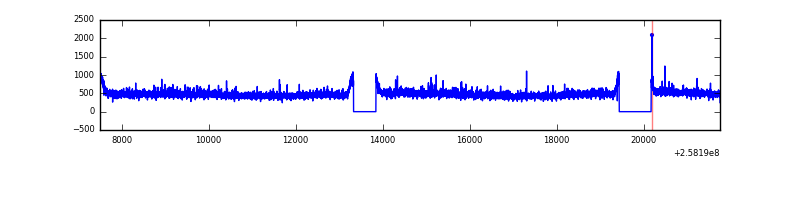 |
| B | 14251 | 13003 | 834 | 834 | 5.85% | 6.41% | 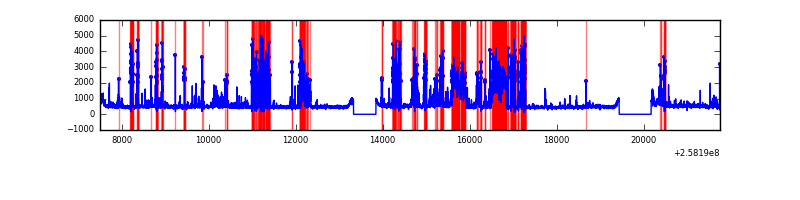 |
| C | 14251 | 13003 | 2 | 2 | 0.01% | 0.02% | 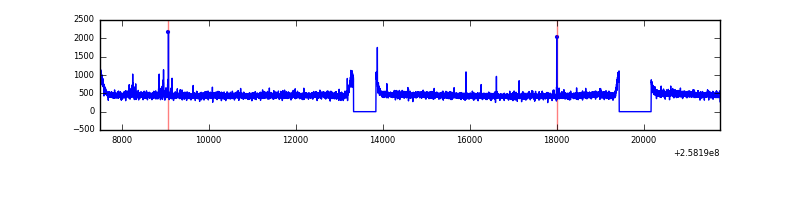 |
| D | 14251 | 13003 | 128 | 128 | 0.90% | 0.98% | 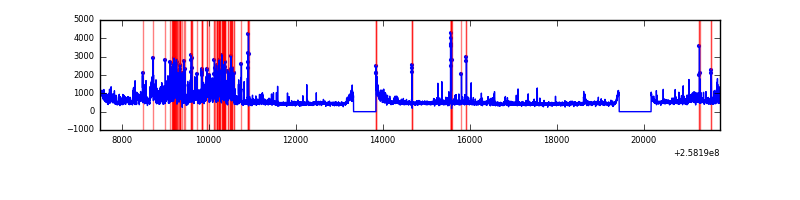 |
Top three noisy pixels from each quadrant. If the there are fewer than three noisy pixels in the level2.evt file, extra rows are filled as -1
| Pixel properties | Quadrant properties | ||||||
|---|---|---|---|---|---|---|---|
| Quadrant | DetID | PixID | Counts | Sigma | Mean | Median | Sigma |
| A | 8 | 15 | 138171 | 428.77 | 1554 | 1521 | 318.7 |
| A | 1 | 162 | 45491 | 137.97 | 1554 | 1521 | 318.7 |
| A | 1 | 178 | 17037 | 48.68 | 1554 | 1521 | 318.7 |
| B | 4 | 239 | 1831567 | 6396.76 | 1497 | 1458 | 286.1 |
| B | 0 | 85 | 1245638 | 4348.77 | 1497 | 1458 | 286.1 |
| B | 3 | 64 | 328987 | 1144.81 | 1497 | 1458 | 286.1 |
| C | 15 | 208 | 29425 | 79.46 | 1513 | 1519 | 351.2 |
| C | 8 | 128 | 11616 | 28.75 | 1513 | 1519 | 351.2 |
| C | 13 | 61 | 11119 | 27.34 | 1513 | 1519 | 351.2 |
| D | 13 | 122 | 1231460 | 3346.42 | 1504 | 1457 | 367.6 |
| D | 1 | 52 | 508191 | 1378.65 | 1504 | 1457 | 367.6 |
| D | 8 | 195 | 337161 | 913.34 | 1504 | 1457 | 367.6 |
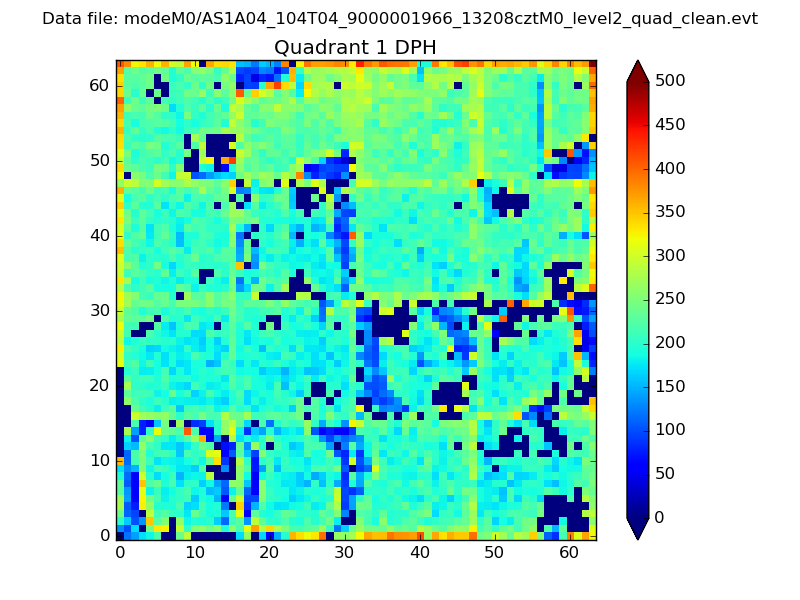
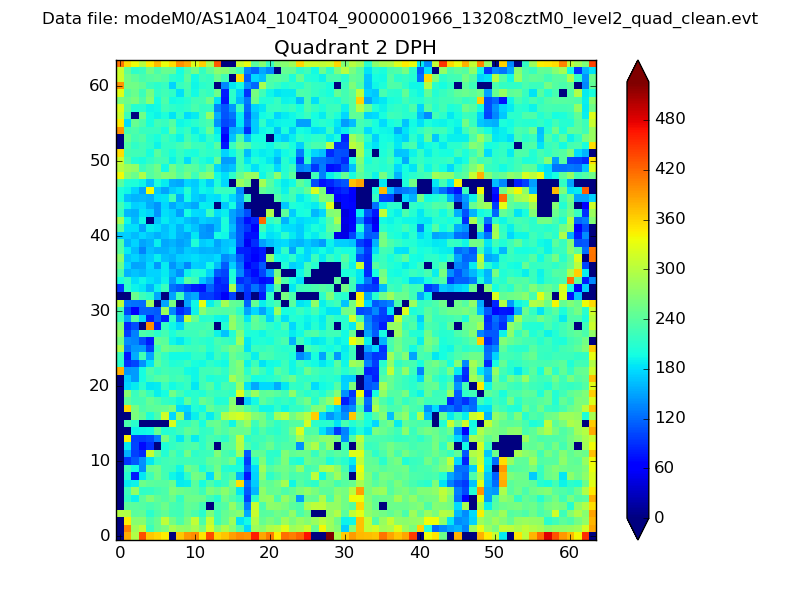
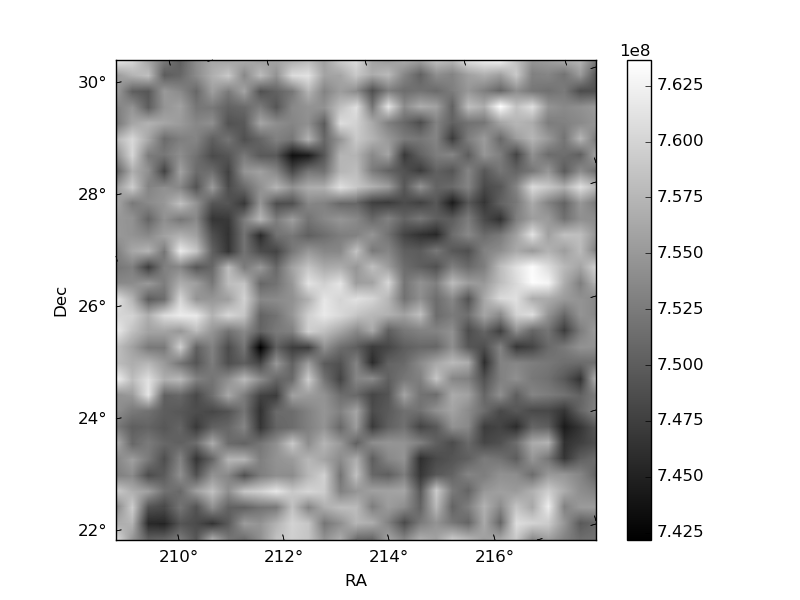
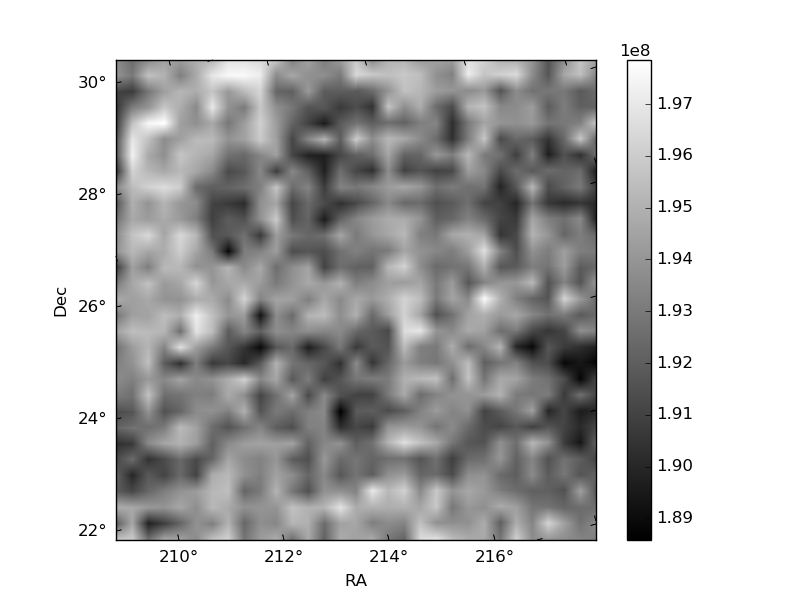
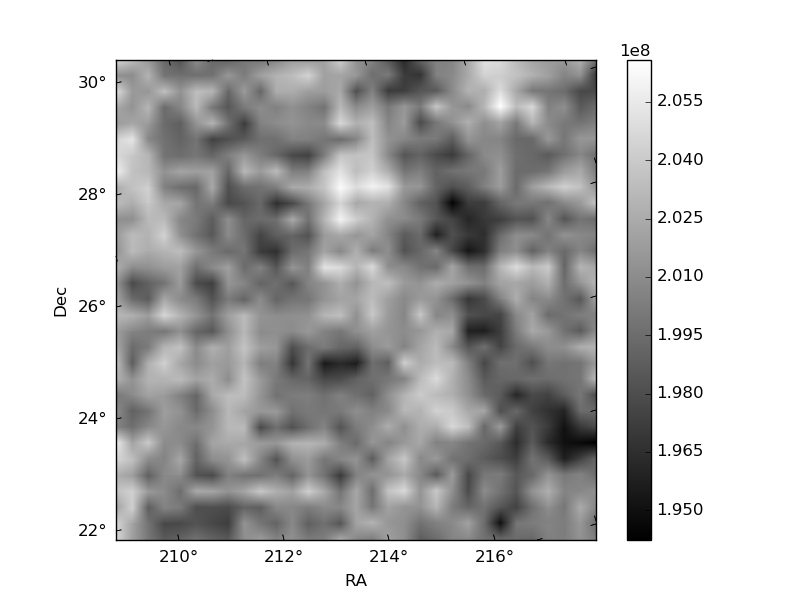
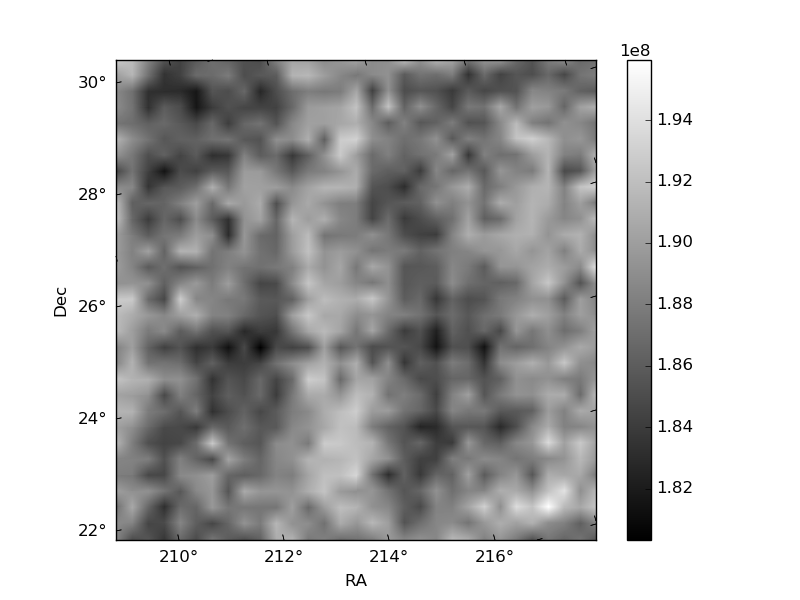
Histogram calculated using DETX and DETY for each event in the final _common_clean file
| Quadrant A |  |
 |
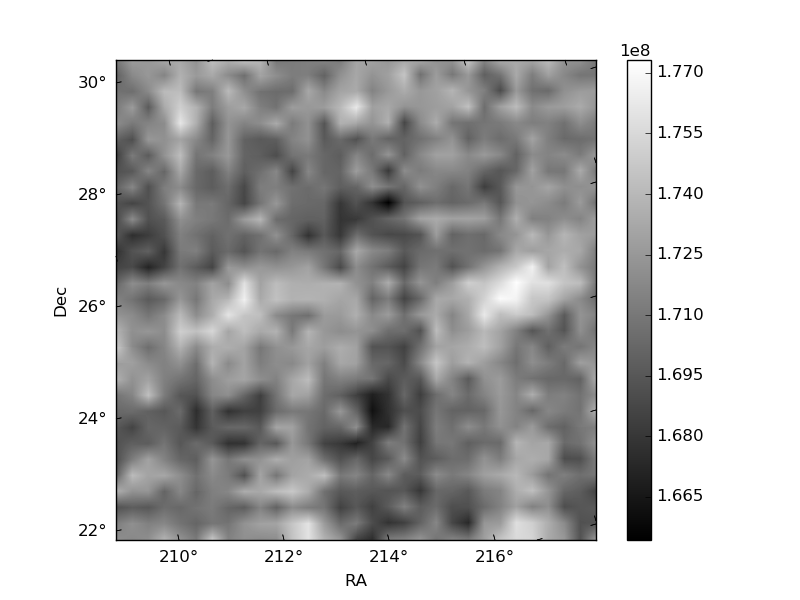
Quadrant B |
|---|---|---|---|
| Quadrant D | 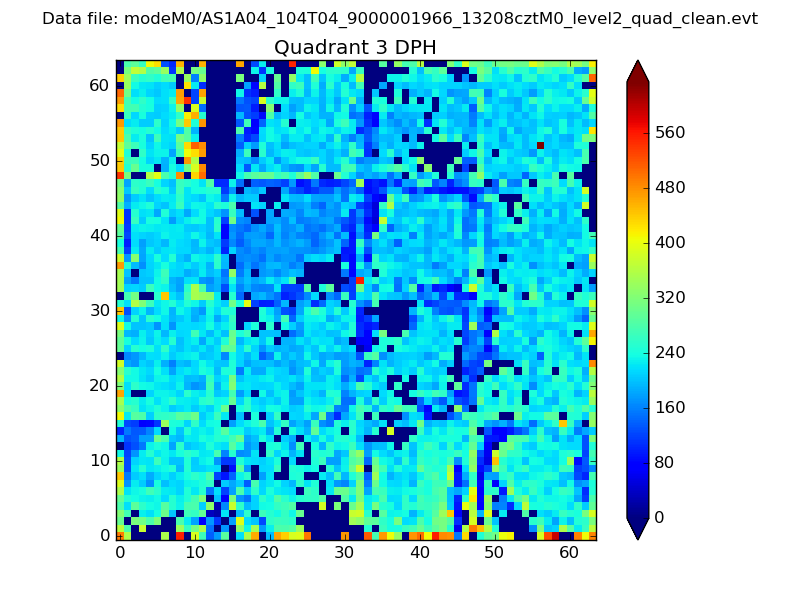 |
 |
Quadrant C |
| Plot type | Count rate plots | Images |
|---|---|---|
| Comparison with Poisson distribution Blue bars denote a histogram of data divided into 1 sec bins. Red curve is a Poisson curve with rate = median count rate of data. |
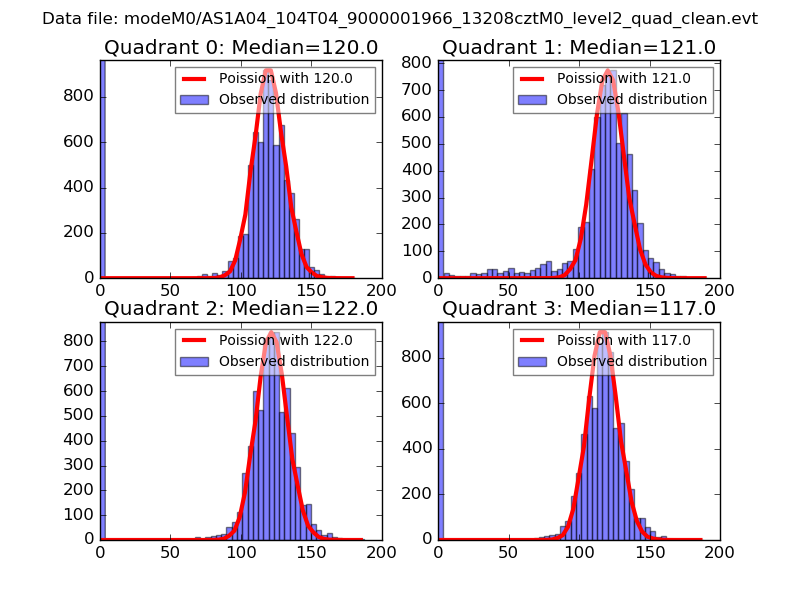 |
 |
| Quadrant-wise count rates Data is divided into 100 sec bins |
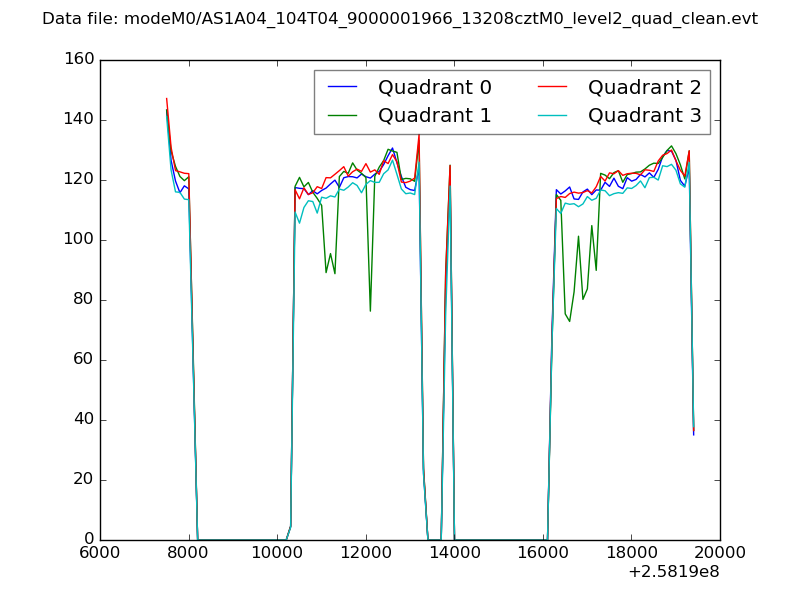 |
|
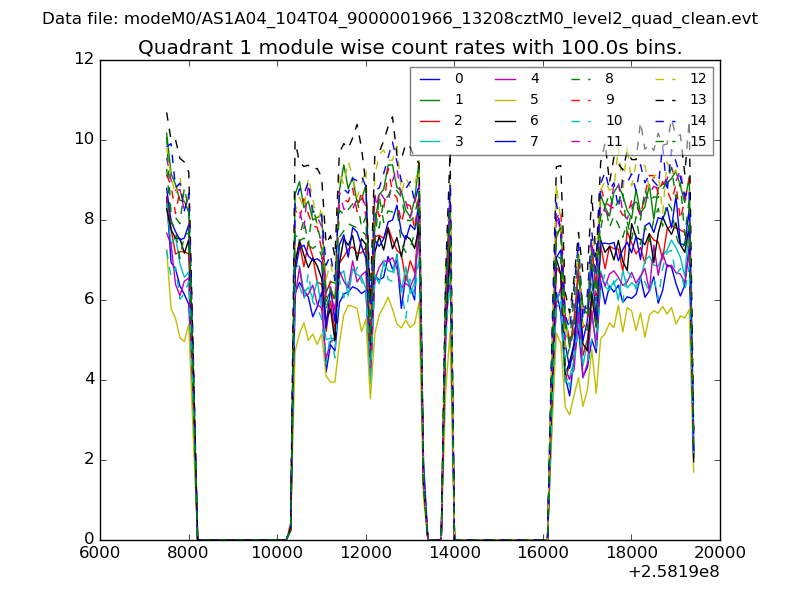
| Module-wise count rates for Quadrant A Data is divided into 100 sec bins |
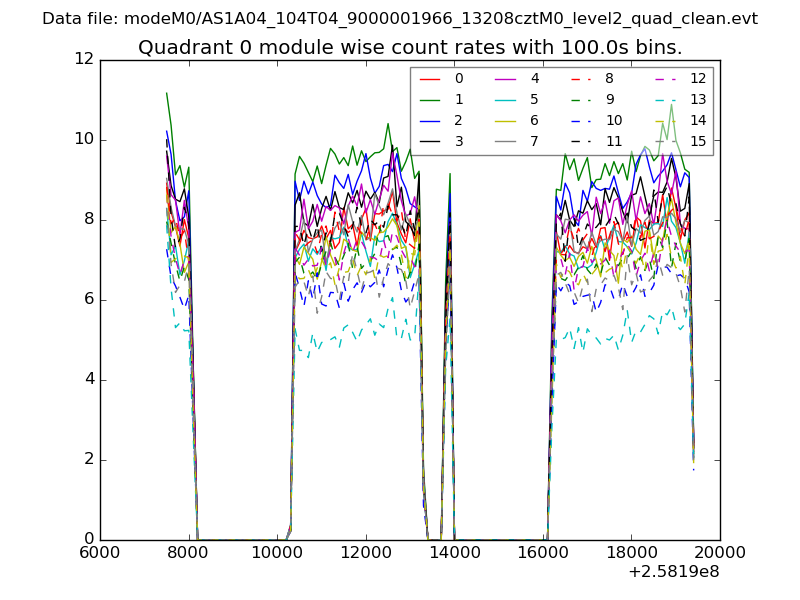 |
 |
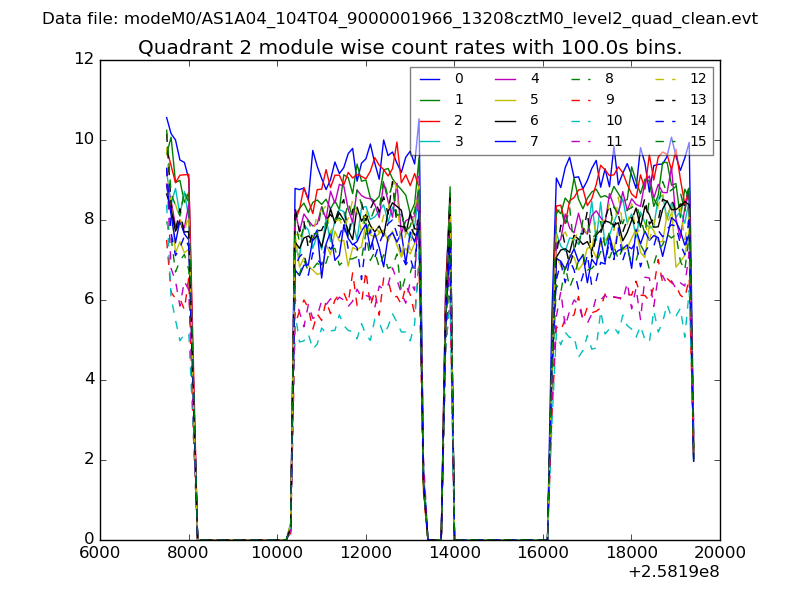
| Module-wise count rates for Quadrant B Data is divided into 100 sec bins |
 |
 |
| Module-wise count rates for Quadrant C Data is divided into 100 sec bins |
 |
 |
| Module-wise count rates for Quadrant D Data is divided into 100 sec bins |
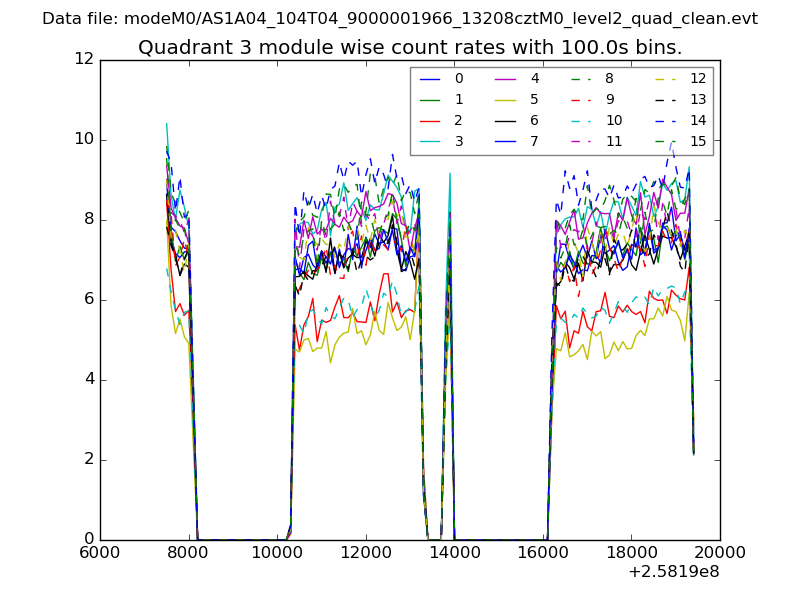 |
 |
| Parameter | Plot |
|---|---|
| CZT HV Monitor | 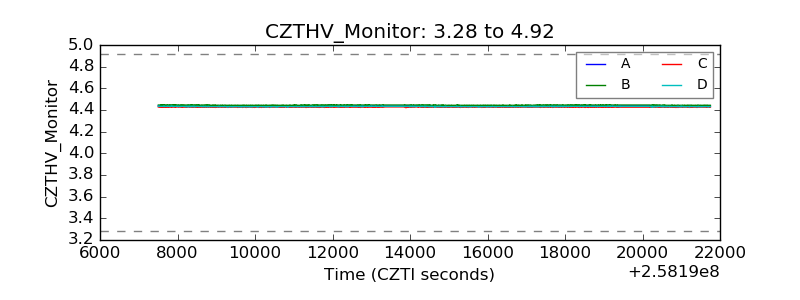 |
| D_VDD | 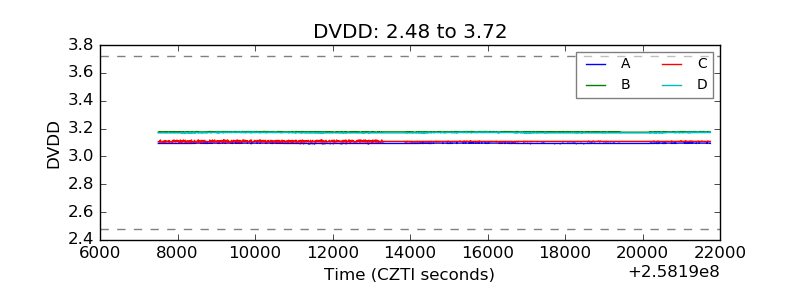 |
| Temperature 1 | 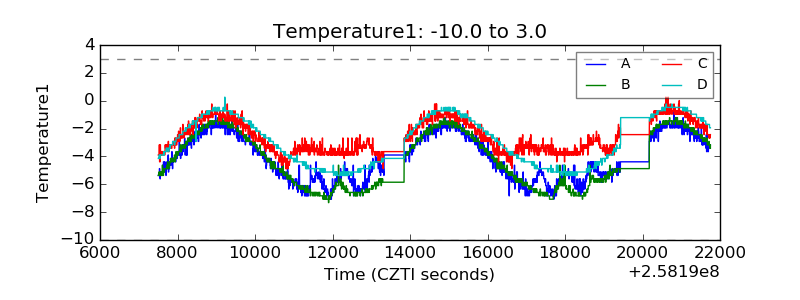 |
| Veto HV Monitor | 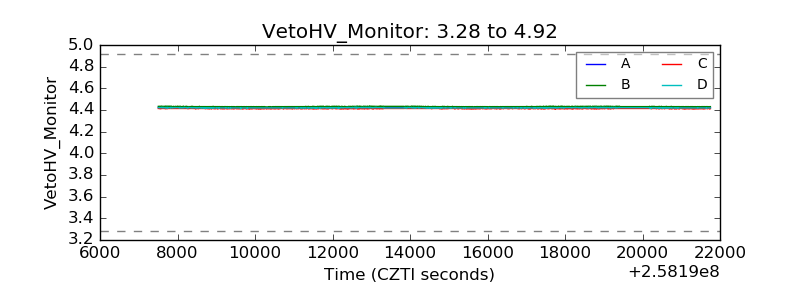 |
| Veto LLD | 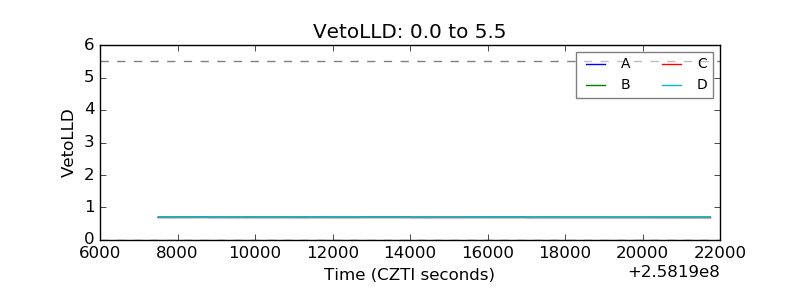 |
| Alpha Counter | 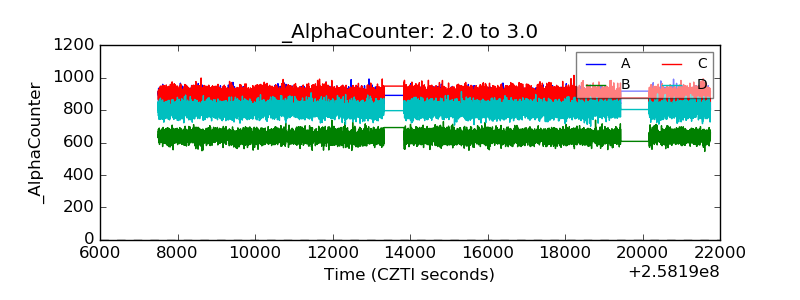 |
| _CPM_Rate | 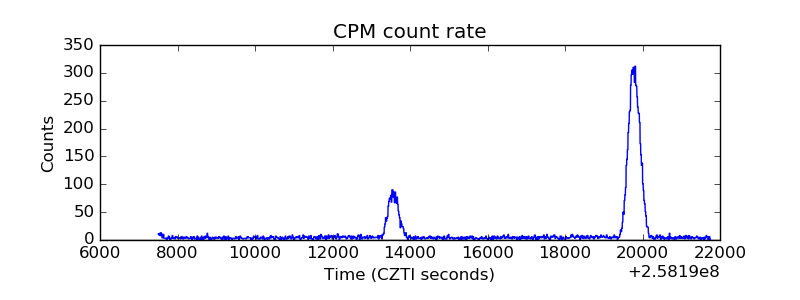 |
| CZT Counter | 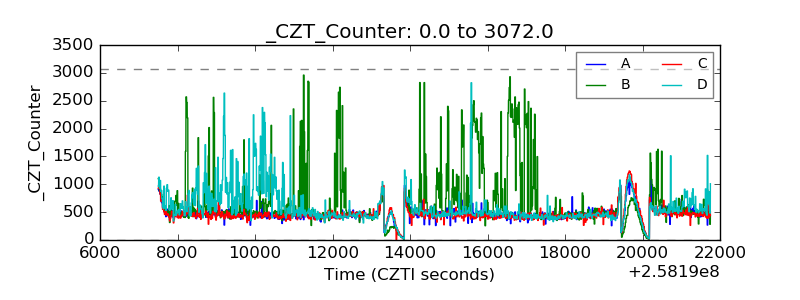 |
| +2.5 Volts monitor |  |
| +5 Volts monitor | 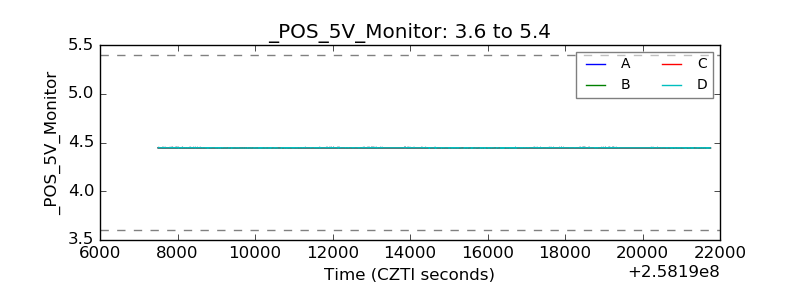 |
| _ROLL_ROT | 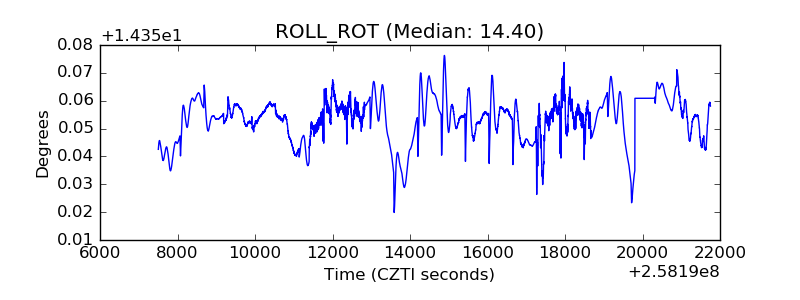 |
| _Roll_DEC | 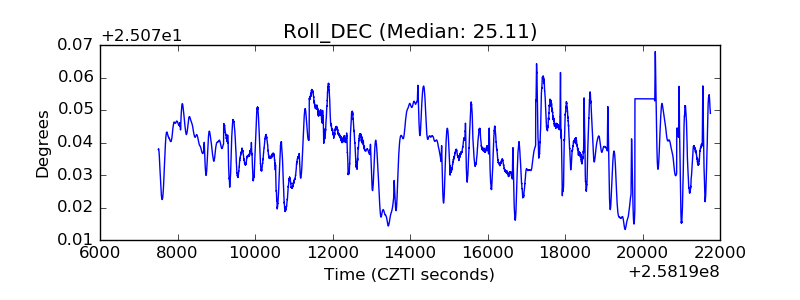 |
| _Roll_RA | 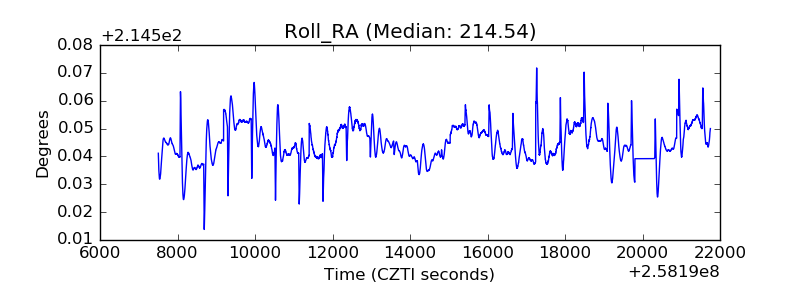 |
| Veto Counter | 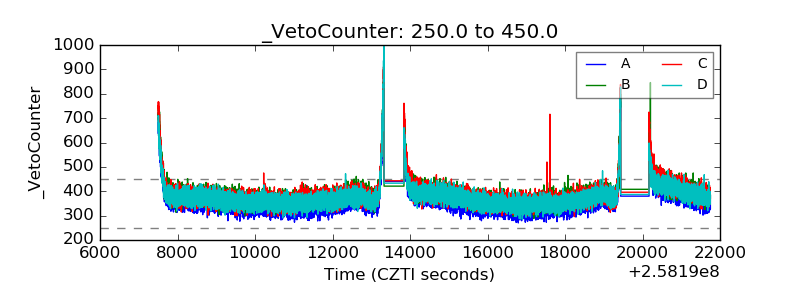 |