| Param | Original file | Final file |
|---|---|---|
| Filename | modeM0/AS1A04_104T04_9000001966_13210cztM0_level2.evt | modeM0/AS1A04_104T04_9000001966_13210cztM0_level2_quad_clean.evt |
| Size (bytes) | 154,411,200 | 9,480,960 |
| Size | 147.3 MB | 9.0 MB |
| Events in quadrant A | 862,840 | 42,387 |
| Events in quadrant B | 1,931,418 | 42,473 |
| Events in quadrant C | 789,105 | 42,654 |
| Events in quadrant D | 981,882 | 40,934 |
| Mode M0 | |||
|---|---|---|---|
| Quadrant | BADHDUFLAG | Total packets | Discarded packets |
| A | 0 | 3487 | 0 |
| B | 0 | 6811 | 0 |
| C | 0 | 3282 | 0 |
| D | 0 | 3920 | 0 |
| Mode SS | |||
|---|---|---|---|
| Quadrant | BADHDUFLAG | Total packets | Discarded packets |
| A | 0 | 32 | 0 |
| B | 0 | 32 | 0 |
| C | 0 | 32 | 0 |
| D | 0 | 32 | 0 |
| Quadrant | Total seconds | Saturated seconds | Saturation percentage |
|---|---|---|---|
| A | 1597 | 6 | 0.375704% |
| B | 1597 | 537 | 33.625548% |
| C | 1597 | 3 | 0.187852% |
| D | 1597 | 14 | 0.876644% |
Noise dominated data is calculated using 1-second bins in cleaned event files. If a bin has >2000 counts, and if more than 50% of those come from <1% of pixels, then it is considered to be noise-dominated and hence unusable.
| Quadrant | # 1 sec bins | Bins with >0 counts | Bins with >2000 counts | High rate bins dominated by noise | Noise dominated (total time) | Noise dominated (detector-on time) | Marked lightcurve |
|---|---|---|---|---|---|---|---|
| A | 1598 | 1598 | 1 | 1 | 0.06% | 0.06% | 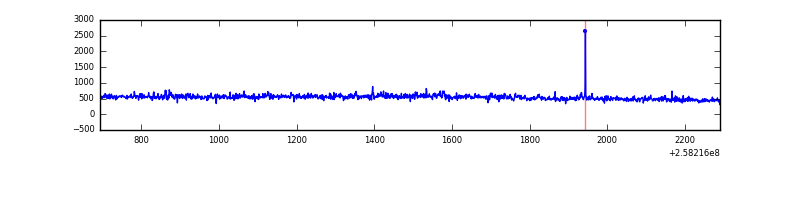 |
| B | 1598 | 1598 | 336 | 336 | 21.03% | 21.03% |  |
| C | 1598 | 1598 | 0 | 0 | 0.00% | 0.00% | 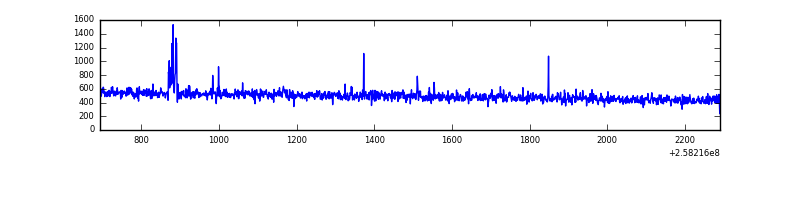 |
| D | 1598 | 1598 | 4 | 4 | 0.25% | 0.25% | 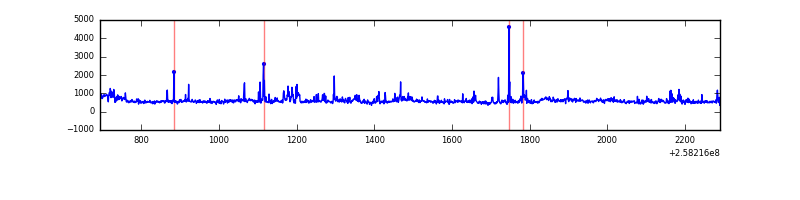 |
Top three noisy pixels from each quadrant. If the there are fewer than three noisy pixels in the level2.evt file, extra rows are filled as -1
| Pixel properties | Quadrant properties | ||||||
|---|---|---|---|---|---|---|---|
| Quadrant | DetID | PixID | Counts | Sigma | Mean | Median | Sigma |
| A | 8 | 15 | 59837 | 1364.66 | 203 | 198 | 43.7 |
| A | 1 | 162 | 7734 | 172.44 | 203 | 198 | 43.7 |
| A | 12 | 96 | 7066 | 157.15 | 203 | 198 | 43.7 |
| B | 4 | 239 | 1212978 | 34524.05 | 174 | 170 | 35.1 |
| B | 3 | 209 | 20433 | 576.81 | 174 | 170 | 35.1 |
| B | 0 | 197 | 5735 | 158.41 | 174 | 170 | 35.1 |
| C | 15 | 208 | 15162 | 316.14 | 198 | 199 | 47.3 |
| C | 13 | 61 | 1429 | 25.99 | 198 | 199 | 47.3 |
| C | 14 | 234 | 1003 | 16.99 | 198 | 199 | 47.3 |
| D | 1 | 52 | 70978 | 1409.71 | 199 | 192 | 50.2 |
| D | 14 | 34 | 58152 | 1154.28 | 199 | 192 | 50.2 |
| D | 8 | 195 | 55531 | 1102.08 | 199 | 192 | 50.2 |
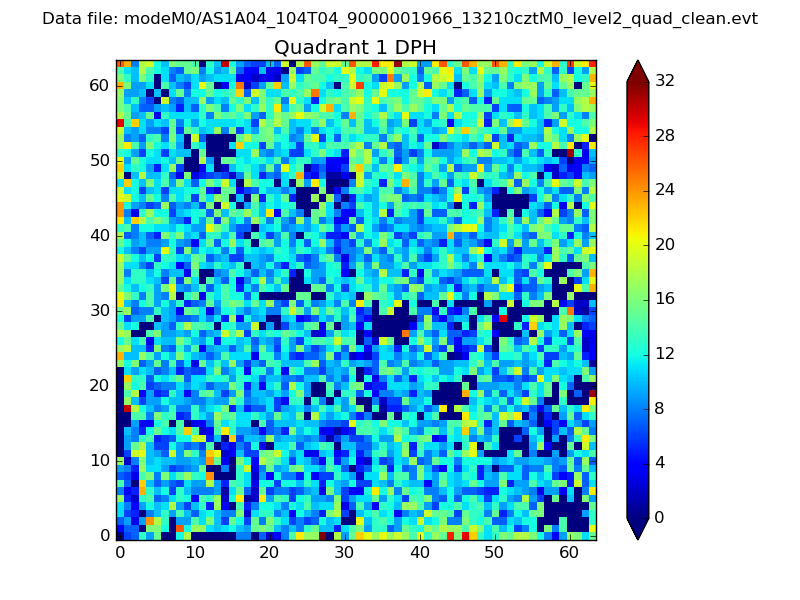
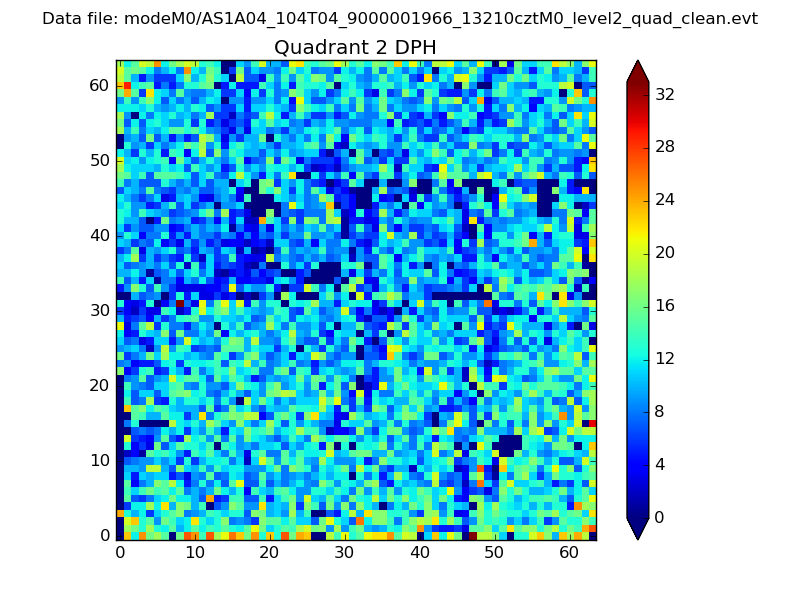
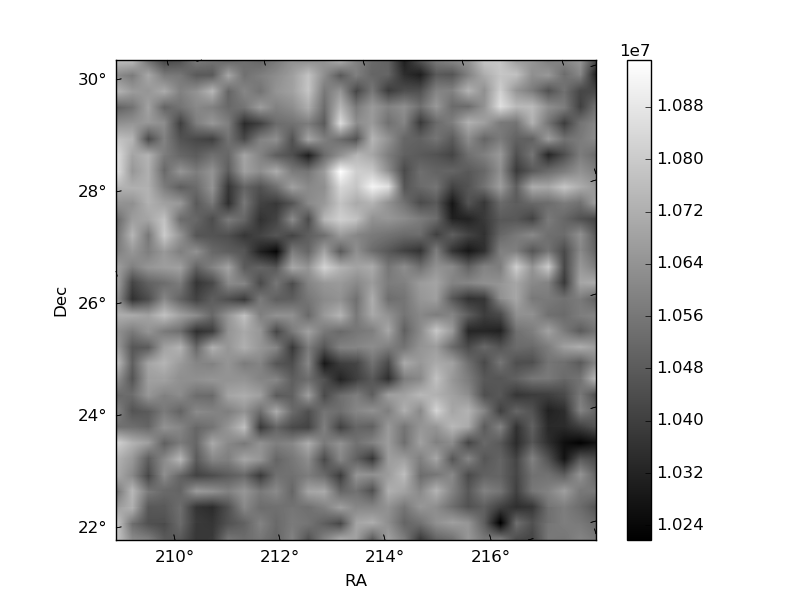
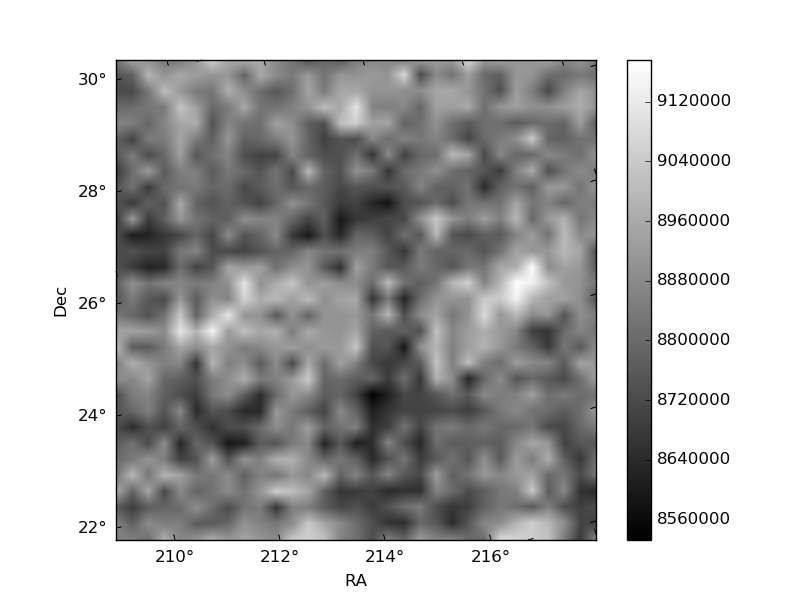
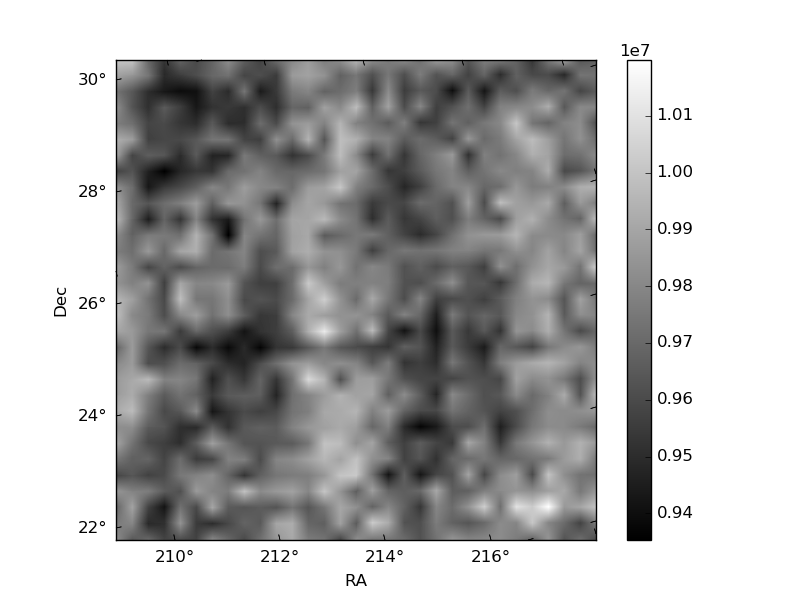
Histogram calculated using DETX and DETY for each event in the final _common_clean file
| Quadrant A | 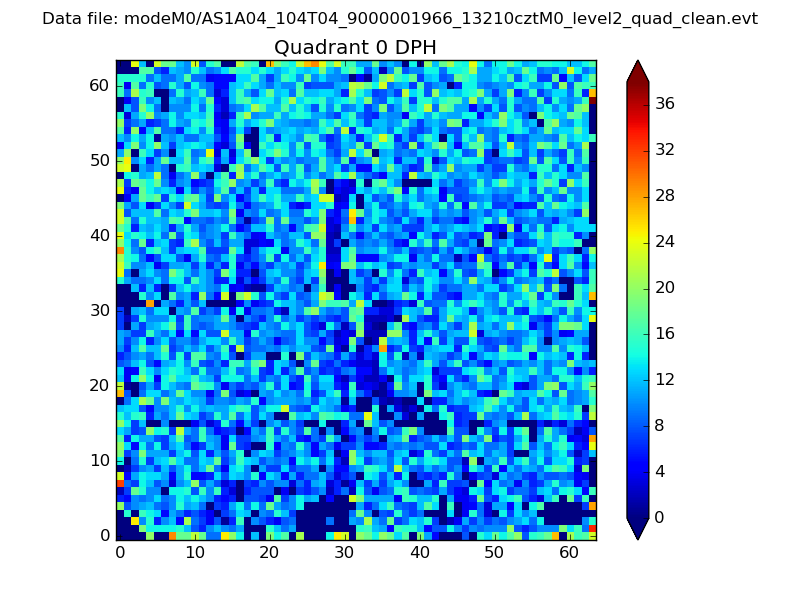 |
 |
Quadrant B |
|---|---|---|---|
| Quadrant D | 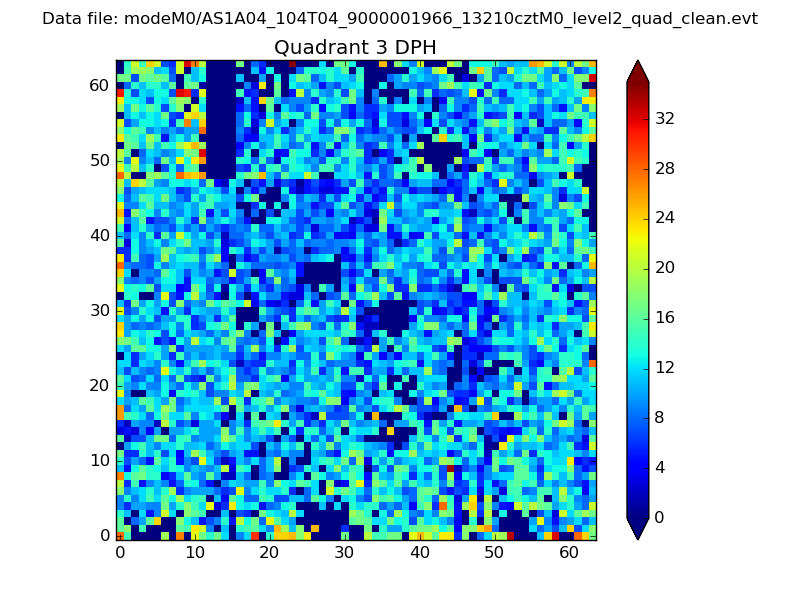 |
 |
Quadrant C |
| Plot type | Count rate plots | Images |
|---|---|---|
| Comparison with Poisson distribution Blue bars denote a histogram of data divided into 1 sec bins. Red curve is a Poisson curve with rate = median count rate of data. |
 |
 |
| Quadrant-wise count rates Data is divided into 100 sec bins |
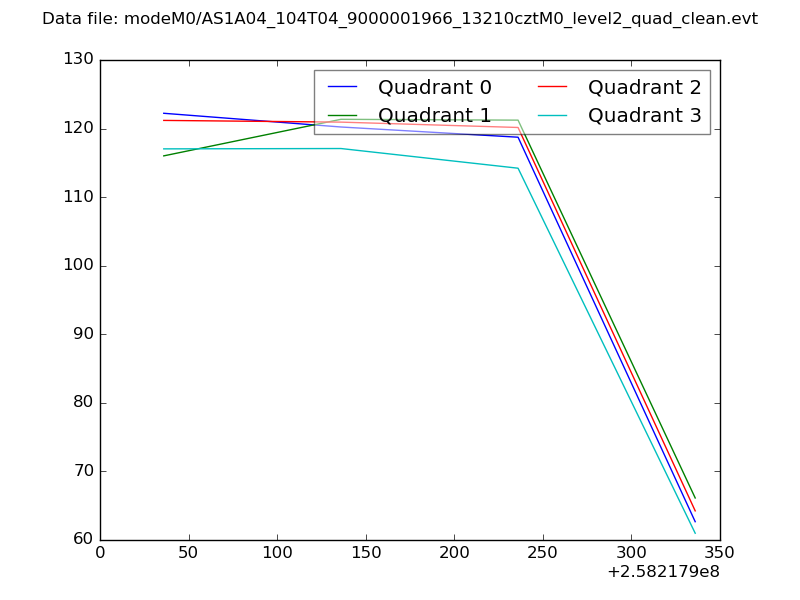 |
|
| Module-wise count rates for Quadrant A Data is divided into 100 sec bins |
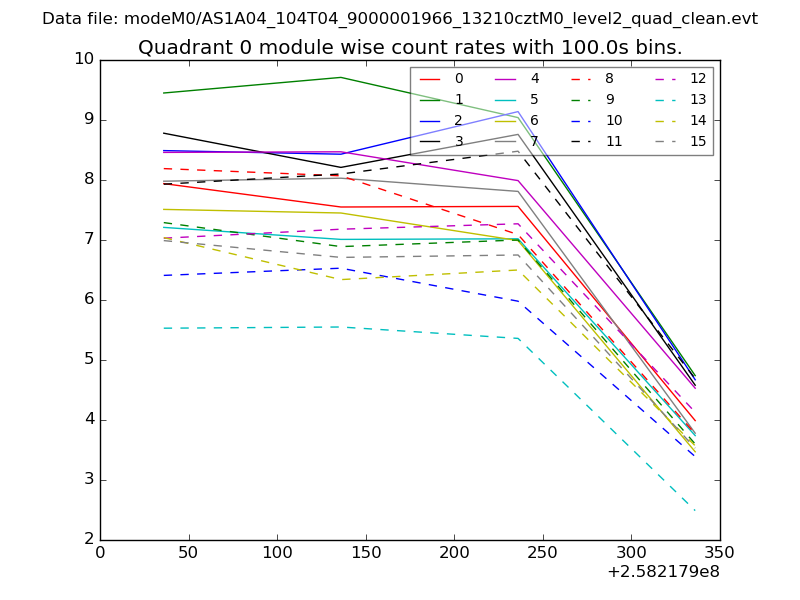 |
 |
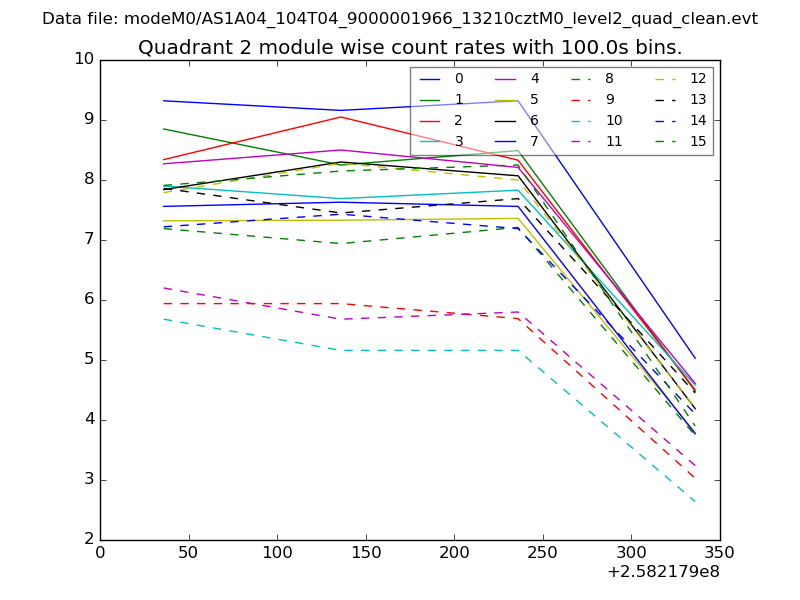
| Module-wise count rates for Quadrant B Data is divided into 100 sec bins |
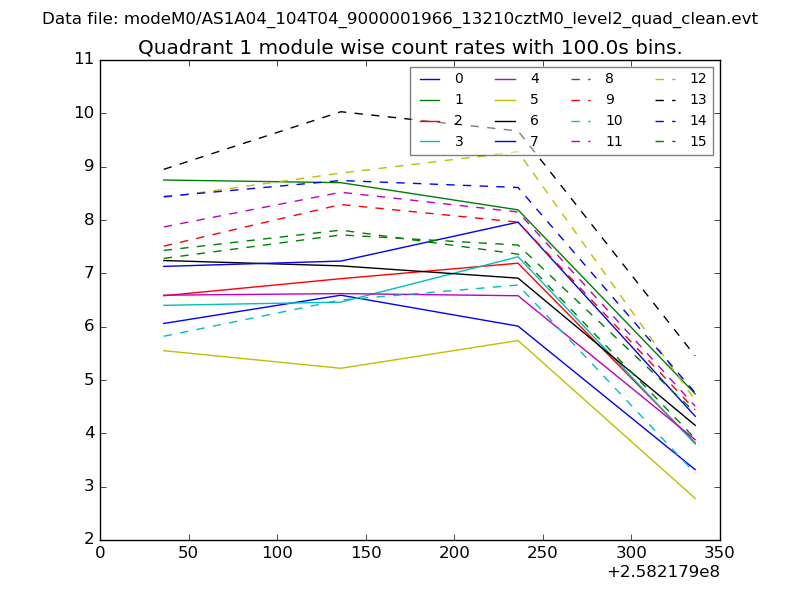 |
 |
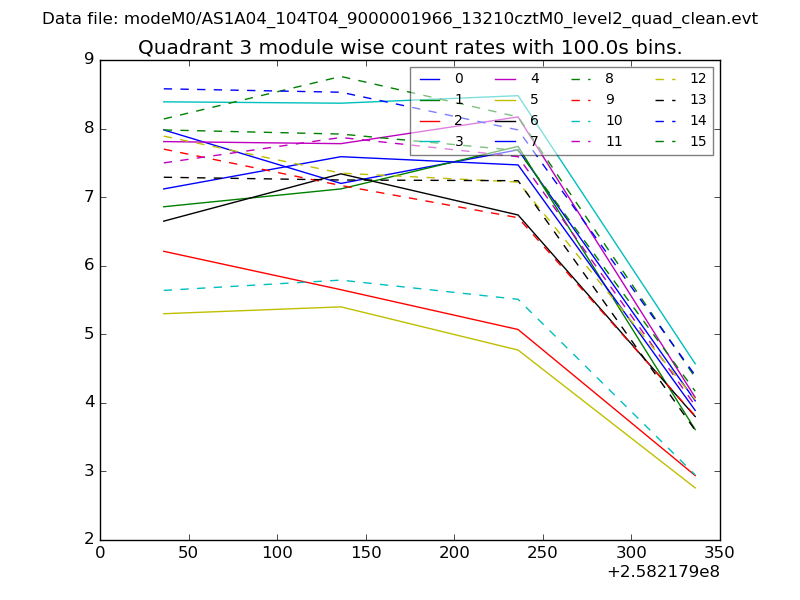
| Module-wise count rates for Quadrant C Data is divided into 100 sec bins |
 |
 |
| Module-wise count rates for Quadrant D Data is divided into 100 sec bins |
 |
 |
| Parameter | Plot |
|---|---|
| CZT HV Monitor | 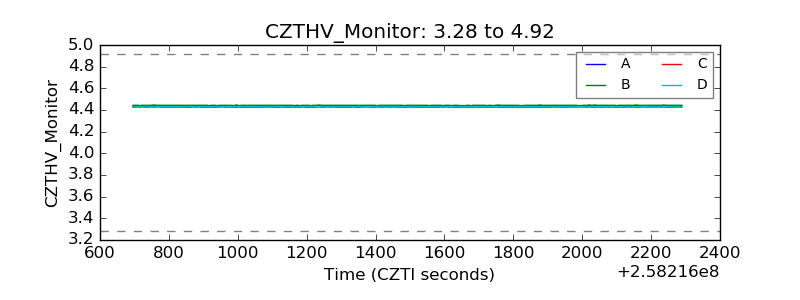 |
| D_VDD | 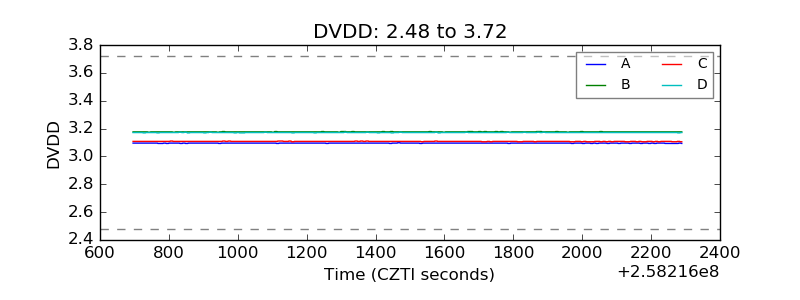 |
| Temperature 1 | 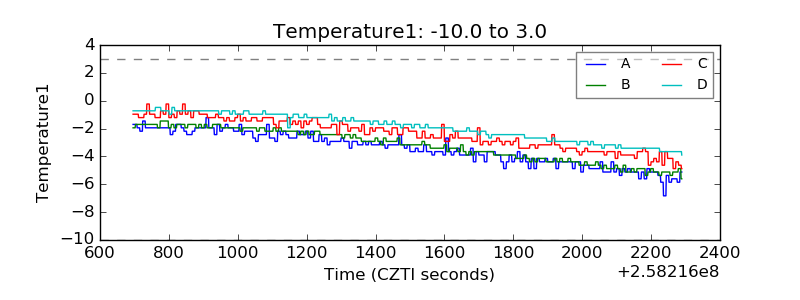 |
| Veto HV Monitor | 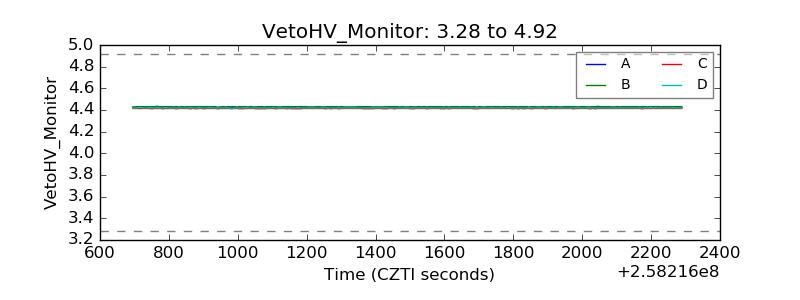 |
| Veto LLD | 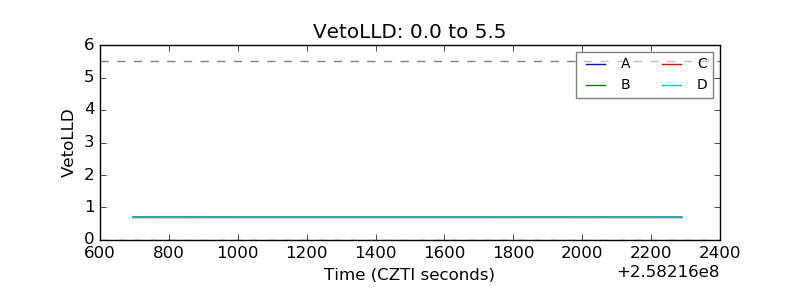 |
| Alpha Counter | 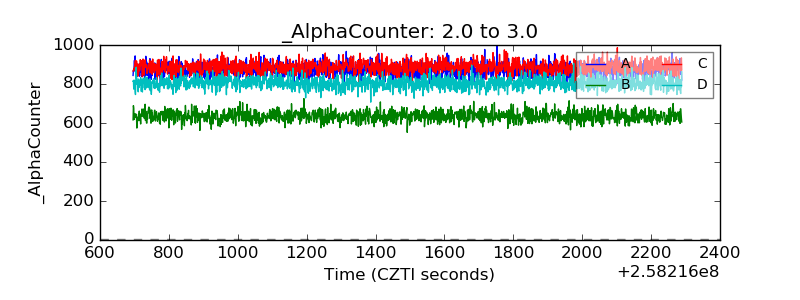 |
| _CPM_Rate | 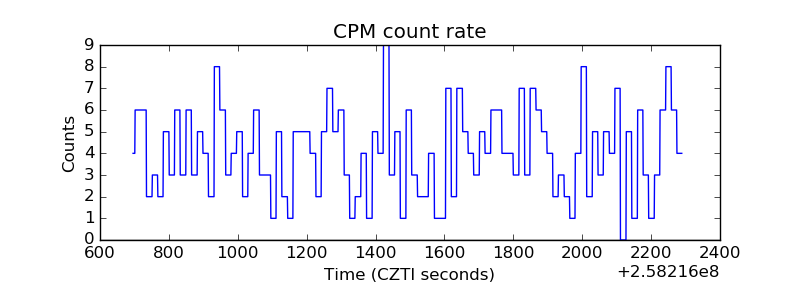 |
| CZT Counter | 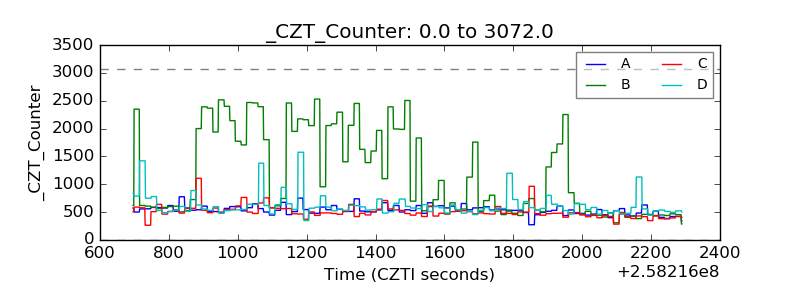 |
| +2.5 Volts monitor |  |
| +5 Volts monitor | 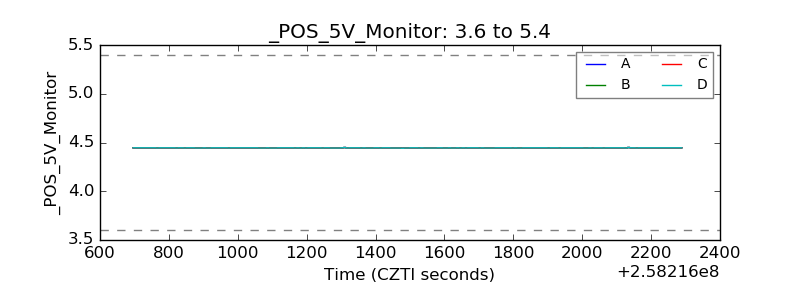 |
| _ROLL_ROT |  |
| _Roll_DEC |  |
| _Roll_RA | 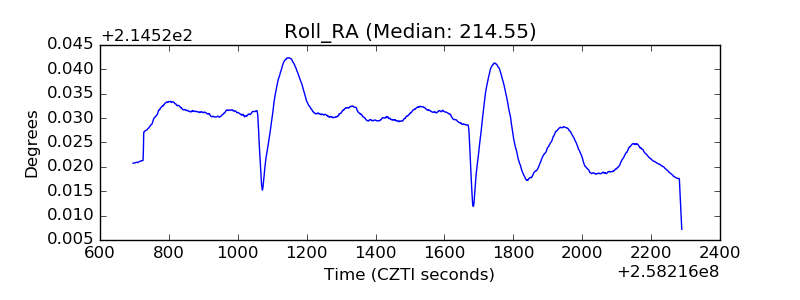 |
| Veto Counter | 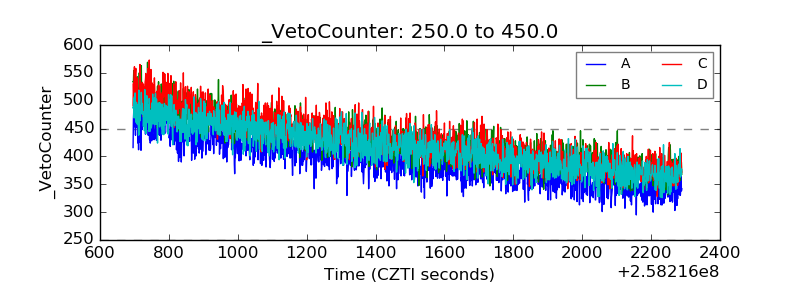 |