| Param | Original file | Final file |
|---|---|---|
| Filename | modeM0/AS1A04_176T04_9000001964_13191cztM0_level2.evt | modeM0/AS1A04_176T04_9000001964_13191cztM0_level2_quad_clean.evt |
| Size (bytes) | 661,472,640 | 77,319,360 |
| Size | 630.8 MB | 73.7 MB |
| Events in quadrant A | 3,427,737 | 477,704 |
| Events in quadrant B | 3,963,371 | 482,458 |
| Events in quadrant C | 3,083,432 | 485,434 |
| Events in quadrant D | 9,092,512 | 416,349 |
| Mode M0 | |||
|---|---|---|---|
| Quadrant | BADHDUFLAG | Total packets | Discarded packets |
| A | 0 | 14591 | 2 |
| B | 0 | 16255 | 1 |
| C | 0 | 14134 | 1 |
| D | 0 | 31727 | 1 |
| Mode SS | |||
|---|---|---|---|
| Quadrant | BADHDUFLAG | Total packets | Discarded packets |
| A | 0 | 138 | 0 |
| B | 0 | 138 | 0 |
| C | 0 | 138 | 0 |
| D | 0 | 138 | 0 |
| Mode M9 | |||
|---|---|---|---|
| Quadrant | BADHDUFLAG | Total packets | Discarded packets |
| A | 0 | 2 | 0 |
| B | 0 | 2 | 0 |
| C | 0 | 2 | 0 |
| D | 0 | 2 | 0 |
| Quadrant | Total seconds | Saturated seconds | Saturation percentage |
|---|---|---|---|
| A | 6874 | 161 | 2.342159% |
| B | 6874 | 355 | 5.164388% |
| C | 6874 | 113 | 1.643875% |
| D | 6874 | 2285 | 33.241199% |
Noise dominated data is calculated using 1-second bins in cleaned event files. If a bin has >2000 counts, and if more than 50% of those come from <1% of pixels, then it is considered to be noise-dominated and hence unusable.
| Quadrant | # 1 sec bins | Bins with >0 counts | Bins with >2000 counts | High rate bins dominated by noise | Noise dominated (total time) | Noise dominated (detector-on time) | Marked lightcurve |
|---|---|---|---|---|---|---|---|
| A | 7085 | 6876 | 0 | 0 | 0.00% | 0.00% |  |
| B | 7085 | 6876 | 141 | 141 | 1.99% | 2.05% |  |
| C | 7085 | 6876 | 5 | 5 | 0.07% | 0.07% | 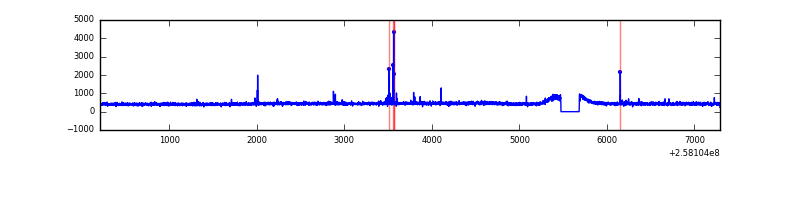 |
| D | 7085 | 6876 | 1524 | 1524 | 21.51% | 22.16% | 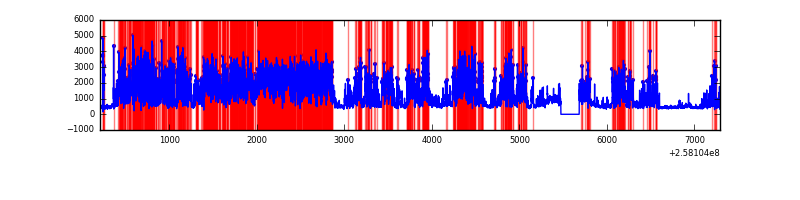 |
Top three noisy pixels from each quadrant. If the there are fewer than three noisy pixels in the level2.evt file, extra rows are filled as -1
| Pixel properties | Quadrant properties | ||||||
|---|---|---|---|---|---|---|---|
| Quadrant | DetID | PixID | Counts | Sigma | Mean | Median | Sigma |
| A | 8 | 15 | 200337 | 1207.77 | 801 | 782 | 165.2 |
| A | 12 | 189 | 117733 | 707.83 | 801 | 782 | 165.2 |
| A | 1 | 162 | 14359 | 82.17 | 801 | 782 | 165.2 |
| B | 4 | 239 | 668140 | 4375.53 | 792 | 772 | 152.5 |
| B | 0 | 197 | 57946 | 374.86 | 792 | 772 | 152.5 |
| B | 3 | 64 | 33936 | 217.44 | 792 | 772 | 152.5 |
| C | 15 | 208 | 42859 | 231.73 | 778 | 779 | 181.6 |
| C | 13 | 61 | 5714 | 27.18 | 778 | 779 | 181.6 |
| C | 8 | 128 | 3894 | 17.15 | 778 | 779 | 181.6 |
| D | 13 | 122 | 4792556 | 29237.84 | 678 | 658 | 163.9 |
| D | 1 | 52 | 1602522 | 9773.8 | 678 | 658 | 163.9 |
| D | 10 | 157 | 74890 | 452.93 | 678 | 658 | 163.9 |
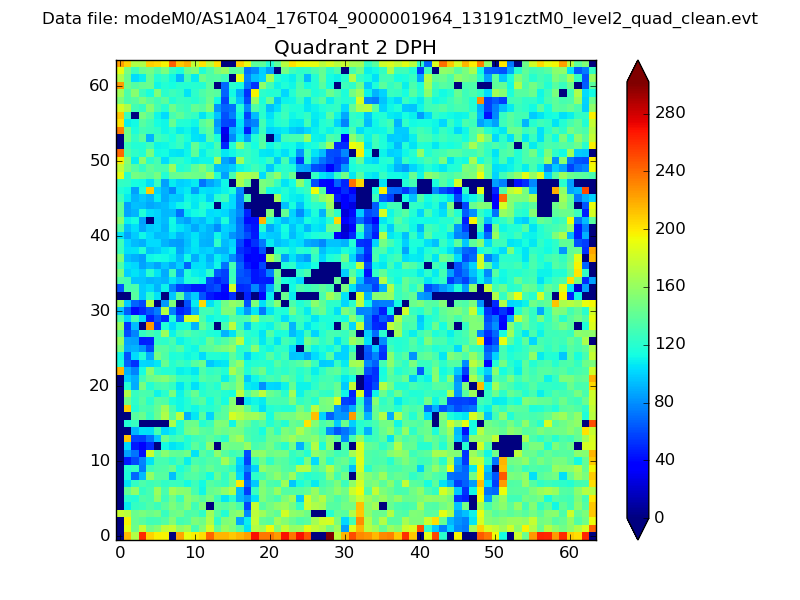
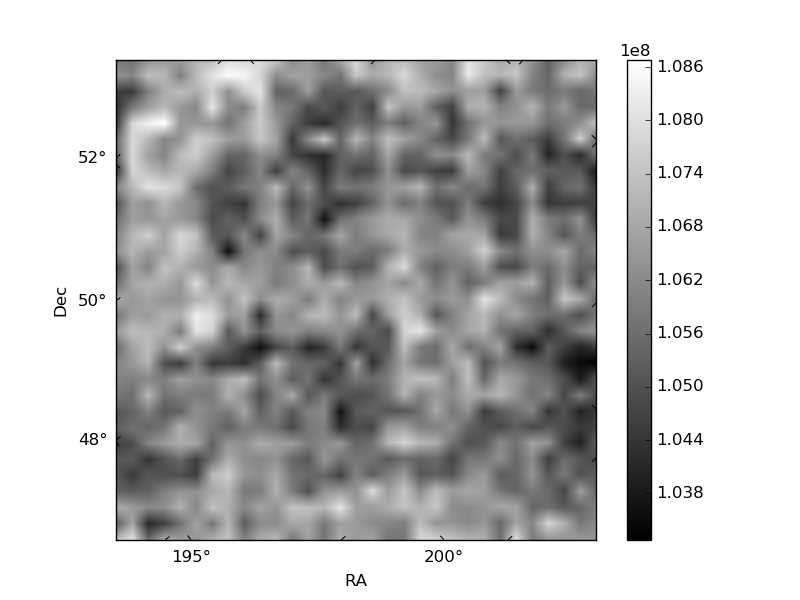
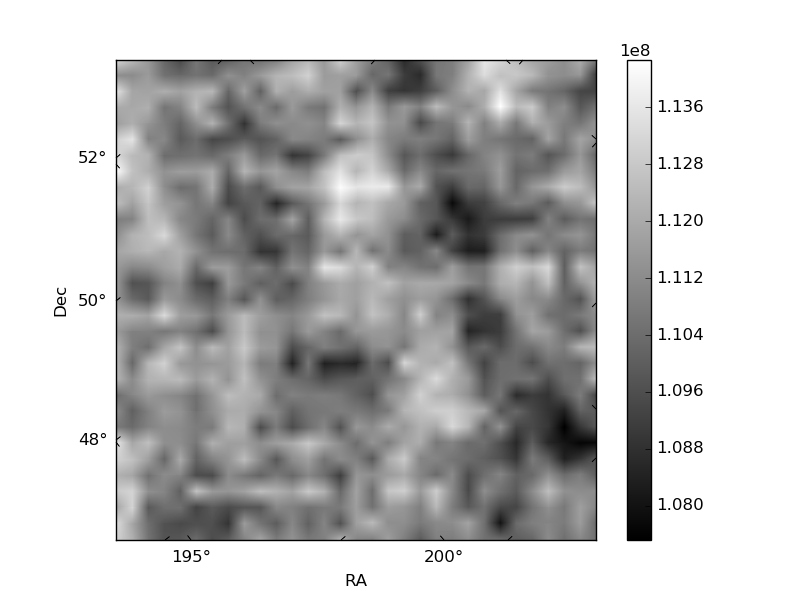
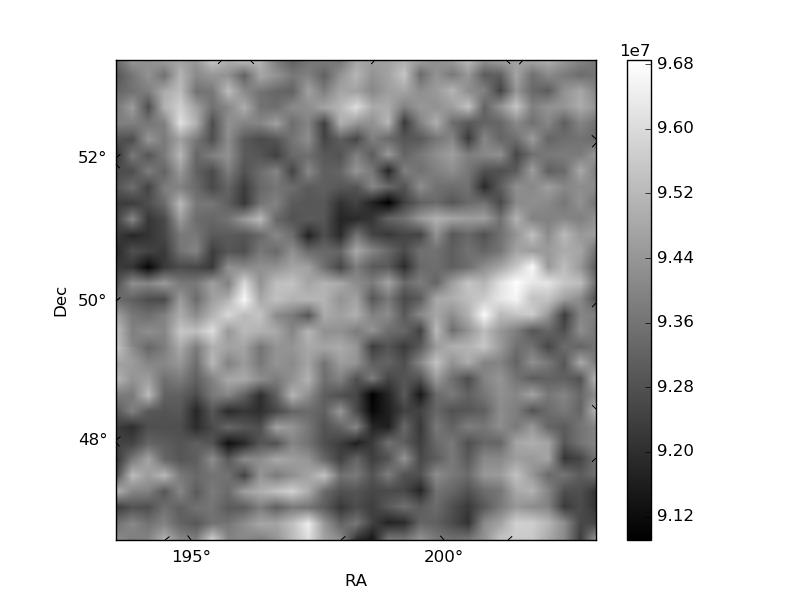
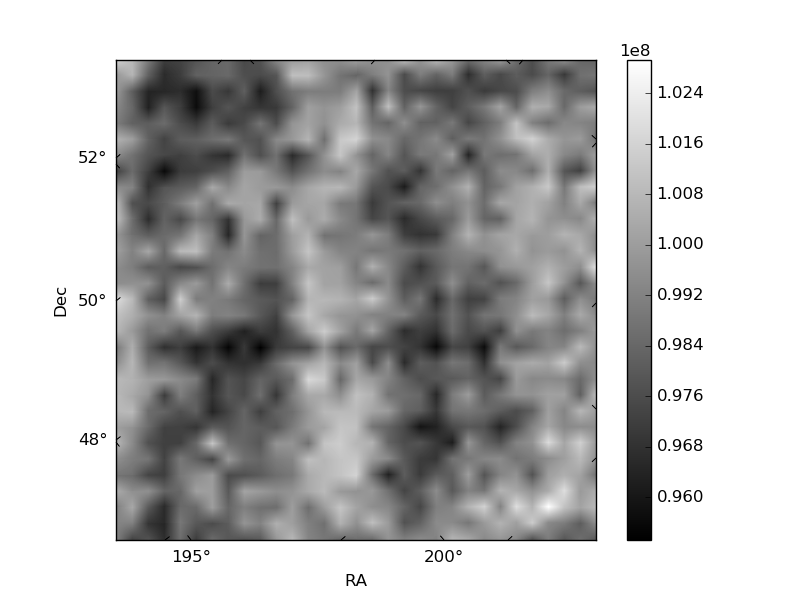
Histogram calculated using DETX and DETY for each event in the final _common_clean file
| Quadrant A | 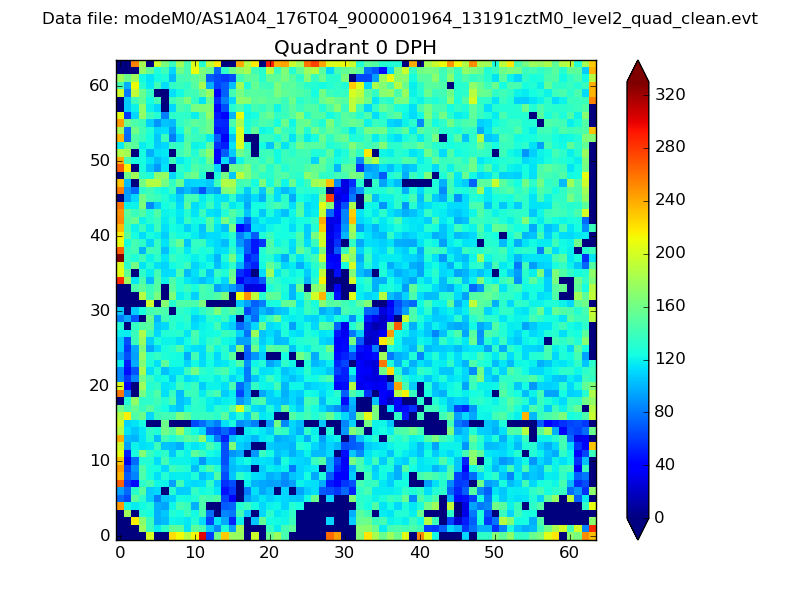 |
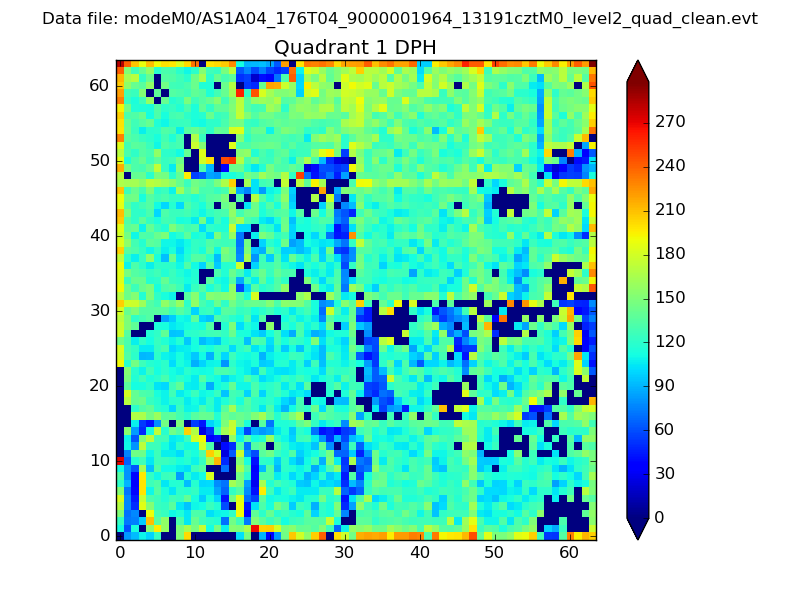 |
Quadrant B |
|---|---|---|---|
| Quadrant D | 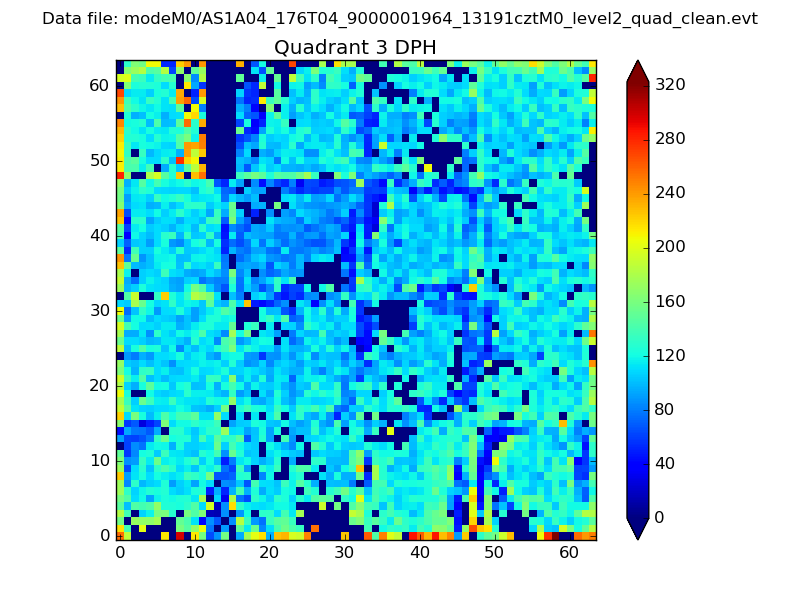 |
 |
Quadrant C |
| Plot type | Count rate plots | Images |
|---|---|---|
| Comparison with Poisson distribution Blue bars denote a histogram of data divided into 1 sec bins. Red curve is a Poisson curve with rate = median count rate of data. |
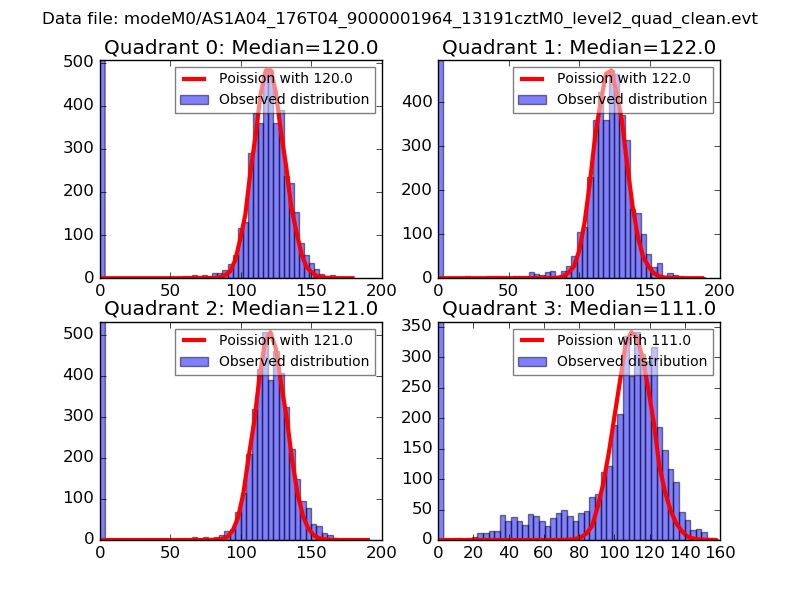 |
 |
| Quadrant-wise count rates Data is divided into 100 sec bins |
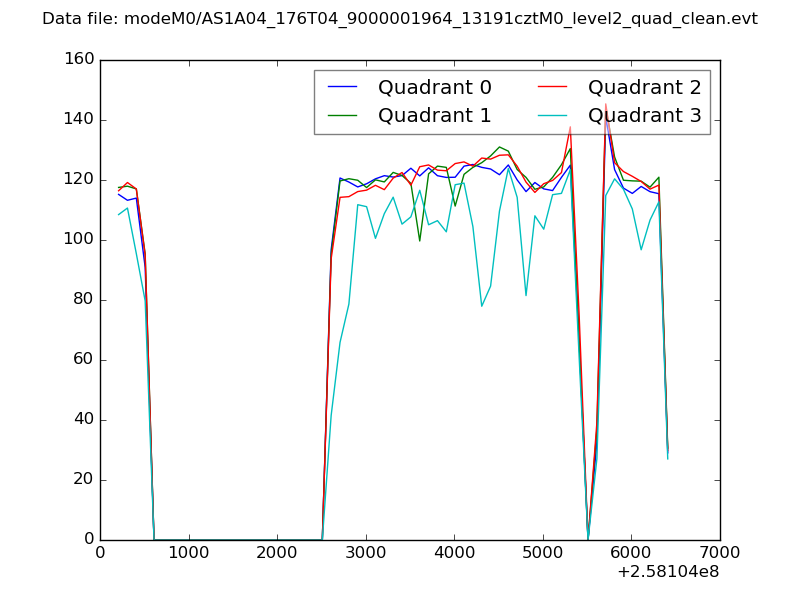 |
|
| Module-wise count rates for Quadrant A Data is divided into 100 sec bins |
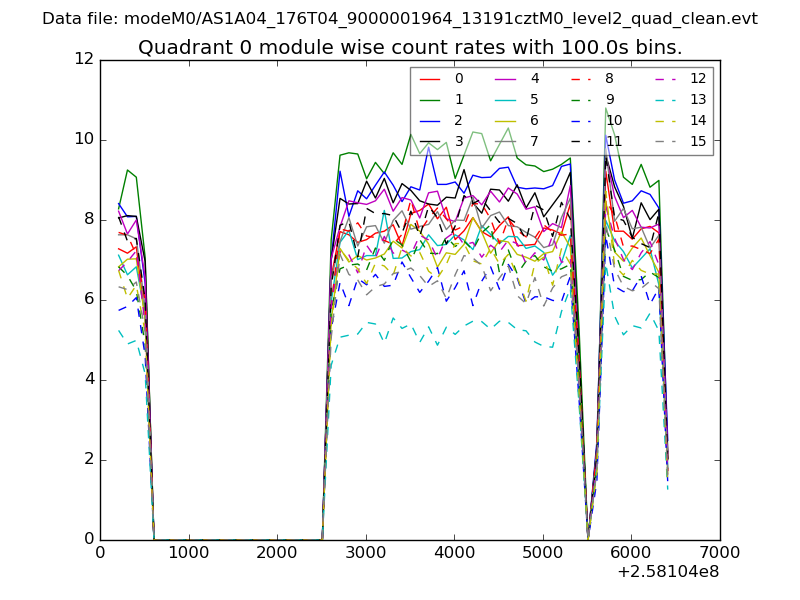 |
 |
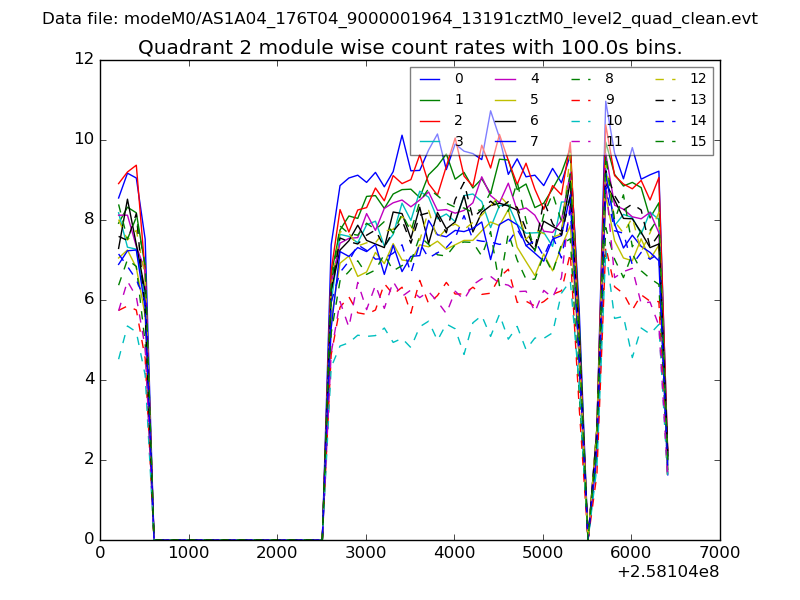
| Module-wise count rates for Quadrant B Data is divided into 100 sec bins |
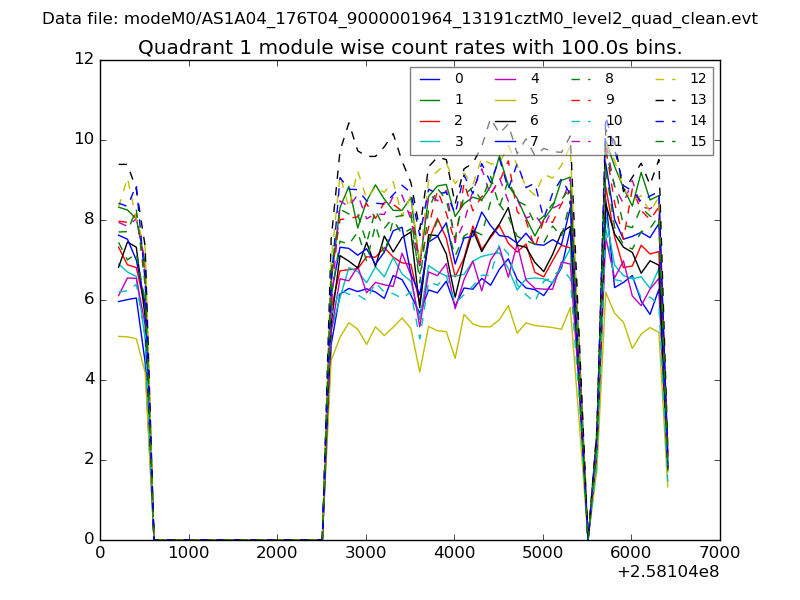 |
 |
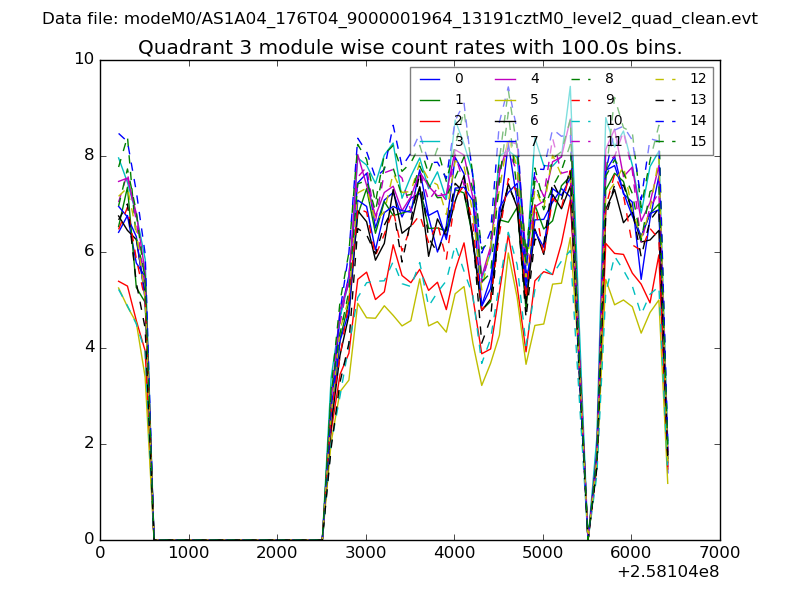
| Module-wise count rates for Quadrant C Data is divided into 100 sec bins |
 |
 |
| Module-wise count rates for Quadrant D Data is divided into 100 sec bins |
 |
 |
| Parameter | Plot |
|---|---|
| CZT HV Monitor | 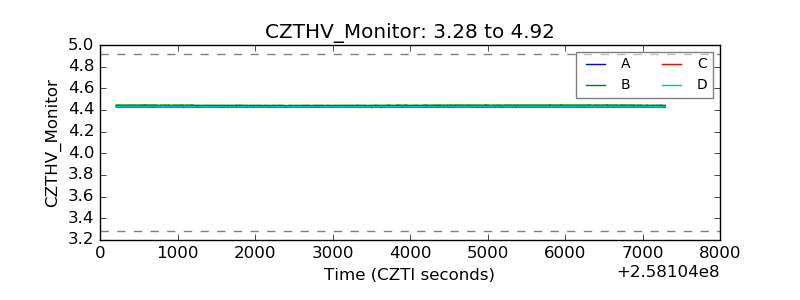 |
| D_VDD | 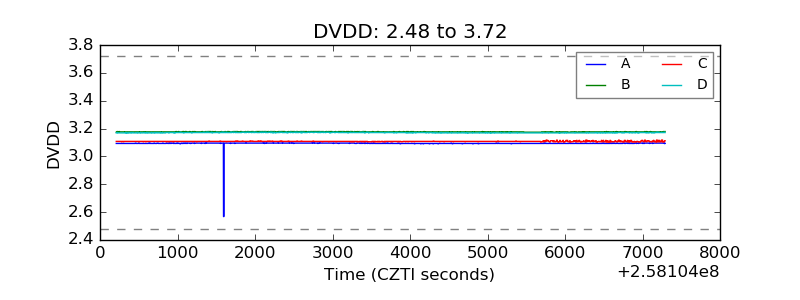 |
| Temperature 1 | 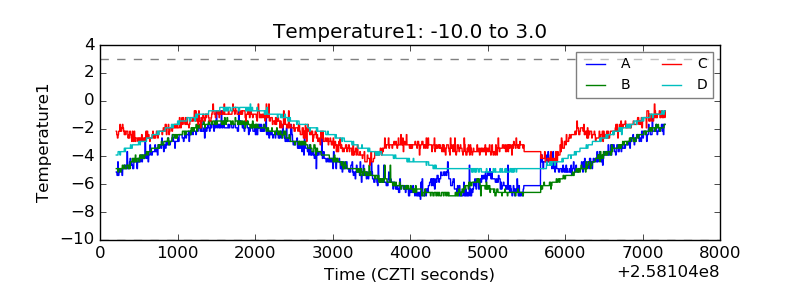 |
| Veto HV Monitor | 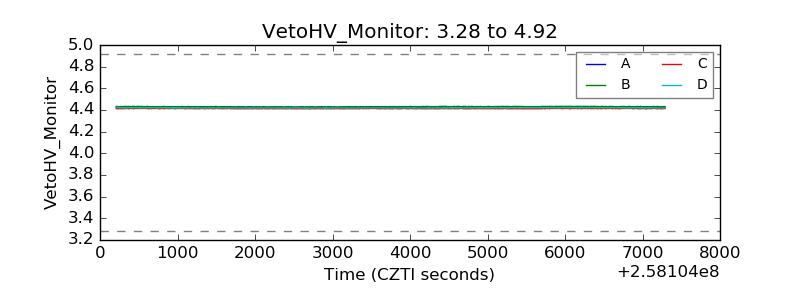 |
| Veto LLD |  |
| Alpha Counter | 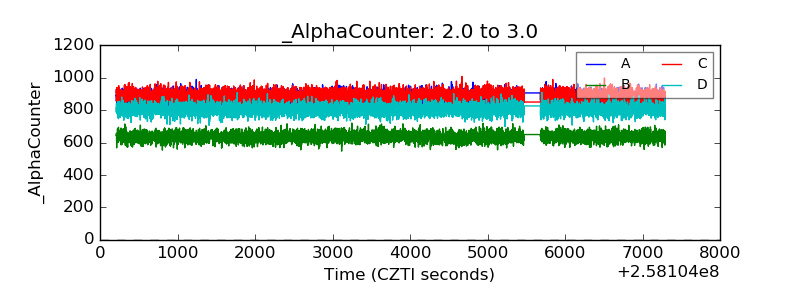 |
| _CPM_Rate | 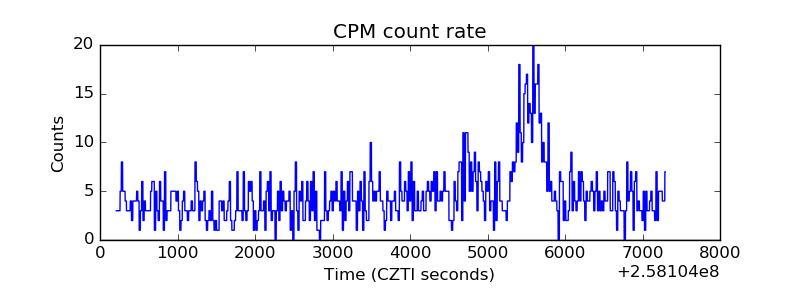 |
| CZT Counter | 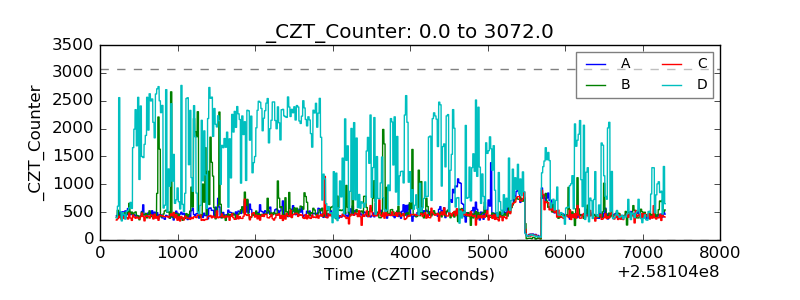 |
| +2.5 Volts monitor | 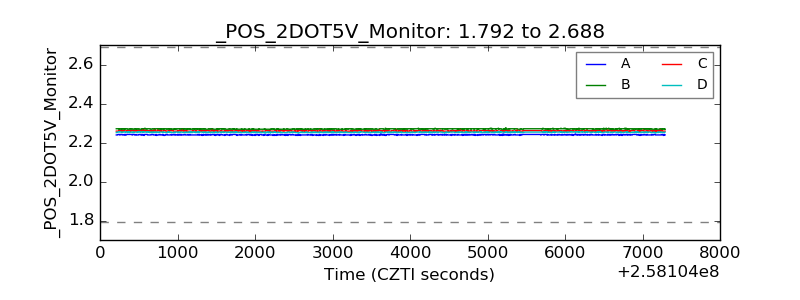 |
| +5 Volts monitor |  |
| _ROLL_ROT | 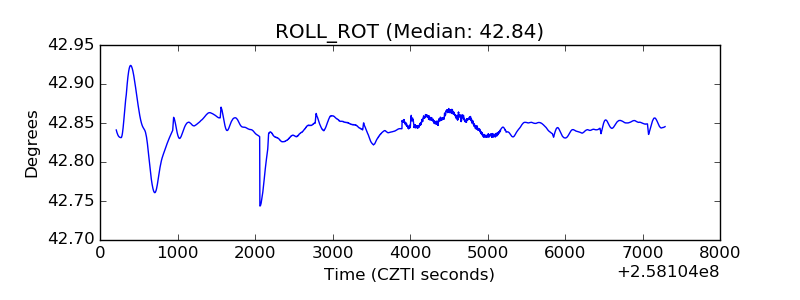 |
| _Roll_DEC | 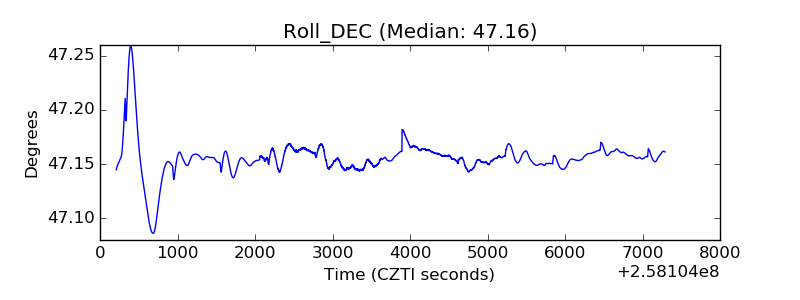 |
| _Roll_RA | 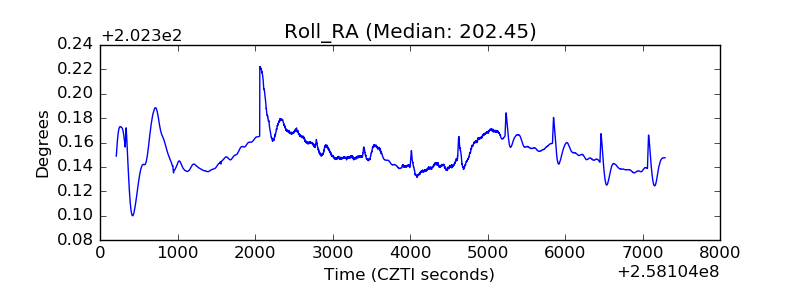 |
| Veto Counter | 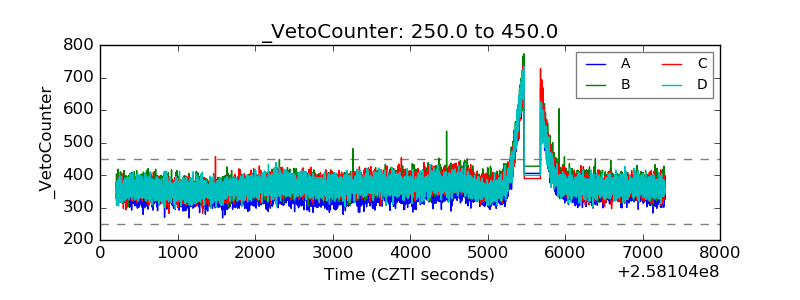 |